Rsi Rd MT5
- インディケータ
- Mubashir Mohamed Quraish Albarakat
- バージョン: 1.0
- アクティベーション: 15
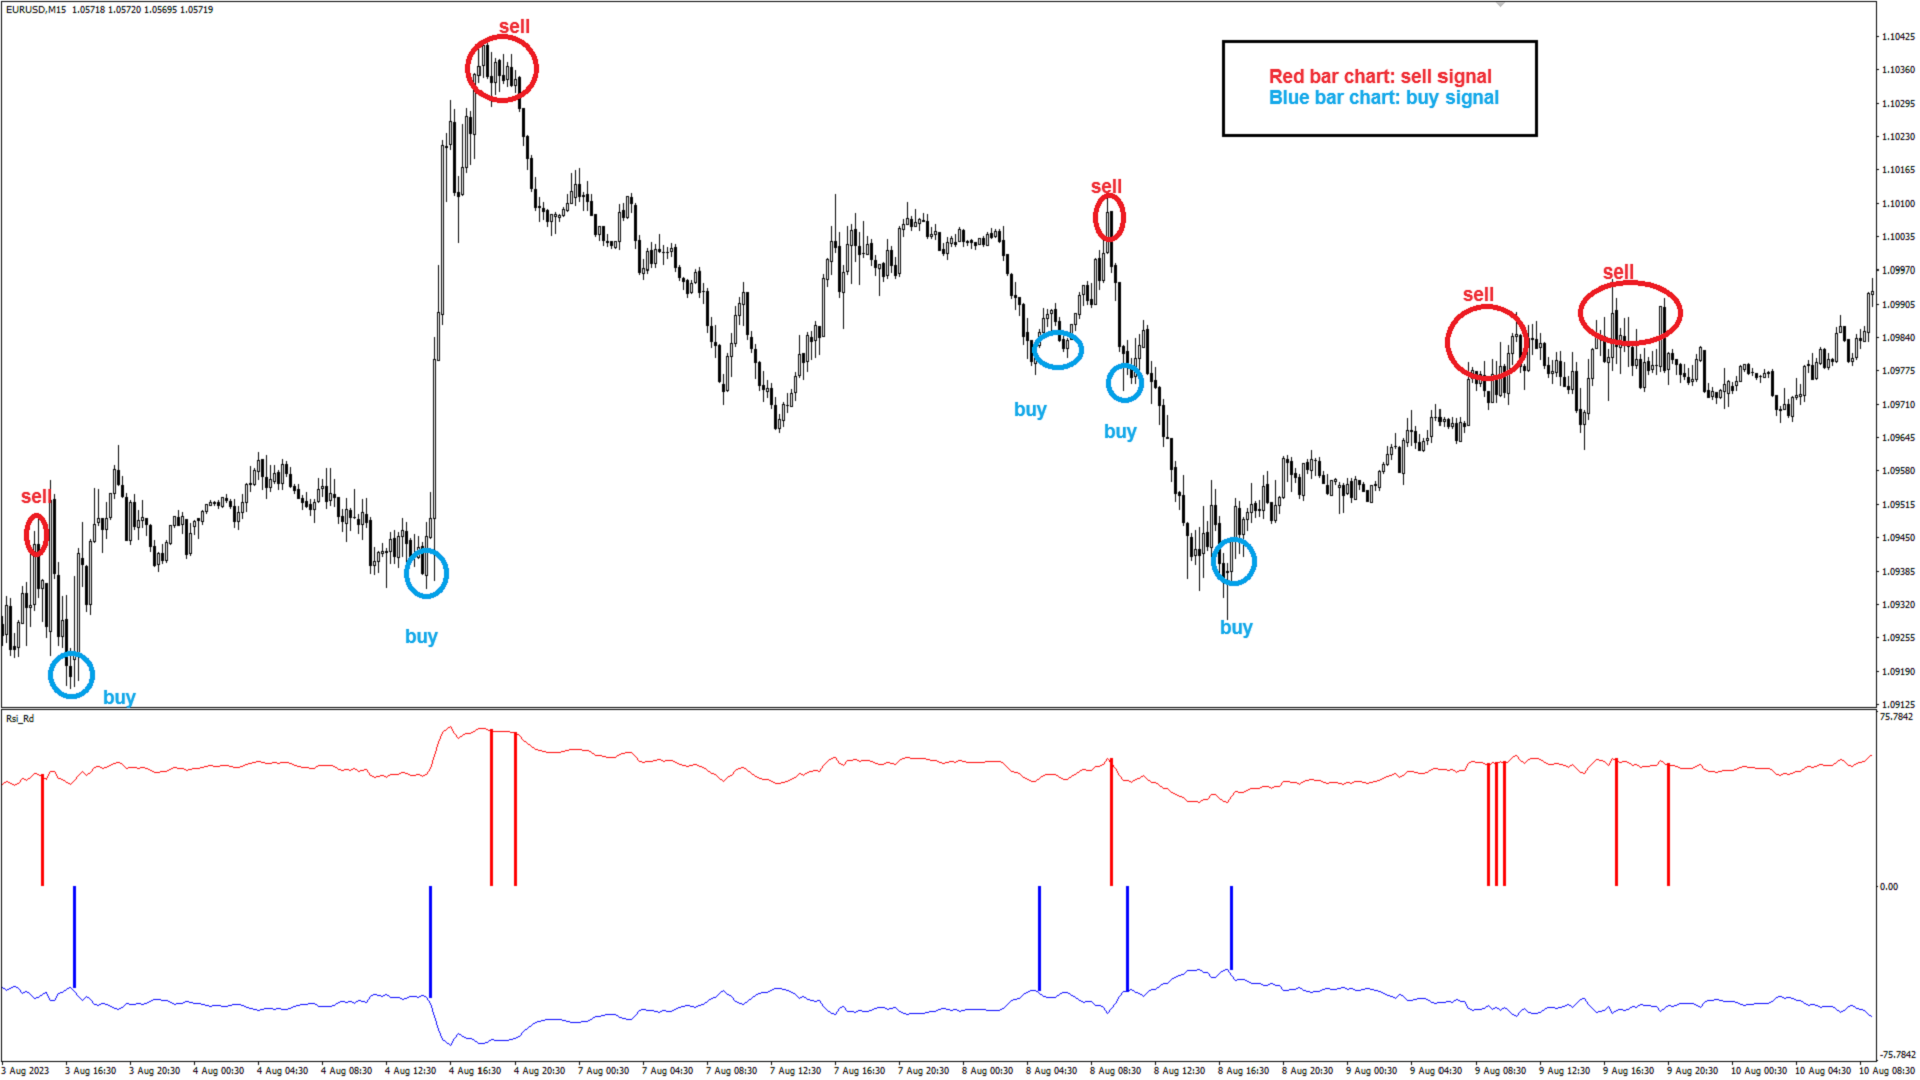
This indicator is based on the RSI indicator
Also, some candlestick patterns are used in it to identify better signals
Can be used in all symbols
Can be used in all time frames
Easy to use method
Adequate settings
Settings:
- period: The number of candles used to calculate signals.
- alarmShow: If you want to receive an alert in Metatrader after receiving the signal, enable this setting
- alarmShowNoti: If you want to receive an alert on your mobile after receiving a signal, enable this setting
- AlarmValue: Specify when to receive the alert. (This number specifies the index of the indicator)