• 概要
  • レビュー
  • コメント

Cobra Levels

コブラレベル

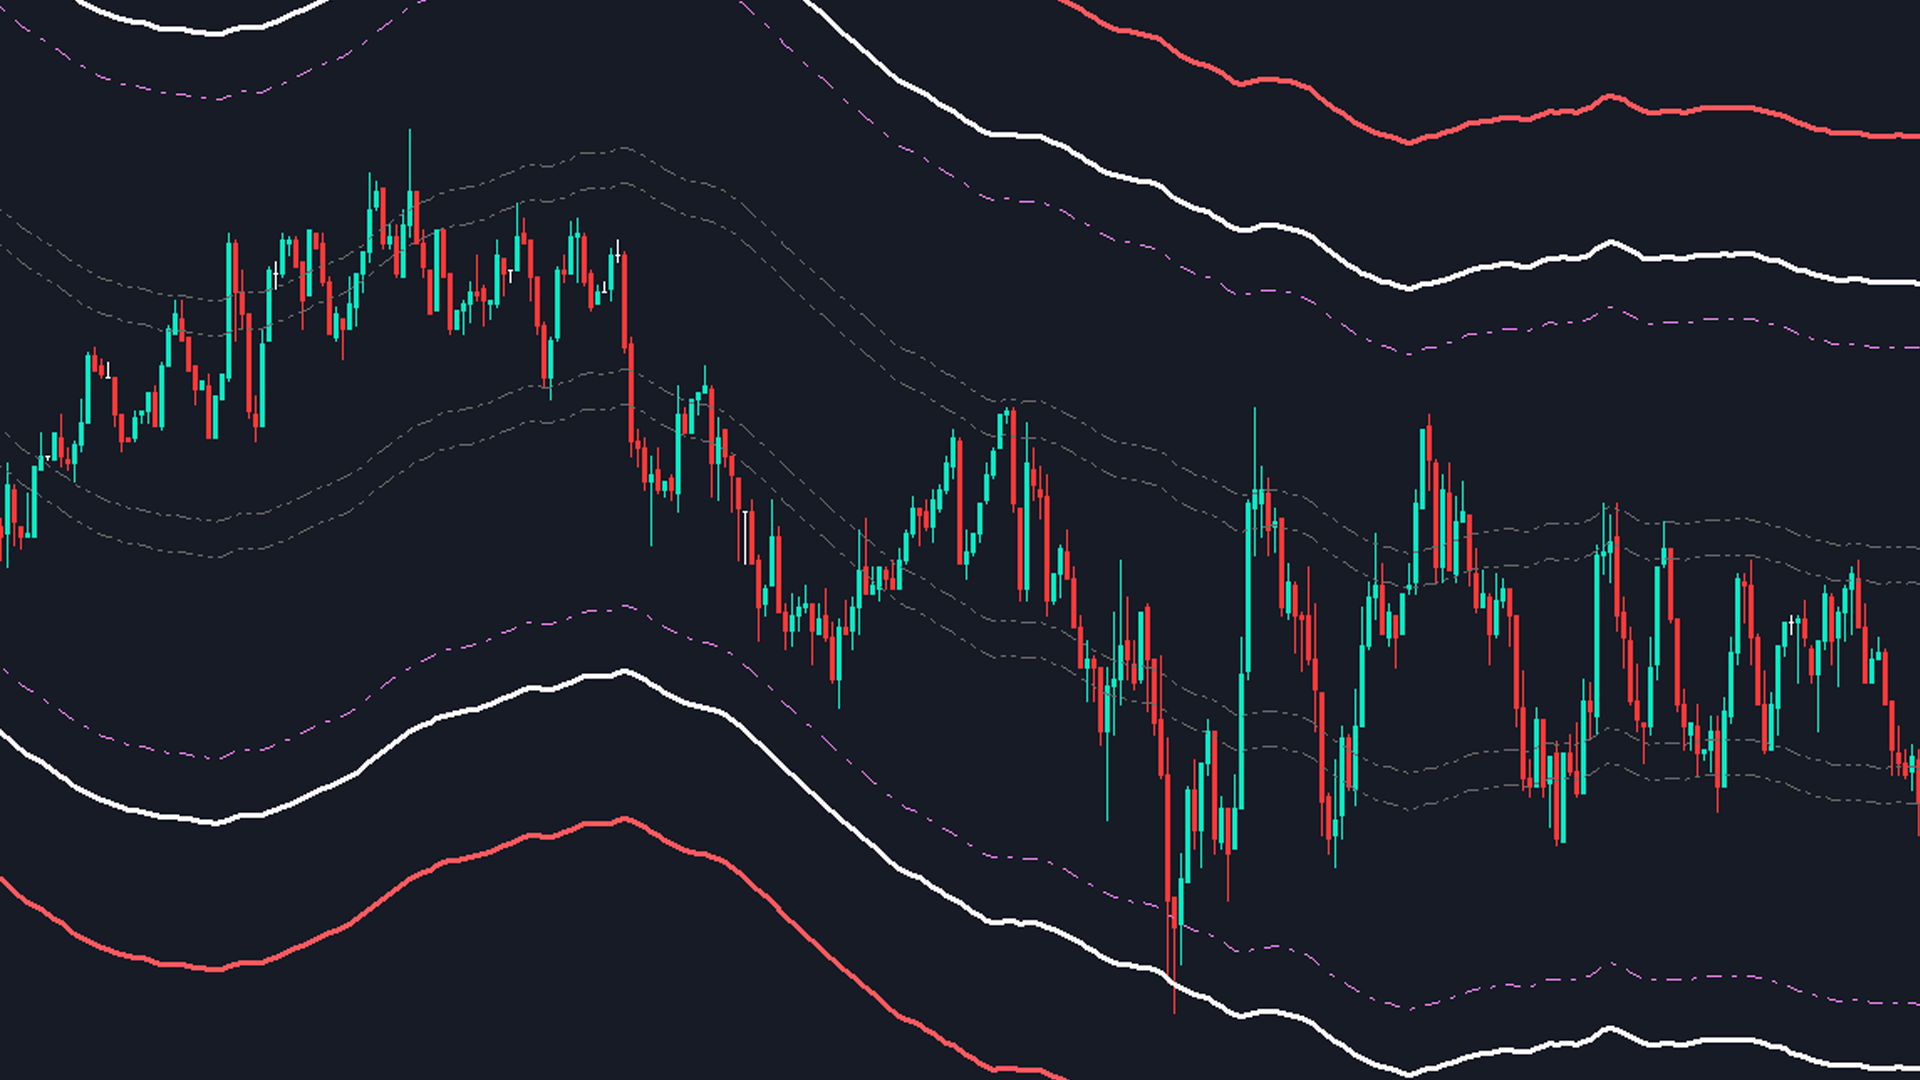
これらは、外国為替、暗号通貨、コモディティ、ニフティ、バンクニフティを含むユニバーサル市場で機能する 2 つの周波数モードを備えた 6 セットのレベルです。 これらは金融商品に関する最良の調査を経て出版されています。

上位レベルを U1 ~ U5 と呼び、下位レベルを D1 ~ D5 と呼びます。
市場は、通常の状態では U3 または D3 までの内部チャネル、または不安定な状態では外部チャネル U4 から U5 または D4 から D5 のいずれかでドライブする可能性があります。 価格が U3 U4 U5 または D3 D4 D5 に達すると、反転の可能性が非常に高くなります。トレーダーはローソク足の終値を待ってエントリーを確認し、有効なリスク管理を行って取引する必要があります。


このインジケーターでは、インジケーター設定のカスタマイズオプションによってレベルをシフトできます。 ユーザーは + または - ポイントを追加してレベルをカスタマイズできます

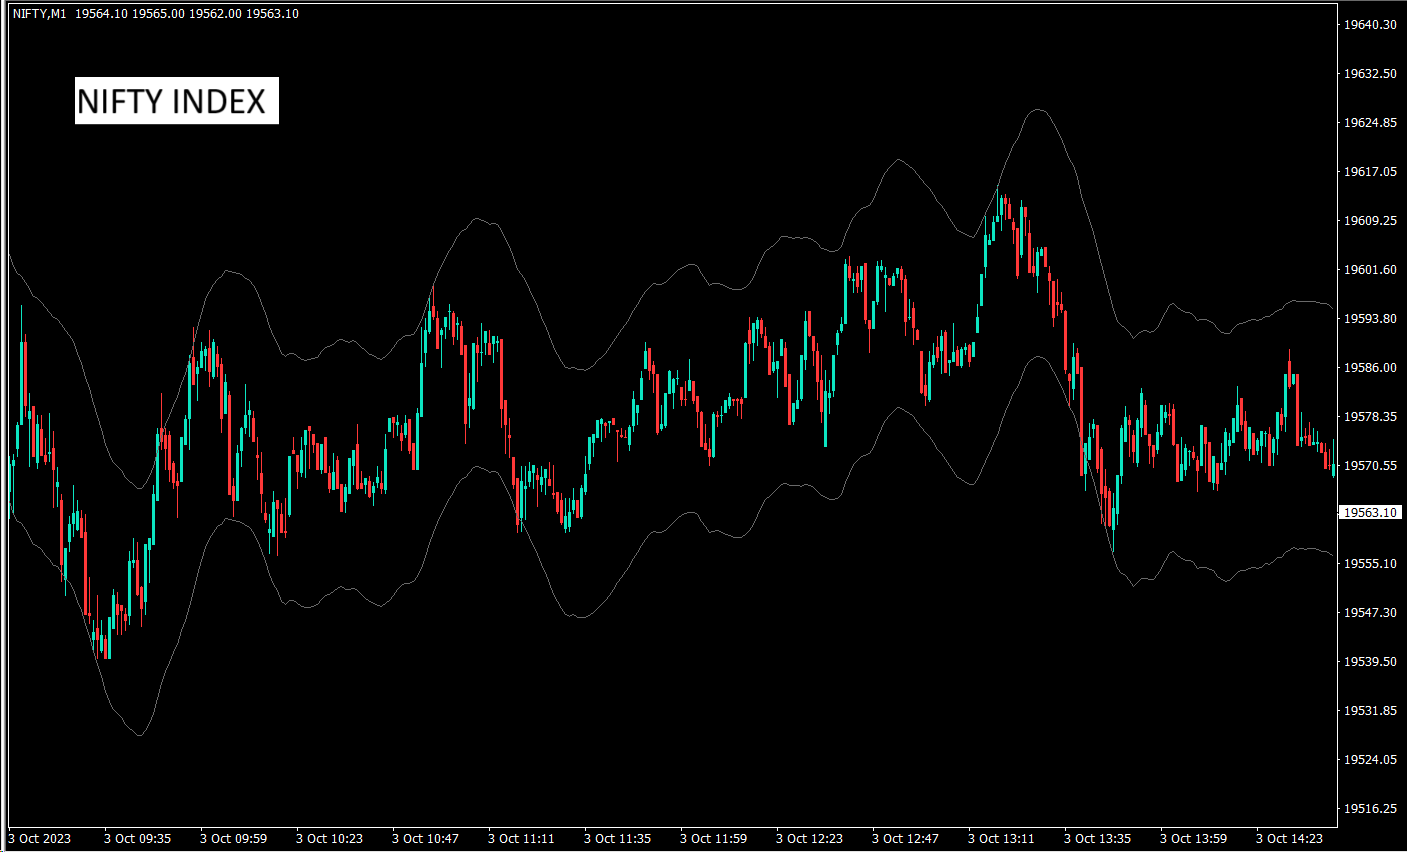
1. タイムフレーム: M1、M3、M5、M15、H1、H4 のみで作業しています。
2. 日中、スイング、ポジション取引手法に適しています
3. 他の指標と比較した調査に基づいて、最良の買われ過ぎと売られ過ぎの転換点を見つけるのに役立ちます
4. ダイナミックレベル:レベル値は時間に応じて毎分変化しますが、価格がどのような条件でもこれらのレベルに到達する基準を通過すると、サイクルが追跡され、反転が見られます。
5. アラート広告プッシュ通知を含める


取引戦略の詳細については、DMでご連絡ください。
おすすめのプロダクト
EMAGapCtrend
Eadvisors Software Inc.
O Robô Trader EMAGap faz operações de curto prazo no timeframe 1min buscando as pequenas variações do mercado no instrumento: Mini-índice(B3), utiliza nova tecnologia de trade, os resultados no intraday são íncríveis.    Versão exclusiva para os instrumentos WIN$ e IND$ (Mini-índice B3).  Estratégia utilizada: média móvel e volatilidade. Lote Inicial: Versão Mini-índice, a partir de 1 lote. Versão Bra50, a partir de 0.05 Mini-Lotes. StopLoss e Take Profit Ajustáveis. Gerenciamento de risco:
Entry and exit signals from the Double 7's Strategy by Larry Connors in his book "Short Term Trading Strategies That Work". Larry claims this strategy predicted the market's direction over 80% of the time since 1995. Picking up the gains and being exposed in the market less than 25% of the time. Good for swing trading on Daily charts of SPY, Nasdaq, China's FXI, Brazil's EWZ and the majority of the equity ETFs and World Indices. How does it work? The indicator activates the buy signal when
WAPV Box Effort x Result
Eduardo Da Costa Custodio Santos
MT5のWA_PV_BOX_EFFORTXRESULT WAPV Box Effort x Result Indicatorは、Package Indicatorsグループ(Wyckoff Academy Wave Market)の一部です。 MT5のWAPVボックスエフォートx結果インジケーターは、価格とボリュームを読み取るのに役立ちます。その読みは、努力×結果の特定を支援することで構成されています グラフによって作成された波で。 ボックスが緑色の場合のMT5のWAPVボックスの労力x結果インジケーターは、ボリュームが需要に有利であり、ボックスが赤色の場合を意味します ボリュームは供給に有利です。 ボックスが大きいほど、価格に対するボリュームの変位が大きくなります。価格の上昇波がボックスのサイズに比例しない場合、 努力×結果。 非常に視覚的な方法で、ボリュームと価格の間のこの相違を識別できます。 MT5のWAPVBoxEffort x Result Indicatorを使用すると、インジケーターをゼロ軸の下に配置することで、視覚化を向上させることもできます。 ティックボリュームとリア
Fundamentação teórica Rate of Change - taxa de mudança (ROC) O ROC é um oscilador que flutua acima e abaixo de uma linha de zero, medindo a variação percentual de preços ao longo de determinado período. O ROC de 20 períodos mede a variação percentual de preços ao longo de 20 períodos, quanto maior a diferença entre o preço atual e o de 20 períodos atrás, maior o valor do ROC. Quando o indicador está acima de zero, a variação percentual é positiva indicando tendência bullish, se o indicador está
FREE
Limitless MT5 is a universal indicator suitable for every beginner and experienced trader. works on all currency pairs, cryptocurrencies, raw stocks Limitless MT5 - already configured and does not require additional configuration And now the main thing Why Limitless MT5? 1 complete lack of redrawing 2 two years of testing by the best specialists in trading 3 the accuracy of correct signals exceeds 80% 4 performed well in trading during news releases Trading rules 1 buy signa
Weis Wave with Alert MT5
Trade The Volume Waves Single Member P.C.
4.93 (15)
Rental/Lifetime Package Options and Privileges  * For optimum results the yearly or lifetime package is suggested due to live training ! Rent Monthly Six Months   Yearly/Lifetime Weis Wave with Speed with Alert+Speed Index x x x Manual  x x x Quick Set up Video x x x Blog x x x Lifetime Updates x x x Setup and Training Material x x Free Rectangle Break Alert Tool      x Discord Access Channel "The SI traders" x 2-hour live methodology training x How to trade with it:    http://
Indicador en base a la pendiente de la linea de precio, dibuja una línea de color cuando sube a base de los precios que previamente has sido procesados o linealizados, y cuando baja la pendiente la linea linealizada toma otro color. En este caso se a considerado 6 lineas de diferentes procesos desde pendientes largas hacia las cortas, observándose que cuando coincidan las pendientes se produce un máximo o mínimo, lo que a simple vista nos permitirá hacer una COMPRA O VENTA.
The Red Devil Shorter is a fully automatic short setup based on EMAs and SMAs. Attention:  Only 9 of 10 copies left at the price of $250, after that the price goes up to $499 Signal:  https://www.mql5.com/de/signals/1826330 We use this great EA exclusively for the EUR/CHF pair, as we developed it specifically for that. The idea behind the setup is the weakness the EUR/CHF shows in the default time.  The trades are mainly closed by counter signals or the set time. In rare cases, trades are closed
Exclusive FOREX account HEDGE FuzzyLogicTrendEA is based on fuzzy logic strategy based on  analysis 5 indicators and filters. When the EA analysis all this indicators, it decides, based on its fuzzy strategy, which trade will be better: sell or buy. As additional functions, it´s possible defines spread maximum, stop loss and others. Recomm. Symbol: EURUSD, AUDUSD, GBPUSD, NZDUSD, USDCAD, AUDCAD, EURCAD e USDJPY Recomm. timeframe: H1. Backtest were done on EURUSD, H1, 01/07/2023 - 26/0
The best time to trade Using this Indicator is when the time reach exactly hour,half,45 minutes,15 minutes and sometimes 5 minutes.. This indicators is helpful to those who trade boom and crash indecies.How to read this indicator first you'll see Blue allow and Red allow all these allows used to indicate or to detect the spike which will happen so the allow happens soon before the spike happen.This indicator works properly only in boom and crash trading thing which you have to consider when
The "Super Trend Alert MT5" is an indicator designed for the MetaTrader 5 (MT5) trading platform. The specific details and functionality of this indicator may depend on the version or settings you are using. The Super Trend indicator is a popular technical analysis tool that helps identify the direction of the current market trend. It is displayed as a line on the price chart and is accompanied by alerts to notify traders of potential trend changes. To use the "Super Trend Alert MT5" indicator i
QuantumAlert RSI Navigator is a free indicator available for MT4/MT5 platforms, its work is to provide "alerts" when the market is inside "overbought and oversold" regions in the form of "buy or sell" signals. This indicator comes with many customization options mentioned in the parameter section below, user can customise these parameters as needful. Join our MQL5 group , where we share important news and updates. You are also welcome to join our private channel as well, contact me for the priva
FREE
CPT ea
Khalid Ait
5 (2)
Let me share one of my best EAs with you. CPT is a shortcut for three words. a name that explains a purpose. I cannot say it because it's against MQ instructions, but when you use this EA, you will understand what I'm talking about. As a beginner, I passed from the phase of losing in the market to be positive. I made parties at that time because I thought it was the top, and now everything will be easy. But... I got into a painful losing streak of six months to understand that making some
Robo davi I
Lucas Silvino Da Silva
Robô Davi I by Êxodo Capital is a professional system for traders created for the MT5 platform and optimized to work with MINI FUTURE INDEX (WIN) at B3 in BRAZIL. The system uses bias algorithms. After identifying the trend, the position is opened and the robot conducts the trade through a trailing stop that will be driven by the 13-period average. Maximum GAIN of 2200 pts. Main features Our setup has the option to use martingale, the EA has the option to customize. Presentation in the
DemsFx BC Entry EA
Desmond Ebimobowei Dogubo
1. The Expert Adviser is built with a basic, simple and stable trading strategy with i touch or Price Action Principle that is highly effective and accurate with a sniper entry system for a good money management.. 2. The expert advisor works best as from 15 minutes time frame and above.... 3. The expert advisor work with all broker all currency pair and synthetic indices... 4. Use a reasonable lot size and correct settings if you want to get the best of the Expert Advisor.. 5. With Default setti
FREE
The indicator measures the balance of aggression. The formula is as follows:   Aggression  = Purchase Volume - Sales Volume. Note : It is rec ommended to use the default configuration and VPS values. It does not work in Forex. Meet Our Products     Parameters : Numbers of days prior to the current one for calculation; Volume Divider e; Enables calculation of the current candle; Histogram Line style and; Size; Line Line style and; Size;  Follow us on our website to check the next new
Swiss VWAPsimple Motivation Did not find free VWAP that works, the one that I found craseh. So I created a VWAP which calculates values only for the actual day. So computer resouces are not over stressed. What is VWAP, how is it used?  VWAP stands for Volume Weighed Average Price, it calculates the running sum of tick volume and the runnung sum of price times tickvolume. The division of these sums result in a weighed price (Sum P*V/Sum V). The calculation starts normally at midnight. The value
FREE
Easy GOLD MT5
Franck Martin
4.91 (11)
Easy Gold is the latest addition to the BotGPT family. It is surprising and very powerful. It is ideal for beginners due to its simplicity.  There is absolutely nothing to do, it's 100% automated, simply indicate the percentage of risk you want to take per trade and the EA is ready. Whatever your capital, the EA takes care of everything. Optimized on (XAUUSD).  Unleash all the power with the professional version (AGI Gold) and its connection to the neural network, available in my store. My othe
FREE
Recommended Use: XAUUSD , EURUSD,  USDJPY. This EA does NOT USE risky strategies like Martingale or Grid ! Each order has its own stop loss. EA built by me and experienced investors with multiple strategies included. Taylored to auto adapt to inumerous market conditions, uses a lot of indicators, and some of them build internaly. Use brokerage accounts with low spreads (ICMarkets, Tickmill ...) Observation: 1. There is no guarantee of future results, but use only brokerage accounts wit
ADR ST Patterns Strategy  is a modification of the classical  ADR  indicator. This simple indicator corresponds to the parameters specified in the  ST Patterns Strategy ( https://stpatterns.com/ ) .  Structural Target Patterns represents the market consistently divided into components. No trend lines, geometric proportions of the model itself, trading volume, or open market interest are needed for the formation of  ST Patterns . They are easily recognized and built only on the basis of breaking
FREE
TrendOnCloseは、特定のローソク足サイクル内のトレンドとカウンター トレンドの統計分析に焦点を当てた、バイナリー市場投資家向けの高度 なインディケータです。 各サイクル は、ローソク足の終値によって定義され、次のサイクルが始まるまでの間、トレン ド方向(UP/DOWN - BULL/BEAR)を確立します。統計分析は2つの構成で行われます: ⦁ SUBSEQUENT CANDLEとしての統計目標: アルゴリズムは、サイクル内の後続のローソク足に焦点を当てます。 ⦁ INTERCYCLESとしての統計ゴール: アルゴリズムは、各サイクル間のすべてのローソク足を考慮する。 選択された統計目標に基づき、各ローソク足のトレンドがCYCLEローソク足のトレンドと比較され、同一方向の場合はTREND-Percent(TD)とTrend-Occurrences(N-TD)が増加し、トレンドが乖離している場合はCOUNTER-TREND(CTとN-CT)が増加します。さらに、このインジケータは、日足、週足、月足の統計的な合計を提供し、これらの期間中、各サイクル の「トレンド」ま
Bollinger Bands B
Flavio Javier Jarabeck
5 (3)
John Bollinger created this indicator in 2010 as a way to read the original indicator (Bollinger Bands) in a more "technical" way, shown as an oscillator. The typical range of the Bollinger Bands %B is 0 - 0.5 - 1.0, where "0" represents the lower band, the "0.5" the middle band, and "1" the upper band. The line on the indicator represents the Closing prices. As simple as that. SETTINGS Bollinger Bands period of analysis Standard Deviation multiplier Shift Price type to be analyzed If you
FREE
Key level wedge MT5
Presley Annais Tatenda Meck
The   Key level wedge MT5   indicator automatically draws rising wedge pattern and falling wedge pattern for you on the chart. This pattern is really good when used as a confirmation entry at key support & resistance, supply & demand and reversal zones. Advantages  The   Key level wedge MT5   block DOES NOT RE-PAINT, giving you confidence when a signal appears and also helps when looking back.  The   Key level wedge MT5   includes an on/off button on the chart to easily keep the charts cle
Bollinger Bands Percentage
Emanuel Cavalcante Amorim Filho
Bollinger Bands %  or Bollinger Bands Percentage is one of the indicators used in the Sapphire Strat Maker - EA Builder . It is calculated using the following formula: Perc = (CLOSE_PRICE - LOWER_BOLLINGER) / (UPPER_BOLLINGER - LOWER_BOLLINGER) * 100 Thus, by taking the difference between closing price to the lower band and dividing it by the difference of the upper and the lower price levels of a Bollinger Bands indicator, we can calculate this indicator. It shows how far the price is f
FREE
MIDAS Super VWAP
Flavio Javier Jarabeck
4.29 (14)
Imagine VWAP, MVWAP and MIDAS in one place... Well, you found it! Now you can track the movement of Big Players in various ways, as they in general pursue the benchmarks related to this measuring, gauging if they had good execution or poor execution on their orders. Traders and analysts use the VWAP to eliminate the noise that occurs throughout the day, so they can measure what prices buyers and sellers are really trading. VWAP gives traders insight into how a stock trades for that day and deter
FREE
Compass B3 Trader é um robô especialista em trades automatizados para o iBovespa (Miniíndice WIN e Minidólar WDO), baseado na estratégia de análise de inclinação de média móvel. A partir de estabelecimento da inclinação desejada, o robô realiza as entradas de trades, seguindo takeprofit e stoploss fixos ou dinâmicos conforme análise de velas. Ainda, pode-se configura um sistema de trail de stoploss possibilitando trades completos e de grandes grandes (+ pontos). Ativos: WIN, WDO. Timeframe: M1,
Donchian Pro
Paulo Henrique Faquineli Garcia
5 (2)
The Donchian Channel Channels are among the most popular tools of technical analysis, as they visually convey to the analyst the limits within which most price movement tends to occur. Channel users know that valuable information can be obtained at any time, whether prices are in the central region of a band or close to one of the border lines. One of the best known techniques to explore these concepts is Bollinger Bands. However, John Bollinger was not the only one to research the applicatio
FREE
Wave Box Market Frenquency
Jean Jacques Huve Ribeiro
4.83 (6)
Totally linked to the result of a movement and the duration he had. Its height records how many ticks the asset walked during a given movement, its width shows us the duration that movement had. Its configuration must be in line with the Weis Wave Indicator configuration to observe the movement force and can indicate a possible accumulation or distribution of the movement;
FREE
Descubra o EA para Mini Índice, o segredo do sucesso no mercado financeiro! Desenvolvido com anos de observação cuidadosa, este EA utiliza sinais exclusivos de entrada e saída para garantir resultados impressionantes. Prepare-se para uma jornada lucrativa! Graças a dois indicadores poderosos, cuidadosamente configurados (e forneceremos as configurações exatas), este EA oferece resultados excelentes. Imagine maximizar sua taxa de acerto e o payoff, enquanto mantém um baixo drawdown. Sim, é possí
Expert Amazo
Guilherme Geovanini Fraga
EXPERT AMAZO é um Expert Advisor projetado especificamente para negociar WIN (mini índice) e WDO (mini dólar). A operação é baseada na abertura de ordens utilizando alguns indicadores como Sars parabólicos, médias móveis, Bandas de Bollinger, Fibonacci, etc., trabalhando de acordo com 3 modalidades de estratégia, o AMAZO procura prever os movimentos do mercado com operações contra ea favor da tendência.        Entre em nosso Grupo de WhatsApp para receber as melhores configurações do Expert.
このプロダクトを購入した人は以下も購入しています
Professional Scalping Tool on Deriv Attention! The indicator will be sold in limited quantities!!! The previous 5 copies were sold for $250 The next 5 copies will be sold for $350 The next price is $500 Description: This trading indicator is designed for professional traders focused on scalping. Designed with the market in mind, it provides highly accurate spike trading signals. It works on the M1 timeframe and supports the following symbols: Boom 300 Index, Boom 500 Index, Boom 1000 Index,
Bill Williams Advanced is designed for automatic chart analysis using Bill Williams' "Profitunity" system. The indicator analyzes four timeframes at once. Manual (Be sure to read before purchasing) Advantages 1. Automatically analyzes the chart using the "Profitunity" system of Bill Williams. The found signals are placed in a table in the corner of the screen. 2. Equipped with a trend filter based on the Alligator indicator. Most of the system signals are recommended to be used only accordi
note: this indicator is for METATRADER4, if you want the version for METATRADER5 this is the link:  https://www.mql5.com/it/market/product/108106 TRENDMAESTRO recognizes a new TREND in the bud, he never makes mistakes. The certainty of identifying a new TREND is priceless. DESCRIPTION TRENDMAESTRO identifies a new TREND in the bud, this indicator examines the volatility, volumes and momentum to identify the moment in which there is an explosion of one or more of these data and therefore the mome
ENG-GOLD Scalper It is an auxiliary indicator that identifies potential targets and determines the place of entry with a stop loss that works on Heiken Ashi candles  The green lines are usually the targets, the red lines are the stop loss, and the yellow lines are the entry location.  This file is recognized on small and medium frames, usually less than the watch frame I highly recommend using XAUUSD US100 US30 USOIL 
Gannスクエアインジケーターは、W.D. Gannによって執筆された「市場予測のための数学的な式」の記事に基づく強力な市場分析ツールです。このツールは、解析に数学的な概念を応用し、Gann理論に基づいています。それは、144、90、52のスクエアや9のスクエアなど、Gannの関連テクニックの要素を取り入れています。さらに、の方法を組み込んでおり、9のスクエアとその関連性についてのチャネルやスターパターンに焦点を当てています。 ユーザーマニュアルと使用方法: このインジケーターを使用する前に、ユーザーマニュアルを読んで疑問点を解決するためにお問い合わせいただくことをお勧めします。ユーザーマニュアルの完全版は、当社のウェブサイトで入手できます。 MT5の完全版は購入できますし、MT4の無料版も試すことができます。両方のバージョンへのリンクを提供していますので、ご利用ください。 主な機能と機能: Gannスクエアインジケーターは、市場分析のための完全なツールセットを提供し、幾何学的な概念とGann理論に基づいて的確な判断を行う手助けをします。以下に主な機能を示します。 9のスクエアの分析:
スイングトレーディング は、トレンドの方向のスイングと可能な反転スイングを検出するように設計された最初のインジケーターです。トレーディングの文献で広く説明されているベースラインスイングトレーディングアプローチを使用します。インディケータは、いくつかの価格と時間のベクトルを調査して、全体的なトレンドの方向を追跡し、市場が売られ過ぎまたは買われ過ぎて修正の準備ができている状況を検出します。 [ インストールガイド | 更新ガイド | トラブルシューティング | よくある質問 | すべての製品 ] むち打ちを起こさずに市場スイングの利益 インジケーターは常にトレンドの方向を表示します 色付きの価格帯は機会のベースラインを表します 色付きのダッシュは、可能な反転スイングを表します この指標は、独自の品質とパフォーマンスを分析します 複数時間枠のダッシュボードを実装します カスタマイズ可能なトレンドおよびスイング期間 電子メール/サウンド/プッシュアラートを実装します インジケータは再描画またはバックペインティングではありません Swing Tradingとは Swing Tradi
RAD CRITICAL LEVES RAD indicator tracks “Relevant Volume” in real time, identifying accumulation and distribution processes, projecting them in the chart as SUPPORT or RESISTANCE zones. Natural   support   and resistance levels are generated by Volume Accumulation and Distribution processes. As these processes evolve, levels at which the relevant volume in the market place is positioned, become difficult areas to cross upwards or downwards. By using this information, traders can identify very s
IVISTscalp5
Vadym Zhukovskyi
5 (3)
iVISTscalp5インジケーターをご紹介します。このインジケーターは、トレーディングにおいて独自でありながら効果的です。時間データに基づくこのインジケーターは、多年にわたる経験と金融市場の深い分析の結果です。iVISTscalp5インジケーターは、手動トレーディングにとって優れたツールです。便利さ、簡単さ、可視化 - すべての複雑さが内部に隠されています。私たちは、iVISTscalp5インジケーターの設定と使用を最大限に簡素化しました。このインジケーターは、MT5ターミナルにあるすべての金融商品に適しています。 稼働時間は、4時から20時(UTC+3)です。 iVISTscalp5インジケーターメニュー(スクリーンショット1を参照): History - 引用を計算する週数 dT_min - 時間間隔の選択(分) TFline - 水平ボリュームの作成(時間枠) BARSline - 水平ボリュームの作成(バー数) TFtrend1 - デイリーチャンネルの作成(時間枠) BARStrend1 - デイリーチャンネルの作成(バー数) TFtrend2 - 週次チャンネルの作成(時
VTrende Pro
Andrii Diachenko
5 (1)
VTrende Pro - MTF indicator for trend trading with a display panel for MT5 *** Videos can be translated into any language using subtitles (video language - Russian) Although the signals of the VTrende Pro indicator can be used as signals of a full-fledged trading system, it is recommended to use them in conjunction with the Bill Williams TS. VTrende Pro is an extended version of the VTrende indicator. Difference between Pro version and VTrende: - Time zones - Signal V - signal 1-2 waves
"Piranha" - an autonomous trading system that determines overbought and oversold levels on the chart. Red and blue zones represent overbought and oversold levels respectively. Entry points are marked with arrows: a downward arrow in the red zone for "sell" and an upward arrow in the blue zone for "buy". The Take profit level is indicated by the green moving average. Key features: Adjusting the Take profit level as the green moving average changes position. Averaging ability when a new market e
Big Player Range
Thalles Nascimento De Carvalho
5 (2)
「BigPlayerRange」インジケーターへようこそ。これは金融機関が市場で示す重要なエリアを特定するために開発されたテクニカル分析ツールです。このインジケーターは、主要な市場参加者が相当な活動と興味を示す価格範囲を正確に分析します。 主な特徴: 1. 金融機関の関心エリアのマッピング:「BigPlayerRange」は金融機関が強い活動を示すチャート上のエリアを正確に強調表示します。これらのポイントは戦略的に重要であり、市場の将来の動きについての洞察を提供します。 2. 出口の基準としてのプロジェクション:関心のあるエリアを特定するだけでなく、このインジケーターはプロジェクションを使用して可能な出口の基準としています。これらのプロジェクションは市場が将来どの方向に動くかに基づいて戦略を計画するのに役立ちます。 3. 識別された範囲に戻るときの引き戻しの確率:「BigPlayerRange」のユニークな機能の1つは、価格が関心のある範囲に戻ったときの引き戻しの確率を計算できることです。これは潜在的なトレンドの反転を評価するのに役立ちます。 「BigPl
これはほぼ間違いなく、MetaTraderプラットフォームで見つけることができる最も完全な調和価格形成自動認識インジケーターです。 19種類のパターンを検出し、フィボナッチプロジェクションをあなたと同じように真剣に受け止め、潜在的逆転ゾーン(PRZ)を表示し、適切なストップロスとテイクプロフィットレベルを見つけます。 [ インストールガイド | 更新ガイド | トラブルシューティング | よくある質問 | すべての製品 ] 19の異なる調和価格形成を検出します プライマリ、派生および補完フィボナッチ投影(PRZ)をプロットします 過去の価格行動を評価し、過去のすべてのパターンを表示します この指標は、独自の品質とパフォーマンスを分析します 適切なストップロスとテイクプロフィットのレベルを表示します ブレイクアウトを使用して適切な取引を通知します すべてのパターン比をグラフにプロットします 電子メール/音声/視覚アラートを実装します スコット・M・カーニーの本に着想を得て、この指標は最も純粋で急を要するトレーダーのニーズを満たすように設計されています。ただし、トレードを
SMCpro MT5  Original Price  $440   ---  Currently Price  40% OFF  ( for unlimited use ) Hello World! Introducing.. SMCpro tool and Indicator for  MetaTrader 5 , a cutting-edge feature designed to revolutionize your trading experience. With innovative ICT Smart Money Concept, you gain unparalleled insight into market dynamics, empowering you to make informed trading decisions like never before. Built on the foundation of advanced algorithms and real-time data analysis, SMCpro tool and Indicat
発見が困難で頻度が少ないため、分岐は最も信頼できる取引シナリオの1つです。このインジケーターは、お気に入りのオシレーターを使用して、通常の隠れた分岐点を自動的に見つけてスキャンします。 [ インストールガイド | 更新ガイド | トラブルシューティング | よくある質問 | すべての製品 ] 取引が簡単 通常の隠れた発散を見つけます 多くのよく知られている発振器をサポート ブレイクアウトに基づいて取引シグナルを実装します 適切なストップロスおよび利益レベルを表示します 設定可能なオシレーターパラメーター カスタマイズ可能な色とサイズ バー単位でサイズ別に分岐をフィルタリング パフォーマンス統計を実装します 電子メール/音声/視覚アラートを実装します 幅広い市場の見通しを提供するために、異なるオシレーターを使用して、干渉なしで同じチャートにインジケーターを何度もロードできます。このインジケーターは、次のオシレーターをサポートしています。 RSI CCI MACD オスマ 確率的 勢い 素晴らしい発振器 加速器発振器 ウィリアムズパーセントレンジ 相対活力指数 特に外国為替市
Multi-currency, multi-timeframe, harmonic pattern indicator AB = CD. Supports sending push notifications about signals to a mobile device, messages on e-mail, as well as messages using alerts on all available currency pairs and timeframes. This indicator was based on the indicator Harmonic ABCD Universal. Version for MetaTrader 5:  https://www.mql5.com/en/market/product/44972 . See also: Harmonic ABCD Universal for MetaTrader 4 . Using modern software development methods has made the indicator a
Introduction to X3 Chart Pattern Scanner X3 Cherart Pattern Scanner is the non-repainting and non-lagging indicator detecting X3 chart patterns including Harmonic pattern, Elliott Wave pattern, X3 patterns, and Japanese Candlestick patterns. Historical patterns match with signal patterns. Hence, you can readily develop the solid trading strategy in your chart. More importantly, this superb pattern scanner can detect the optimal pattern of its kind. In addition, you can switch on and off individu
The indicator is designed to close positions on the market in time. For example: to take profits ahead of schedule if the price has not reached TakeProfit, and the market is turning around. The indicator analyzes the momentum, not the trend. He does not give any information about the trend. The indicator is well suited for finding divergence. The Ershov 38 Parrots indicator dynamically adjusts to the market and detects price movement impulses of medium and high amplitude. It almost does not rea
この指標は、W.D。Gannが書いた「市場予測の数式」​​の記事に基づく市場分析手法であり、9の2乗と144の2乗に依存しています。 ユーザーマニュアル: Add Your review And contact us to get it MT4のフルバージョンは次の場所から購入できます。 https://www.mql5.com/en/market/product/15316 あなたは無料でMT4でテストすることができます: https://www.mql5.com/en/market/product/15320?source=Site +Profile+Seller#!tab=reviews この製品は、レベル/スター/グリッド/ガンファン/として9の正方形を描くことができます。 ガンスクエアも描画します:52/90/144。 チャート上で直接移動可能なフリーガンスターを描画します。 また、ガンダイヤモンドを描画します。 それはあなたがあなたのエントリーのために最高のロットを計算することができるようにするロット計算機を
トレンドトレーディング は、タイミングのプルバックとブレイクアウトにより、市場で起こっているトレンドから可能な限り利益を得るように設計された指標です。確立されたトレンドの中で価格が何をしているかを分析することにより、取引の機会を見つけます。 [ インストールガイド | 更新ガイド | トラブルシューティング | よくある質問 | すべての製品 ] 自信を持って効率的に金融市場を取引する むち打ちにならずに確立されたトレンドから利益を得る 収益性の高いプルバック、ブレイクアウト、早期の逆転を認識する この指標は、独自の品質とパフォーマンスを分析します 複数時間枠のダッシュボードを実装します インジケーターは再描画されていません 電子メール/音声/視覚アラートを実装します 確立されたトレンドは多くの取引機会を提供しますが、ほとんどのトレンド指標はそれらを完全に無視しています。インジケーターの解釈はかなり簡単です: (1) トレンドの変化 (2) トレンドの方向への後退 (3) トレンドの方向へのブレイクアウト 赤いダッシュ は下降トレンド中の修正です 青いダッシュ は上昇ト
このインディケータは、価格アクション分析とドンチャンチャネルのみを使用して、ジグザグ方式で価格の反転を検出します。再描画やバックペインティングを一切行わずに、短期取引向けに特別に設計されています。それは彼らの操作のタイミングを増やすことを目指している賢明なトレーダーにとって素晴らしいツールです。 [ インストールガイド | 更新ガイド | トラブルシューティング | よくある質問 | すべての製品 ] 驚くほど簡単に取引できます すべての時間枠で価値を提供します 自己分析統計を実装します 電子メール/音声/視覚アラートを実装します 可変長のブレイクアウトと混雑ゾーンに基づいて、インディケータは価格アクションのみを使用して取引を選択し、市場が非常に高速に行っていることに反応します。 過去のシグナルの潜在的な利益が表示されます この指標は、独自の品質とパフォーマンスを分析します 負けブレイクアウトは強調表示され、説明されます インジケータは、非バックペインティングおよび非再ペイントです この指標は、日中のトレーダーが単一の価格反転を見逃さないようにするのに役立ちます。ただし、す
Elliott Wave Trend was designed for the scientific wave counting. This tool focuses to get rid of the vagueness of the classic Elliott Wave Counting using the guideline from the template and pattern approach. In doing so, firstly Elliott Wave Trend offers the template for your wave counting. Secondly, it offers Wave Structural Score to assist to identify accurate wave formation. It offers both impulse wave Structural Score and corrective wave Structure Score. Structural Score is the rating to sh
Good day! I present to you a trading technical indicator for Deriv broker synthetic indices. This indicator ONLY works with the following indices: Boom 300 Index Boom 500 Index Boom 1000 Index Crash 300 Index Crash 500 Index Crash 1000 Index The indicator was created to give signals to open medium-term trades in the direction of Spikes. But you can open trades in the opposite direction to Spikes, at your own risk. Trade only on M1. Other TFs do not guarantee the correct operation of the indic
Tatino Super Signals is Non Repaint Indicator for Binary Option trading and Forex trading. Recommendations: Timeframe: All timeframes. For best results we recommend using it on M1, M5 and M15 timeframes. Currency pairs: All Pairs Account type: All Type Broker time: Any Brokers : Alls Binary Trading : Expired 1 Candle Buffer Buy=1, Sell=0, Entry Next Candle Recommended Forex trading stop loss : 15 pips Recommended  Forex tradingTake profit levels : 15 pips Specifications: Does not repaint  
The Smooth Price technical indicator is used for plotting a smoothed line as close to the price of the financial instrument as possible, and serves to eliminate its noise components. The indicator is part of the Monarch trading system, but here it is presented as an independent technical analysis tool. The indicator is based on the cluster digital filter , which, unlike the ClusterSMA , is applied directly to the price time series. Smooth Price does not redraw (except the very last, zero bar) an
バイナリ オプションの可能なコールおよびプット エントリを生成する人工知能に基づくインジケーター。 このインジケーターは 3 つの異なる戦略で機能します。 1) 出来高を読み取ることで、価格が反転する時期にシグナルを送信します。 2) 価格と出来高の乖離を通じて、トレンドが継続するか反転するかを知らせます。 3) 価格と出来高の収束を通じて、トレンドが継続すべき時期にシグナルを送信します。 この指標はすべての時間枠で機能しますが、最良の結果は 3 分または 5 分の期限で得られます (制度的な攻撃は短い時間枠で見られるため)。 最も流動性の高い時間帯、つまりグリニッジ標準時 7 時からグリニッジ標準時 18 時までが最適です。 このインジケーターは正しいシグナルの 70% 以上を生成しますが、価格を操作する機関同士の争いに遭遇したり、相互に拒否したりして、一連の誤ったシグナルが生成される可能性があります。そのため、適切な資金管理を使用することをお勧めします (Masaniello の例) )
How to use Pair Trading Station Pair Trading Station is recommended for H1 time frame and you can use it for any currency pairs. To generate buy and sell signal, follow few steps below to apply Pair Trading Station to your MetaTrader terminal. When you load Pair Trading Station on your chart, Pair Trading station will assess available historical data in your MetaTrader platforms for each currency pair. On your chart, the amount of historical data available will be displayed for each currency pai
回帰取引を意味する専門的かつ定量的なアプローチを実装する独自の指標。これは、価格が予測可能かつ測定可能な方法で迂回して平均に戻るという事実を利用しており、非定量的な取引戦略を大幅に上回る明確な出入りルールを可能にします。 [ Installation Guide | Update Guide | Troubleshooting | FAQ | All Products ] 明確な取引シグナル 驚くほど簡単に取引できます カスタマイズ可能な色とサイズ パフォーマンス統計を実装します ほとんどの取引戦略を上回ります 適切なSLおよびTPレベルを表示します 電子メール/音声/視覚アラートを実装します 使い方 インディケータは、より高い時間枠からの完全にカスタマイズ可能な移動平均の周りの標準偏差を測定し、トレンドフォローアプローチを使用して正確に取引を見つけます。取引は、現在のチャートの価格アクションに飛び込むことによって見つけられ、価格が選択したより高い時間枠から計算された平均価格帯に戻ったときに閉じられます。それがコード化される方法のために、指標は高ボラティリティと強いトレンドの
This is the famous Sunflower indicator for Metatrader5. This indicator marks possible tops and bottoms on price charts. The indicator identifies tops and bottoms in the asset's price history, keep in mind that the current sunflower of the last candle repaints, as it is not possible to identify a top until the market reverses and it is also not possible to identify a bottom without the market stop falling and start rising. If you are looking for a professional programmer for Metatrader5, please
Teniendo una entrada de precios suavizados, los cuales son procesador por un ZigZag en tiempo real, dando como resultado un suavizador ajustado a un ZigZag. Con valores de entrada (periodo) mayores se vuelve un poco lenta en M1,, Ideal para H1, H4, D1 Trabaja bien con otros suavizadores, ya que su intersección es ideal Al iniciar empiza con mayor precisión desde el momento de activación, siendo el historial (anterior) de referencia ----------------------------------------------------------------
Super Suavizador
Cesar Juan Flores Navarro
Indicador en MQL5 que obtiene el promedio de 10 EMAS que son alineadas y procesadas según Fibonacci luego el promedio es suavizado"  Se ingresa un número de 2 a N que multiplica los EMA-Fibonacci y por consiguiente aumenta los fibonacci, resultando un promedio.   Se ingresa un número que suaviza los EMA-Fibonacci. Considerando los números 1/1 seria la suavización minima. Considerando los números 3/5 seria la suavización media. Considerando los números 10/30 seria la suavización alta.....etc
作者のその他のプロダクト
このライブラリを使用すると、任意の EA を使用して取引を管理でき、説明に記載されているスクリプト コードを使用して任意の EA に簡単に統合でき、完全なプロセスを示すビデオのデモ例も利用できます。 - 指値注文、SL 指値注文、利食い指値注文の発行 - マーケット、SLマーケット、TPマーケットの注文を行う - 指値注文の変更 - 注文をキャンセルする - 注文のクエリ - レバレッジ、マージンの変更 - 位置情報の取得 もっと... MT5 に Binance チャートがない場合を除き、暗号チャートのレンタルはオプションです。 スクリプトのデモについては、 ここをクリックしてください トレーディングパネルでの取引をご希望の場合は、 この製品に興味があるかもしれません
このライブラリを使用すると、任意の EA を使用して取引を管理でき、説明に記載されているスクリプト コードを使用して任意の EA に簡単に統合でき、完全なプロセスを示すビデオのデモ例も利用できます。 本製品はAPI経由で取引操作が可能であり、チャートは含まれておりません。 ユーザーは、暗号チャートを提供するブローカーのチャートを使用し、Binance に注文を送信できます。 - 一方向モードとヘッジモードをサポート - 指値注文、SL 指値注文、利食い指値注文の発行 - マーケット、SLマーケット、TPマーケットの注文を行う - 指値注文の変更 - 注文をキャンセルする - 注文のクエリ - レバレッジ、マージンの変更 - 位置情報の取得 もっと... スクリプトのドキュメント Binance に注文を送信する MQL5 で簡単な EA をコーディングする初心者向けの 1 時間のプログラミング チュートリアル https://www.youtube.com/watch?v=d_r4j2V77mY
MT5の仮想通貨チャート。 特徴 : 1. Websocket (wss) 経由のライブ OHLC チャート 2.APIからのバーの更新履歴 3. MT5が再起動されるとチャートの履歴が自動更新され、バーに欠落データがないことを確認し、ネイティブチャートと同様に常に最新の状態に保たれます。 4. API からのスケジュールされた履歴更新: ミリ秒間のインターネット切断がある場合、WebSocket はストリーミング プロトコルであるため、bar ohlc 値が正しくない可能性があります。 この 1 ~ 2% のエラーの可能性を減らすために、API からスケジュールされた履歴更新機能を追加しました。この機能は、ユーティリティ設定から設定できる数分ごとにデータを更新し続けます。 OHLC 値が常に正しいことを確認し、分析エラーをなくします。 5. ユーティリティは、M1 から MN1 までのすべてのタイムフレーム サポートをサポートします。 6. 利用可能なデータ: 始値高値安値終値実ボリュームとティックボリューム 7. 暗号データのストラテ
This indicator finds Double Top and Double bottom Example : What is Double Top When price establishes a new high and then falls, then reverse to the same candle area of High then its considered a valid double top and vice versa for double bottom. 1. It plots and high and low on visible chart if ChartChange is set to true else it searches on new bar opening 2. If there is double top and double bottom found in visible chart window then it plots a line 3. It has options to customize text color, te
FREE
マルチ通貨の前のキャンドルまたは前のバースキャナーは、インジケーター設定から選択したカスタム時間枠でマルチシンボルチャートをスキャンするのに役立ちます。 製品に基づく: https://www.mql5.com/en/market/product/110229 前日の高値安値、前週の高値安値、前月の高値安値、または任意のカスタム時間枠の複数のシンボルをスキャンするために使用できます。 過去4時間チャートの高値安値 ノイズをフィルターし、価格が高値ラインまたは安値ラインに接触したときに方向性のある警告を発します。 戦略はシンプルで、前日、週または月の高値安値に触れると、価格が5分などの短い時間枠で拒否されると見なされます。 さまざまなアラートの種類を選択するオプションがあります スキャン頻度をミリ秒単位で選択および設定できます 1000 は、相場監視のすべてのシンボルを毎秒スキャンすることを意味します 製品の特徴 1. ターミナルアラート 2.電子メールアラート 3. プッシュ通知
パーフェクトセコンドチャートインジケーターを使用すると、分のローソク足を秒に変換できます 1. バーを正確な時間で 100% 閉じるために任意の秒数を選択します。 2. これはレートベースのデータです。ティックが利用できない場合でも機能します。 3. 外部 DLL は不要で、VPS 上でスムーズに動作します 4. 高速で最適化されたコード 5. BInance、Kucoin、先物チャートを簡単に秒単位に変換できるその他すべての取引所などの暗号ペアをサポートします。 6. ゴールドや外国為替ペアなど、あらゆるタイプのシンボルをサポートします。 7. シンボルとレートを削除するオプション。 パーフェクトセコンドチャートインジケーターを使用すると、分のローソク足を秒に変換できます 1. バーを正確な時間で 100% 閉じるために任意の秒数を選択します。 2. これはレートベースのデータです。ティックが利用できない場合でも機能します。 3. 外部 DLL は不要で、VPS 上でスムーズに動作します 4. 高速で最適化されたコード
Real Spinning Top Indicator It detects accurate spinning top on chart with balanced body and wick height ratio which is the true meaning of spinning top which differs it from Hammers and Doji or Null Candlestick. This indicator plots an wingdings icon at number of spinning tops found on the chart. Settings include Number of Bars : To adjust search on number of bars Color of Icon :change color of icon Icon code : change code of wingdings for icon
FREE
EA の暗号通貨ライブティックデータの買値と売値および予約の深さ 利用可能な交換所: 1. Binance Spot (アクティブなチャートウィンドウで注文帳深度をサポート) および先物 (複数の注文帳深度をサポート) 2. Kucoin スポットと先物、アクティブなチャート ウィンドウでオーダーブックの深さをサポート 3. Bybit 先物およびインバース先物ティック データ ビッド アスク 最後 今後の取引所: OKX、MEXC など。 特徴 : 1. 買い値と売り値情報を含むライブティックデータ 2. 最高入札額と注文数量、ユーザーは設定から深さを有効/無効にできます 3. 履歴のロード: 始値高値安値終値値とティック値データを更新します 4. 履歴の自動更新:MT5ターミナルを再起動すると不足しているバーを埋める 5. 暗号データのストラテジーテスターを使用して、暗号シンボルティックのエキスパートアドバイザーであらゆる戦略をバックテストできます 6. このユーティリティは外部 DLL ファイルをロードする必
このインジケーターをチャートに追加し、ZigZagのExtDepth設定を設定します 価格がトレンドラインのアッパー、ロワー、またはミドルチャネルに触れると即座にアラートを出します 特徴 : -上、下、または中線のアラートを有効/無効にします -アラートの後に一時停止を数秒で追加 -チャート上のボタンでトレンドチャネルを一時停止または一時停止解除 -入力フィールドにポイントを追加して早期アラートを追加します。たとえば、ETH価格は2900.25で、ここでは25桁が「ポイント」です。したがって、入力フィールドに25をポイントで追加し、トレンドチャネルの下線の値が2900.25の場合、次のようになります。 2900.50に早期アラートを受け取ります(設定から25ポイントを追加) -方向性タッチを有効/無効にします。詳細についてはスクリーンショットを参照してください。価格が下からの抵抗と上からのサポートに触れる場合、方向性タッチが考慮されます。この機能は、複数のアラートからのノイズを回避するために追加されます 1分から5分のチャートで下取りする場合、Extdepthへの推奨
MT5用バイナンス取引ツール 1. この製品には、WebSocket からのライブ チャート、履歴チャート、 mt5ターミナルの再起動時に自動更新され、手動介入なしでスムーズに動作し、バイナンスをスムーズに取引できるようになります。 スポットと先物で利用可能な取引、ライブチャート、履歴データ 使い方 : 1. このユーティリティの入力フィールドに API キーとシークレットを追加する必要があります。 API を作成するときは、必ず先物取引を有効にしてください。 3. [ツール] > [オプション] > [URL からの Web リクエストを許可] タブで説明されているように Binance API URL を追加し、Web リクエストを許可するチェックボックスにチェックを入れる必要があります。 バイナンススポット URL 1: api.binance.com URL 2: stream.binance.com バイナンス先物 URL 1: fapi.binance.com URL 2: fstream.binance.com これら
チャートの任意の場所でマルチシンボルをダブルクリックして、価格アラートを設定し、ターミナルアラートまたはプッシュ通知から通知を受け取ります 1. EA ユーティリティをチャートに追加する 2. <- 左または -> 右矢印キーでチャートをブラウズ 3. チャートの任意の場所をダブルクリックすると、線が追加されます。この線をドラッグして希望の価格を設定すると、アラートが設定されます! 価格がラインに到達すると、ユーティリティの設定に従って端末またはプッシュ通知で通知されます。 ターミナルを再起動しても、このアラートは機能し続けます。 4. マルチシンボルを閲覧し続け、アラートで通知したい多くのチャートに線を追加し続けます. 5. 最初からやり直したい場合は、D を押して、設定したすべてのアラートを削除します。 6. 水平線を削除すると、アラートが無効になります。
このインジケーターは、トレーダーの要件に従ってチャートをよりクリーンにするために有効/無効にできる最大6つのレベルをプロットします これらの6つのレベルは2つのセットにあります:高と低 セットごとに、異なる時間枠を選択できます 価格が日次、週次、または月次の高値に達すると、通常5分などの短い時間枠で価格が拒否されると考えられるため、これは以前の高値と安値の反転の戦略に基づいています。 特徴 : -単一のチャートで最大6つの時間枠の高値と安値を追跡します -これらのレベルにアラートを設定します。メール、プッシュ、またはターミナルアラート。価格がこれらのレベルに達すると、即座にアラートが送信されます。 -線のスタイル、幅、色など、レベルのスタイルをカスタマイズします -シフト:2日目または3日目の高低を追跡または調査したいですか?シフトは、2番目のバーの高低の場合は2に、3番目のバーの高低の場合は3に設定できます。
Crypto.comからMT5へ Crypto.comWebSocketからMetatrader5へのライブローソク足ストリーム そのOHCLV(オープンハイロークローズリアルボリューム)ライブレートデータ  トレーダー、ミニッツチャートでOHLCデータが正しくない場合、テクニカルチャートスタディで誤った分析を行う可能性があります。この製品は、手動分析に役立つ正確なデータをリアルタイムで提供することを保証します あなたは私のプロフィールで私の他の暗号製品をチェックすることができます https://www.mql5.com/en/users/rajeshnait/seller 1.OHLCVデータ 2.複数のシンボルをサポートおよび作成します 3. [ツール]> [オプション]> [URL]タブからのWebリクエストを許可するで説明したように、 Crypto.com   WebSocketとAPIURLを追加する必要があります。また、[Webリクエストを許可する]チェックボックスをオンにします。 -WebSocket URL:stream.crypto
市場構造は、より高い時間枠でのブレイクアウトがトレーダーにトレンドをクリアするのに役立つ可能性があるものです. 1. このインディケータは最後の 2 つの構造 (ZigZag の前の高値と安値) のみに ZigZag を描画し、ZigZag の新しいバーは構造のブレークが発生したときにのみ形成されます。 2. 構造体の破壊時にターミナルとプッシュ通知を提供 3. [ と ] キーから ZigZag の Extdepth を増減して、スイングを調整します。 4. Line AB BC と CD の色を変える 5.多くのチャートに追加し、複数のシンボルでアラートを取得します Break of Structure Multi ExtDepth Breakout Multi Symbol Scanner を探している場合は、この製品を使用できます。 Multi Symbol Multi ExtDepth ZigZag Breakout Scanner
Cobra Pivot Points は、最適化されたピボット ポイントをプロットするためのインジケーターであり、デモをダウンロードすることで自分でバックテストできます。 1. 2 つの最適なピボット モードを選択します: Cobra ピボットまたは Camrilla ピボット 2. D1 に限定されず、任意の時間枠を使用できます。 3. Shiftパラメータを使用して、前日の高値安値終値を操作できます。 1 = 前のバー、2 = 前のバーなど。これらのパラメーターは、ピボットの研究開発に役立ちます。 4. レベルがタッチされると、アラート、電子メール、またはプッシュ通知が送信されます。 レベルに達すると、ピボット レベルは緩和されたとみなされ、再度警告されなくなります。 再度アラートが必要な場合は、時間枠を変更してアラートをリセットする必要があります。 5. 線の色、線のスタイル、線の幅、文字の色、フォントを完全にカスタマイズします。 コブラピボットは、LZone (スキャルピングに非常に近いレベル)、NZone (市場が統合しているとき)、H
ピボット ポイント マルチ シンボル スキャナーは、フロア、ウッディ、カマリラ、デマーク、またはフィボナッチ ピボット ポイントのマーケットウォッチで利用可能なすべてのシンボルをスキャンします。 任意の時間枠を選択してピボットポイントを計算し、価格がこれらのレベルのサポートとレジスタンスに達したときにアラートを受け取ることができます。 視覚的なピボット ポイントについて この製品に興味があるかもしれません: https://www.mql5.com/en/market/product/110231 さまざまなアラートの種類を選択するオプションがあります スキャン頻度をミリ秒単位で選択および設定できます 1000 は、相場監視のすべてのシンボルを毎秒スキャンすることを意味します 製品の特徴 1. ターミナルアラート 2.電子メールアラート 3. プッシュ通知
対称三角形、非対称三角形、直角三角形などの三角形パターン、立ち上がりウェッジや立ち下がりウェッジなどのウェッジパターン、拡張パターン、トレンドチャネルのパターンエクスプローラー このインジケーターは、現在のパターンだけでなく過去のパターンも調査します。トレンドラインまたは三角形を手動で描画して時間を節約しようとし、チャートに最適なパターンをプロットする自動分析にこれを使用したい場合に最適なインジケーターです。 特徴 : -最適なパターンを調整して見つけるためにZigZagextdepthを即座に変更するためのパネル -パターンをジグザグの前のバーに戻し、過去に何が起こったかを調査します。トレンドラインが尊重されているかどうかを調査し、価格アクションを理解します。 以前の履歴パターンを調査し、このインジケーターを使用してそれらを分析および学習することにより、マスター戦略を考え出します。 -[切り替え]ボタンから、トレンドチャネルまたはトレンドラインからウェッジモードまたはトライアングルモードに即座に切り替えます -パターンが変更されないようにパターンをフリー
このインジケーターは、トレーダーの要件に従ってチャートをよりクリーンにするために有効/無効にできる最大6つのレベルをプロットします これらの6つのレベルは2つのセットにあります:高と低 セットごとに、異なる時間枠を選択できます 価格が日次、週次、または月次の高値に達すると、通常5分などの短い時間枠で価格が拒否されると考えられるため、これは以前の高値と安値の反転の戦略に基づいています。 特徴 : -単一のチャートで最大6つの時間枠の高値と安値を追跡します -これらのレベルにアラートを設定します。メール、プッシュ、またはターミナルアラート。価格がこれらのレベルに達すると、即座にアラートが送信されます。 -線のスタイル、幅、色など、レベルのスタイルをカスタマイズします -シフト:2日目または3日目の高低を追跡または調査したいですか?シフトは、2番目のバーの高低の場合は2に、3番目のバーの高低の場合は3に設定できます。
KrakenCryptoExchange先物履歴更新パネル 特徴 : 1.シンボルのKrakenAPIから利用可能な設定および更新履歴に基づいてシンボルを完全に作成します。 このパネルは、Open High LowCloseデータを使用してKrakenFuturesシンボルの履歴を更新します。また、履歴の更新が完了するとメッセージを出力します。 これはライブデータではないことに注意してください。   3.[ツール]>[オプション]>[URL]タブからのWebリクエストを許可するで説明したようにKrakenAPIURLを追加し、[Webリクエストを許可する]チェックボックスをオンにする必要があります -API URL:futures.kraken.com 4.より少ないメモリとCPUを消費します 5.ターミナルの再起動時に欠落データを自動更新します! ターミナルを開くたびに、最新のデータが準備できます! 6.DLL呼び出しは行われません
5 EMA Scalping Strategy Multi Symbol Scanner This EA utility will scan all symbols which are selected in marketwatch and alert when such condition is formed in chart when Candle low is above EMA 5 for Sell alert and Candle high is lower from EMA5 so you can be ready before selling or buying for scalping purpose on 5min chart For more details watch attached video Logic : When a candle closes above 5 EMA in 5 mins chart, Wait for its low to break and Sell when low is broken by wick, Your SL sh
Multi Symbol ZigZag Breakout Scanner は、マーケットウォッチで選択されたすべてのシンボルをスキャンします。 価格がこれらのレベルに到達しようとしているときに、ダブル トップ、ダブル ボトム、または任意のフィボナッチ エクステンション レベルを簡単に見つけるのに役立ちます。 Timeframe と、Zigzag の複数の Extdepths (最大 3 つ) を選択できます。 推奨される ZigZag は 21、34、および 55 で、すべてのタイプの Zigzag とフィルター ノイズをカバーします。 端末アラートまたはプッシュ通知のいずれか、または両方を受信するように設定できます Multi Symbol ZigZag Breakout Scanner は、マーケットウォッチで選択されたすべてのシンボルをスキャンします。 価格がこれらのレベルに到達しようとしているときに、ダブル トップ、ダブル ボトム、または任意のフィボナッチ エクステンション レベルを簡単に見つけるのに役立ちます。 Timeframe と、Zig
Fibo Musang FMBCR CB1 ブレイクアウト スキャナー MT5 Fibo Musang CB1 または Candle Break 1 は、Gold XAUUSD およびその他の外国為替シンボルで非常にうまく機能する戦略です。 このスキャナーは、マルチシンボル通貨を非常に高速にスキャンし、FMCBR CB1 ブレイクアウトに関するアラートを取得するのに役立ちます トレーダーの好みに合わせて完全にカスタマイズできるので、詳細についてはビデオをご覧ください。 1. 時間枠とバーの履歴を選択できます 2. お好みの ZigZag 設定を変更できます: ExtDepth、ExtDeviation、ExtBackStep 3.ターミナルアラートまたはプッシュ通知を取得する 4. 1.618 2.618 または 4.236 のようなフィボナッチ エクステンションを追跡するオプション、または 1.00 で CB1 ブレイクアウトを追跡するオプション
チャートの任意の場所でマルチシンボルをダブルクリックして、価格アラートを設定し、ターミナルアラートまたはプッシュ通知から通知を受け取ります 1. EA ユーティリティをチャートに追加する 2. <- 左または -> 右矢印キーでチャートをブラウズ 3. チャートの任意の場所をダブルクリックすると、線が追加されます。この線をドラッグして希望の価格を設定すると、アラートが設定されます! 価格がラインに到達すると、ユーティリティの設定に従って端末またはプッシュ通知で通知されます。 ターミナルを再起動しても、このアラートは機能し続けます。 4. マルチシンボルを閲覧し続け、アラートで通知したい多くのチャートに線を追加し続けます. 5. 最初からやり直したい場合は、D を押して、設定したすべてのアラートを削除します。 6. 水平線を削除すると、アラートが無効になります。
Control Candle is the candlestick which holds multiple inside bars and are in control until its high low range is broken by close of any candlestick. When control candle is broken, price may act on these control candle as support and resistance. This indicator create rectangles on chart which will help you find control candles fast. Control candle indicator box is customizable by color, style, width and other options in indicator settings.
このインジケーターを使用すると、フィボナッチレベルのラベルを大きなフォントサイズで表示できます。 。 最大 25 のフィボナッチレベルをサポートします - フィボナッチを描画するとすぐに、入力パラメータとして追加したレベルが、選択した色とフォントの大きなフォント サイズで表示されます。 カスタマイズ可能なオプション: 1.フィボテキストフォント 2.フィボテキストサイズ 3.フィボテキストの色 3. 各レベルに説明を追加します 4. アンカーや度数などのその他のオプション このインジケーターを使用すると、フィボナッチレベルのラベルを大きなフォントサイズで表示できます。 。 最大 20 のフィボナッチレベルをサポートします - フィボナッチを描画するとすぐに、入力パラメータとして追加したレベルが、選択した色とフォントの大きなフォント サイズで表示されます。 カスタマイズ可能なオプション: 1.フィボテキストフォント 2.フィボテキストサイズ 3.フィボテキストの色 3. 各レベルに説明を追加しま
このインジケーターは、同じチャート上で追跡したい他の時間枠のローソク足を効率的に追跡します。 1. 同じチャートにバーをロードするには、より高い時間枠を選択します 2.ローソク足の色とスタイルをカスタマイズする 3. ローソク足を描画するバーの数を選択します 4. 芯と本体とともにより高いタイムフレームの完全なキャンドルを追跡する 5. チャートを切り替えたくない人にとっては簡単で便利です。 このインジケーターは、同じチャート上で追跡したい他の時間枠のローソク足を効率的に追跡します。 1. 同じチャートにバーをロードするには、より高い時間枠を選択します 2.ローソク足の色とスタイルをカスタマイズする 3. ローソク足を描画するバーの数を選択します 4. 芯と本体とともにより高いタイムフレームの完全なキャンドルを追跡する 5. チャートを切り替えたくない人にとっては簡単で便利です。
Cobra Pivot Points は、最適化されたピボット ポイントをプロットするためのインジケーターであり、デモをダウンロードすることで自分でバックテストできます。 1. 2 つの最適なピボット モードを選択します: Cobra ピボットまたは Camrilla ピボット 2. D1 に限定されず、任意の時間枠を使用できます。 3. Shiftパラメータを使用して、前日の高値安値終値を操作できます。 1 = 前のバー、2 = 前のバーなど。これらのパラメーターは、ピボットの研究開発に役立ちます。 4. レベルがタッチされると、アラート、電子メール、またはプッシュ通知が送信されます。 レベルに達すると、ピボット レベルは緩和されたとみなされ、再度警告されなくなります。 再度アラートが必要な場合は、時間枠を変更してアラートをリセットする必要があります。 5. 線の色、線のスタイル、線の幅、文字の色、フォントを完全にカスタマイズします。 コブラピボットは、LZone (スキャルピングに非常に近いレベル)、NZone (市場が統合しているとき)、H
マルチ通貨の前のキャンドルまたは前のバースキャナーは、インジケーター設定から選択したカスタム時間枠でマルチシンボルチャートをスキャンするのに役立ちます。 製品に基づく: https://www.mql5.com/en/market/product/78657 前日の高値安値、前週の高値安値、前月の高値安値、または任意のカスタム時間枠の複数のシンボルをスキャンするために使用できます。 過去4時間チャートの高値安値 ノイズをフィルターし、価格が高値ラインまたは安値ラインに接触したときに方向性のある警告を発します。 戦略はシンプルで、前日、週または月の高値安値に触れると、価格が5分などの短い時間枠で拒否されると見なされます。 さまざまなアラートの種類を選択するオプションがあります スキャン頻度をミリ秒単位で選択および設定できます 1000 は、相場監視のすべてのシンボルを毎秒スキャンすることを意味します 製品の特徴 1. ターミナルアラート 2.電子メールアラート 3. プッシュ通知
ピボット ポイント マルチ シンボル スキャナーは、フロア、ウッディ、カマリラ、デマーク、またはフィボナッチ ピボット ポイントのマーケットウォッチで利用可能なすべてのシンボルをスキャンします。 任意の時間枠を選択してピボットポイントを計算し、価格がこれらのレベルのサポートとレジスタンスに達したときにアラートを受け取ることができます。 視覚的なピボット ポイントについて この製品に興味があるかもしれません: https://www.mql5.com/en/market/product/110072 さまざまなアラートの種類を選択するオプションがあります スキャン頻度をミリ秒単位で選択および設定できます 1000 は、相場監視のすべてのシンボルを毎秒スキャンすることを意味します 製品の特徴 1. ターミナルアラート 2.電子メールアラート 3. プッシュ通知
フィルタ:
レビューなし
レビューに返信