Trend and Oscillators for MT5
- インディケータ
- Ren Xiang Wang
- バージョン: 1.30
- アップデート済み: 29 11月 2023
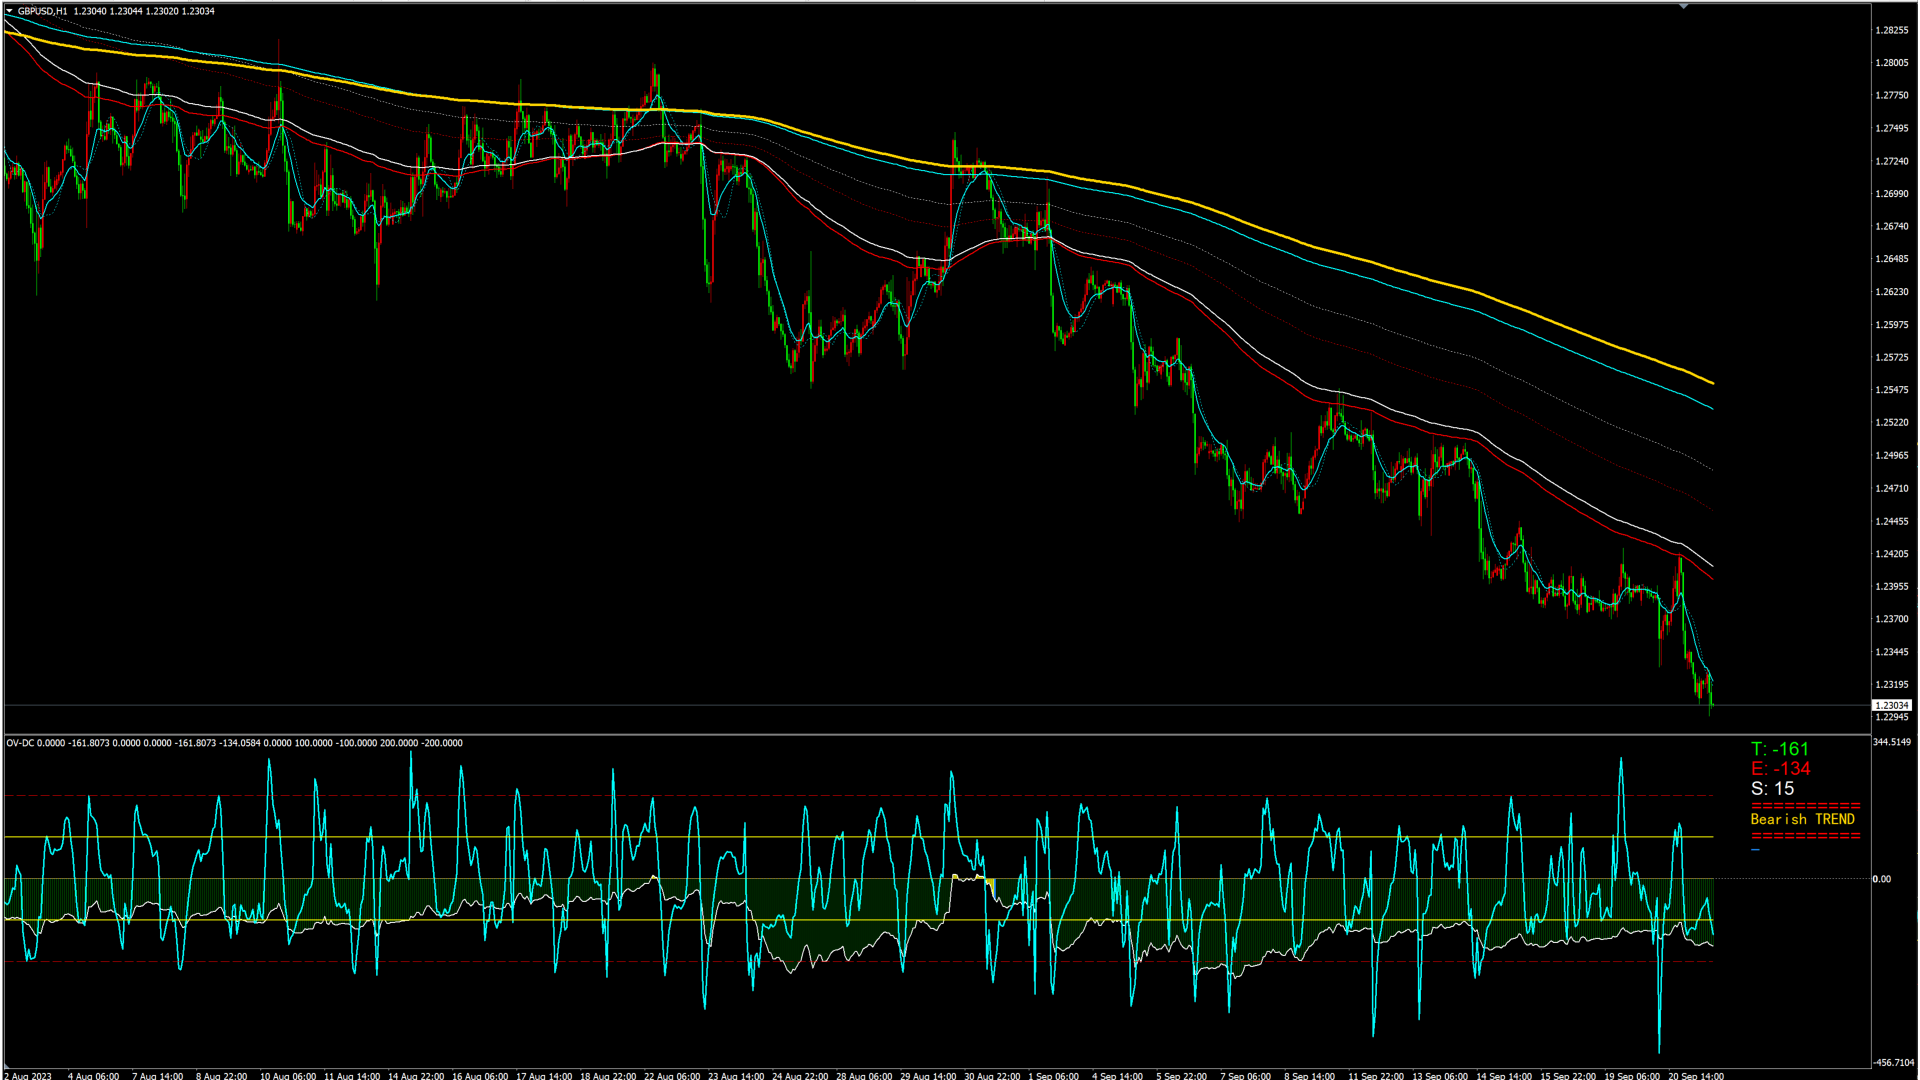
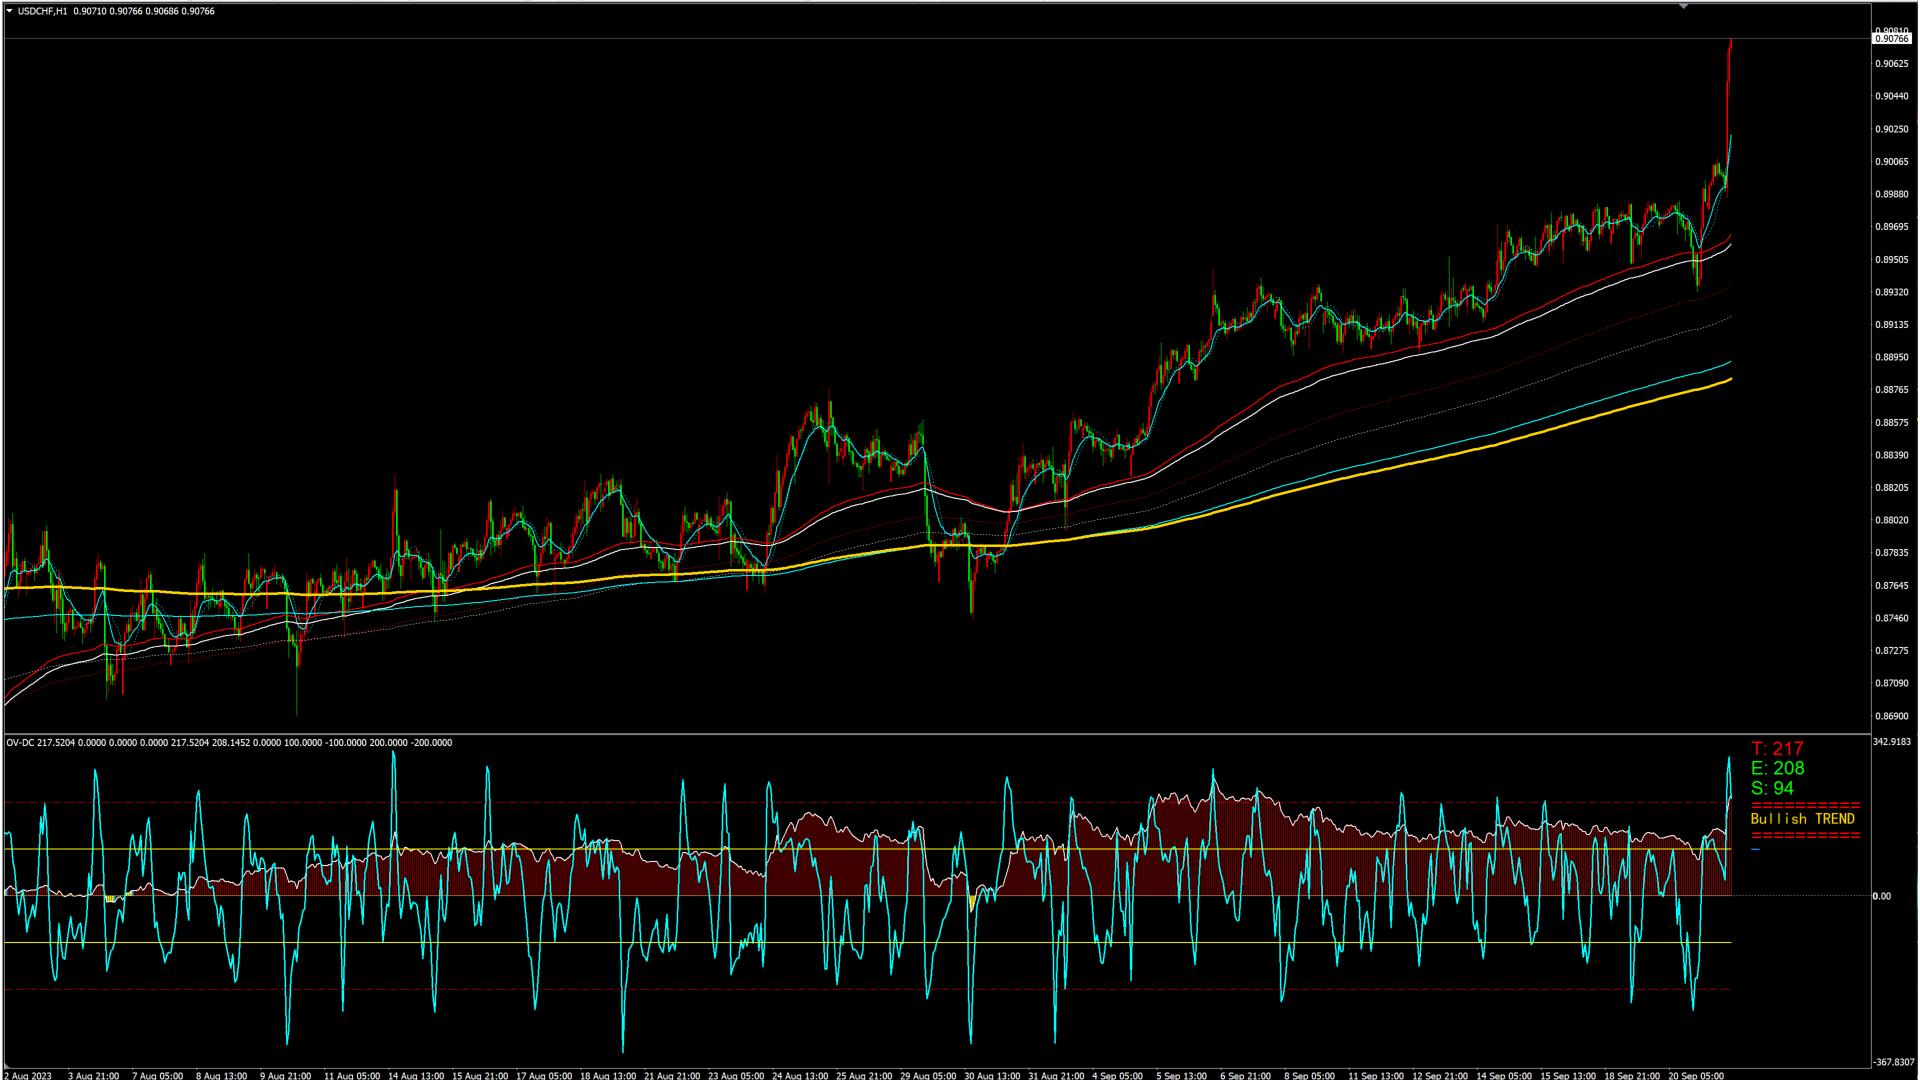
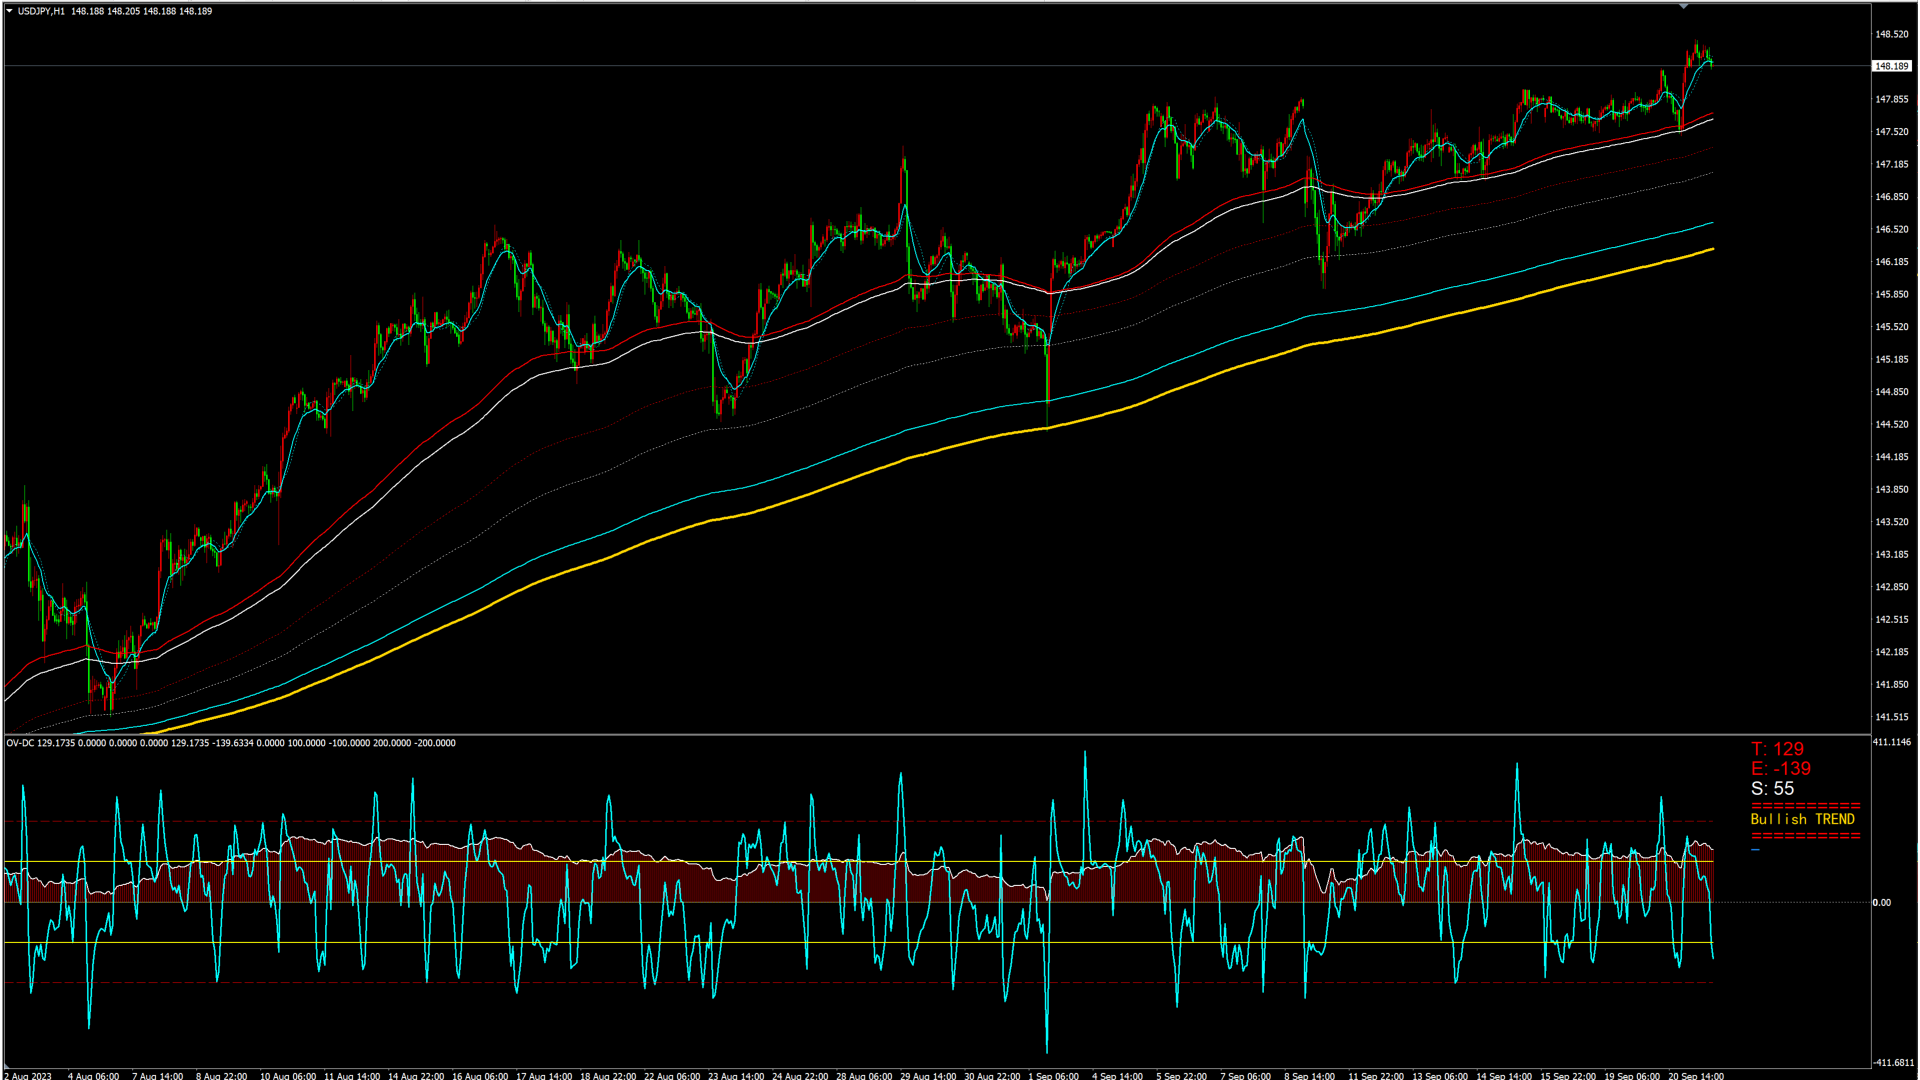
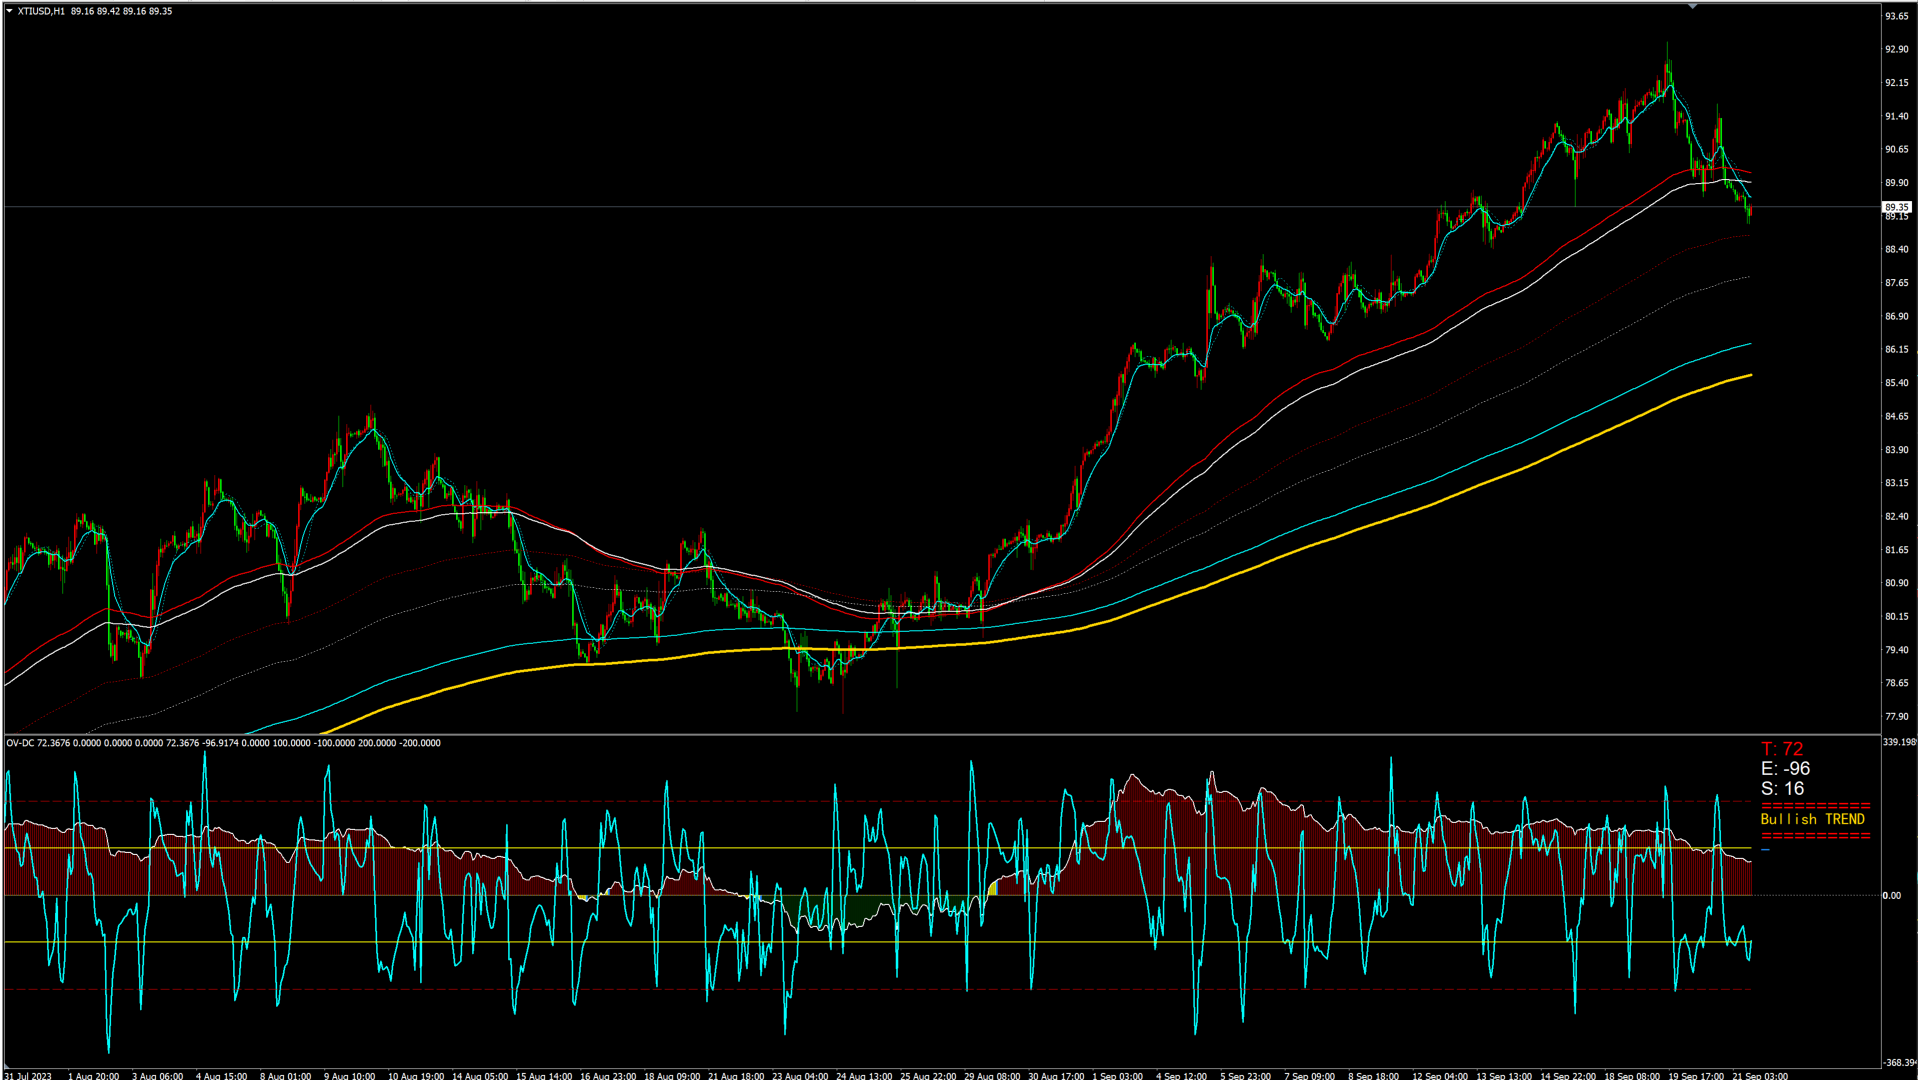
Based on the trend-following principle of CCI, it has been improved to become an indicator that can identify the reversal of the trend and its development direction, that is, it can identify the top and bottom attenuation of the oscillating trend in the trend market.
feature
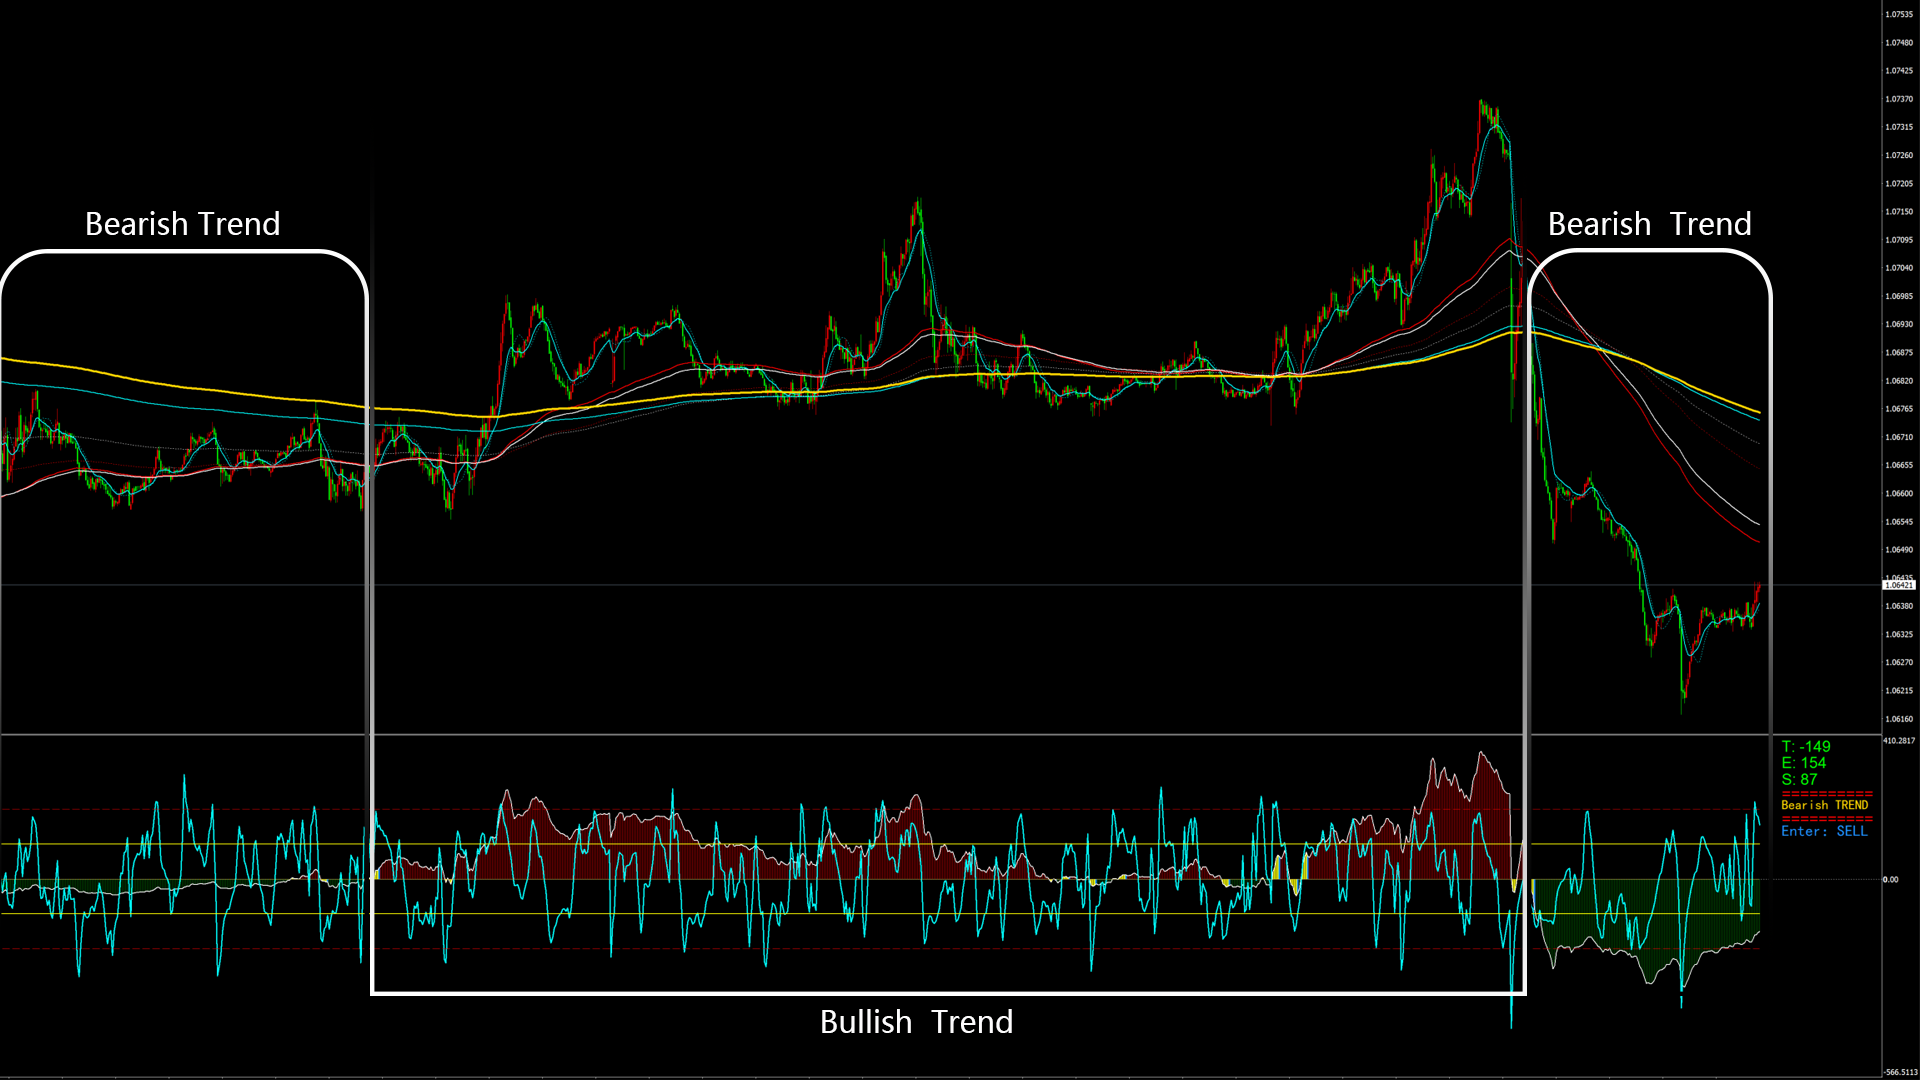
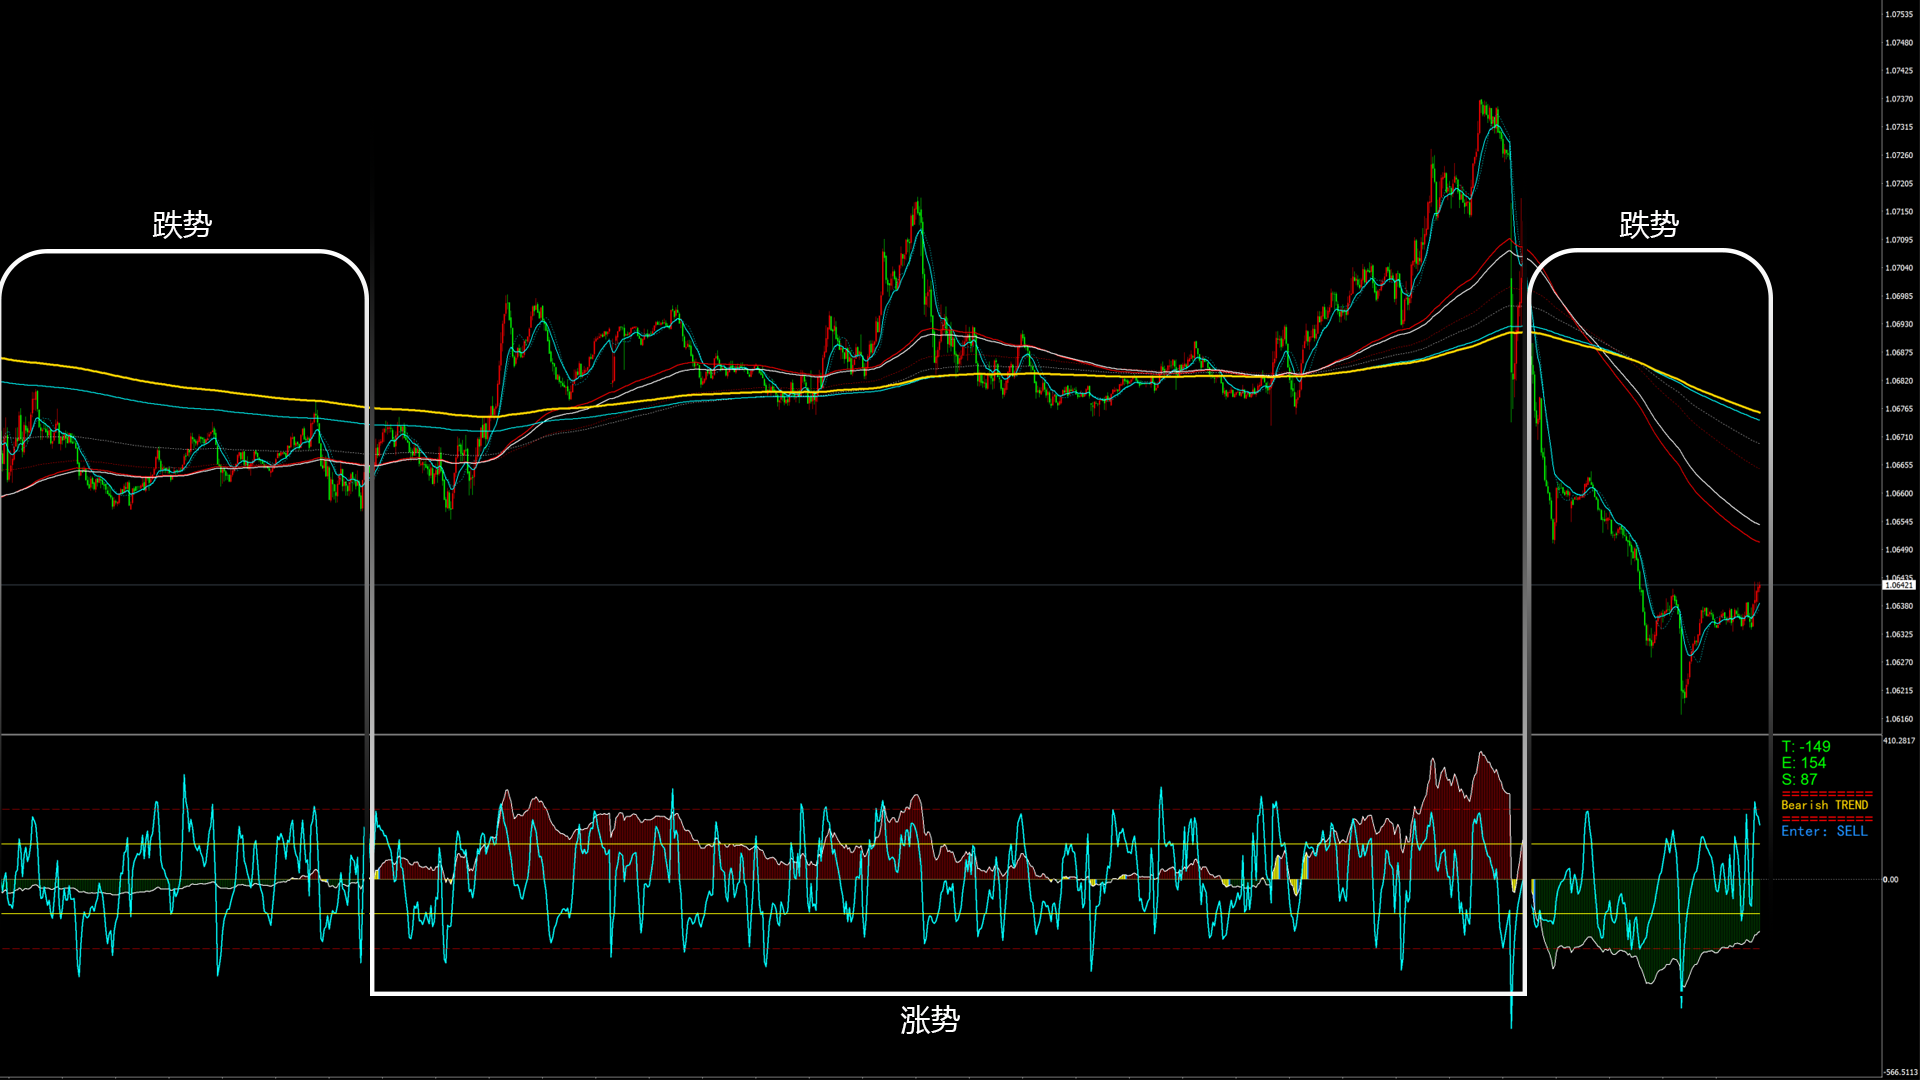
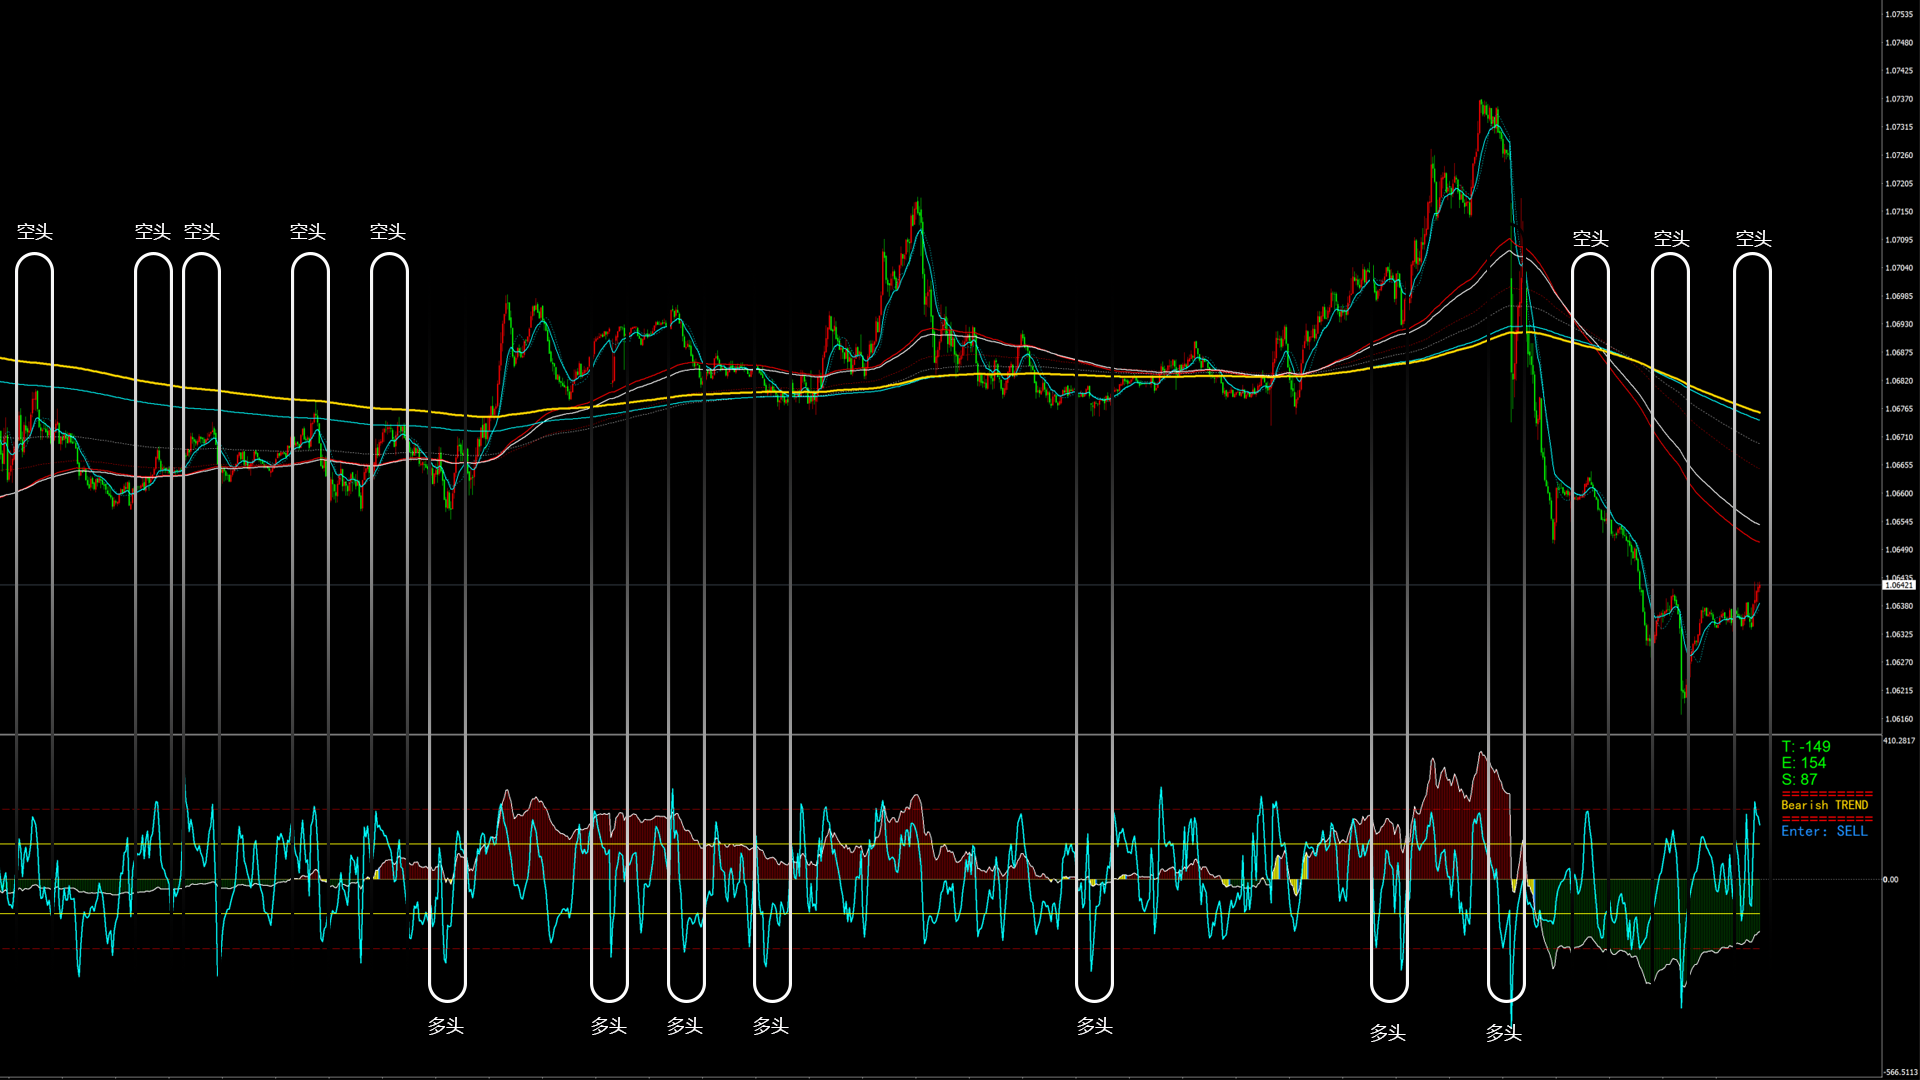
The red and green columns represent the trend of bullish or bearish development under the current cycle.
The blue line shows the position and attenuation of the current price trend in the current cycle.
The upper and lower rails of the red line segment represent the extreme trend of the price trend. When the blue line reaches the price above the red line segment, it is the extreme overbought attenuation area. When the blue line reaches the price and reaches below the red line segment, it is the extreme oversold attenuation area.
The upper and lower rails of the yellow solid line are the continued direction of the price trend. The blue line is higher than the yellow solid line, which is the continued long development, and the downward break is completed. The blue line is lower than the solid yellow line, indicating continued short development, and the upward break is completed.
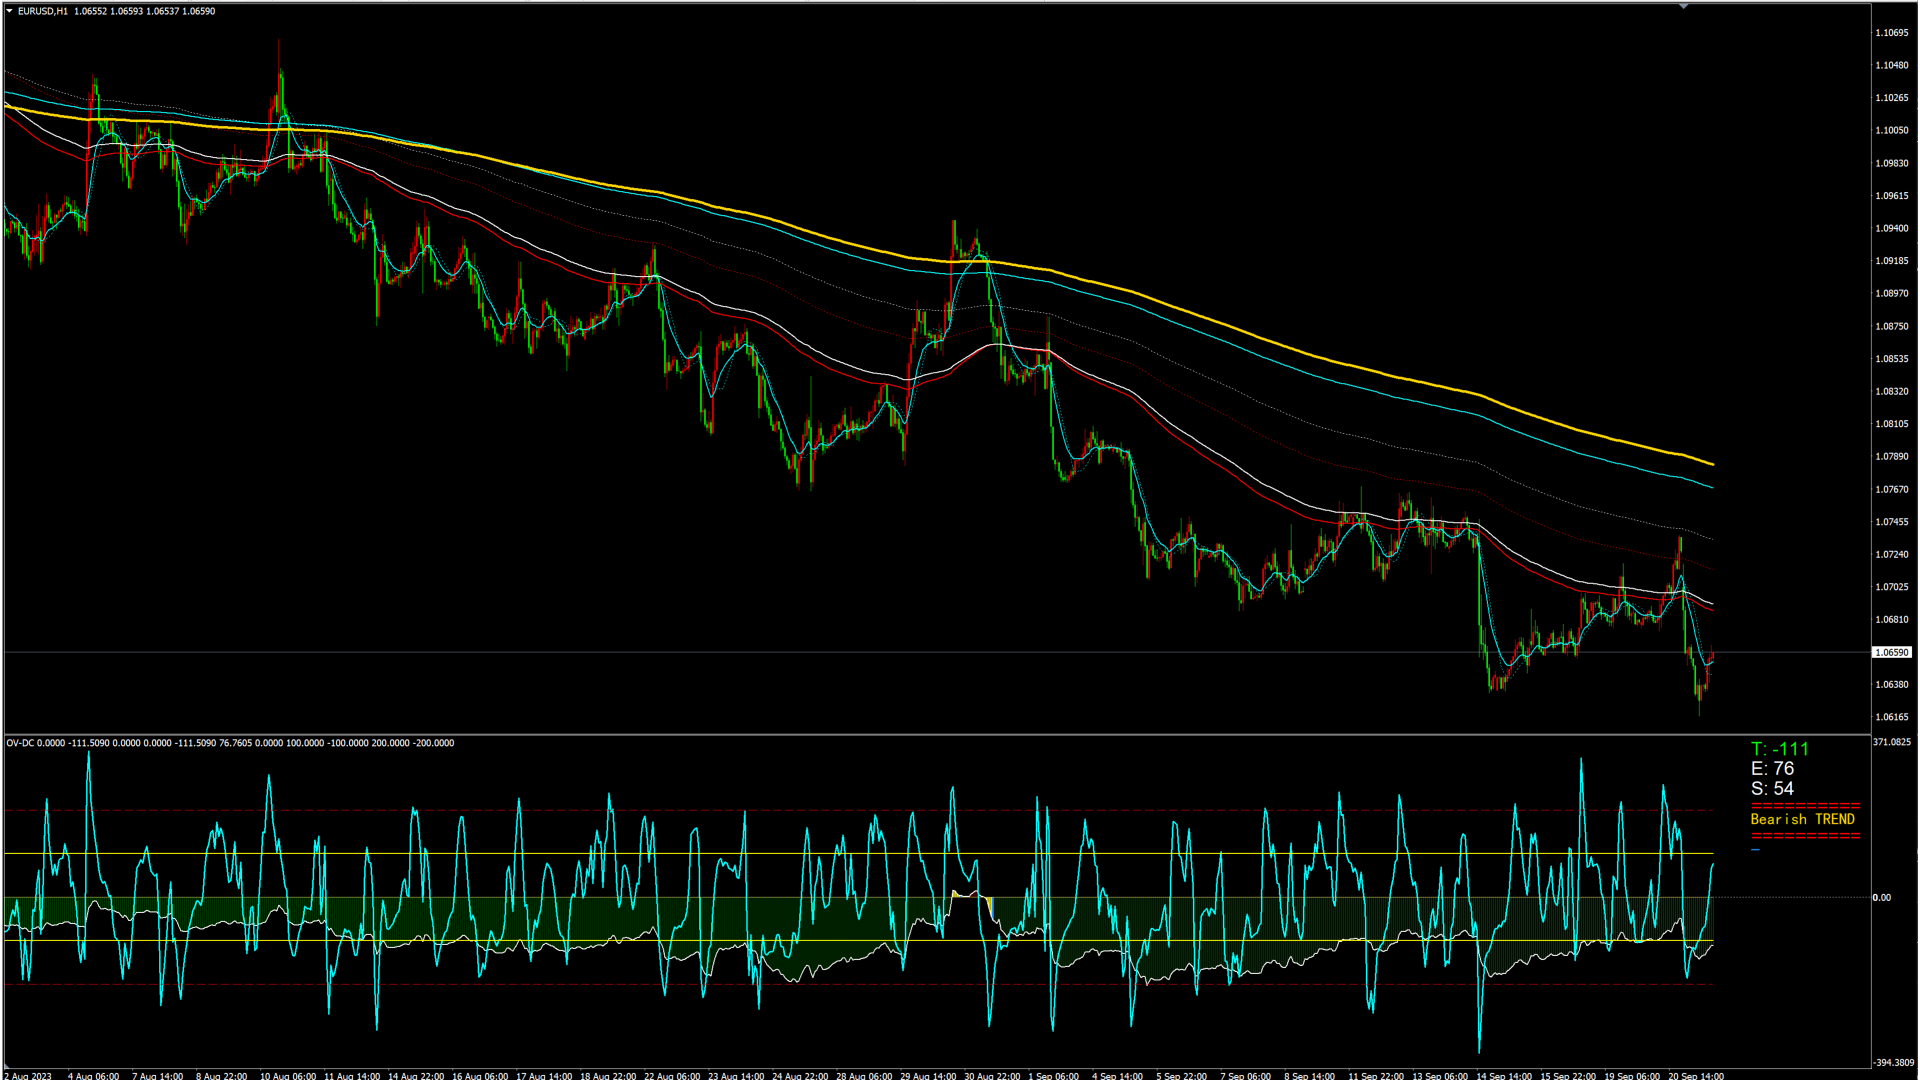
The right side of the board gives a digital reminder of the current movement, a reminder of whether the current trend is up or down, and a reminder of the area where entry is available.
use
Trend traders are recommended to use it in the 1H cycle;
For fast-forward and fast-out shock traders, it is recommended to use it under the 5M cycle;


great stuff thank you