• 概要
  • レビュー
  • コメント (2)
  • 最新情報

John Carters TTM Squeeze with MACD Multitimeframe

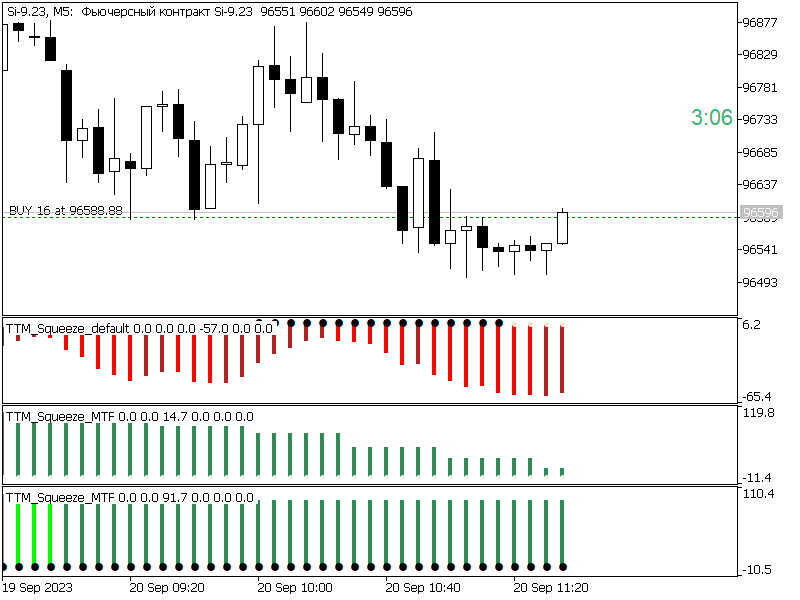
The same indicator as here https://www.mql5.com/ru/market/product/105089?source=Site+Market+My+Products+Page but with timeframe change possibility. It is convinient to see picture from different timeframes in the single chart.

When using multiple timeframes, it is recommended (A.Elder "The new trading for a living") to adhere to a coefficient of 5 or 6. That is, the two older timeframes for a 5-minute chart will be 30 minutes and 3 hours.

おすすめのプロダクト
This simple indicator paints with a darker color on the volume bar when the quantity traded is above the average of select number of periods of the volume itself, highlighting the moments when there was a large volume of deals above the average. It is also possible to use a configuration of four colors where the color tone shows a candle volume strength. The indicator defaults to the simple average of 20 periods, but it is possible to change to other types of averages and periods. If you like
FREE
MarketPro toolkit
Johannes Hermanus Cilliers
Start earning profits by copying All trades are sent by our successful Forex trader & are extremely profitable. You can earn profits by copying trades daily Trial Period included You'll also get access to extremely powerful trading education which is designed in a simple way for you to become a profitable trader, even if you have no trading experience. https://ec137gsj1wp5tp7dbjkdkxfr4x.hop.clickbank.net/?cbpage=vip
FREE
QuantumAlert Stoch Navigator is a free indicator available for MT4/MT5 platforms, its work is to provide "alerts" when the market is inside "overbought and oversold" regions in the form of "buy or sell" signals. This indicator comes with many customization options mentioned in the parameter section below, user can customise these parameters as needful. Join our   MQL5 group , where we share important news and updates. You are also welcome to join our private channel as well, contact me for the p
FREE
Donchian Pro
Paulo Henrique Faquineli Garcia
5 (2)
The Donchian Channel Channels are among the most popular tools of technical analysis, as they visually convey to the analyst the limits within which most price movement tends to occur. Channel users know that valuable information can be obtained at any time, whether prices are in the central region of a band or close to one of the border lines. One of the best known techniques to explore these concepts is Bollinger Bands. However, John Bollinger was not the only one to research the applicatio
FREE
Value Chart Candlesticks
Flavio Javier Jarabeck
4.67 (9)
The idea of a Value Chart indicator was presented in the very good book I read back in 2020 , " Dynamic Trading Indicators: Winning with Value Charts and Price Action Profile ", from the authors Mark Helweg and David Stendahl. The idea is simple and the result is pure genius: Present candlestick Price analysis in a detrended way! HOW TO READ THIS INDICATOR Look for Overbought and Oversold levels. Of course, you will need to test the settings a lot to find the "correct" one for your approach.
FREE
Looks for strong price movements and draws levels upon their completion. You determine the strength of the movement yourself by specifying in the settings the number of points and the number of candles of the same color in a row in one direction. There are 2 types of building in the settings: extrenum - high / low close - close price You can also adjust the number of displayed levels and the number of candles for calculations. By default, the settings indicate 5 levels for 360 candles.
FREE
This indicator uses a different approach from the previous version to get it's trendlines. This method is derived from Orchard Forex, and the process of making the indicator is demonstrated in there video   https://www.youtube.com/watch?v=mEaiurw56wY&t=1425s . The basic idea behind this indicator is it draws a   tangent line   on the highest levels and lowest levels of the bars used for calculation, while ensuring that the lines don't intersect with the bars in review (alittle confusing? I kno
FREE
モメンタムリバーサルは、価格の動きとバーの形成の強さの分析に基づいて、可能な逆転ポイントと修正の開始を検出するための強力なツールです。 _________________________________ インジケータ信号の使用方法: この指標は、新しい価格バーが表示された後に信号を生成します。 価格が指定された方向の臨界点を突破した後、生成された信号を使用することをお勧めします。 インジケーターは信号を再描画しません。 _________________________________ インジケータパラメータは、信号の矢印の表示スタイルを変更することを示唆しています。 計算に使用されるパラメータを変更することは提供されていません-これは私の製品の哲学によるものです:安定性と客観性。 _________________________________ ご質問やご提案のいずれかが歓迎されており、プライベートメッセージで送信することができます _________________________________ 興味のあるすべての人に事前に感謝し、市場を征
FREE
Follow The Line MT5
Oliver Gideon Amofa Appiah
4.4 (30)
This indicator obeys the popular maxim that: "THE TREND IS YOUR FRIEND" It paints a GREEN line for BUY and also paints a RED line for SELL. (you can change the colors). It gives alarms and alerts of all kinds. IT DOES NOT REPAINT and can be used for all currency pairs and timeframes. Yes, as easy and simple as that. Even a newbie can use it to make great and reliable trades. NB: For best results, get my other premium indicators for more powerful and reliable signals. Get them here: https://www.m
FREE
DG DayInfo
David Gadelha
4.8 (10)
Purpose DG DayInfo is a free indicator that shows information about: Day's maximum prices; Day's minimum prices; Day's percentual variations; Daily candle direction (Up, Down or Flat); Candle timer; This way, DG DayInfo helps you to see day's maximum and minimum, check day's percentual variation and time left to close candle. Key features Designed to be simple to use, with a few parameters Works in ALL pairs Works within ALL time frames* Main Indicator Parameters Days - Set to how many days
FREE
トレーディングセッション時間インジケーター: 「トレーディングセッション時間インジケーター」は、外国為替市場での異なる取引セッションの理解を向上させるために設計された強力なテクニカル分析ツールです。このシームレスに統合されたインジケーターは、東京、ロンドン、ニューヨークなどの主要セッションの開始および終了時刻に関する重要な情報を提供します。自動的なタイムゾーンの調整により、世界中のトレーダーに対応し、取引スケジュールを高流動性の期間に最適化し、低活動時間を回避するのに役立ちます。市場センチメント、ピークのボラティリティ期間、およびセッションの重複に関する洞察を提供し、日中トレーダーが戦略に沿った正確な決定を行うのを支援します。カスタマイズ可能な表示により、ユーザーの体験を個人化できます。また、そのデータを組み込んだスマートな取引計画は、改善された取引結果につながる可能性があります。低活動時間の認識を促進することで、トレーダーは過度の取引を避け、品質の高い機会に集中できます。さまざまな取引プラットフォームとシームレスに互換性があり、「トレーディングセッション時間インジケーター」は、
FREE
Hi you, I need your help! Be my Patron, let's make it possible! https://www.patreon.com/joaopeuko https://github.com/Joaopeuko/Mql5-Python-Integration Channel: English version - Versão Inglês: https://www.mql5.com/en/channels/Mql5_Python_Integration_EN Portuguese version - Versão Português: https://www.mql5.com/en/channels/Mql5_Python_Integration_PT Free version with 5 indicators: https://www.mql5.com/en/market/product/57574 This version has 38 indicators, 5 from the free vers
FREE
チャートオーバーレイ インジケーターは、同じチャートで複数の商品の価格アクションを表示し、通貨ペアが互いにどのように変動するかを評価できます。 [ インストールガイド | 更新ガイド | トラブルシューティング | よくある質問 | すべての製品 ] 買われ過ぎまたは売られ過ぎの通貨ペアを簡単に見つける 同じチャートに最大6つの通貨ペアを重ねてプロット 必要に応じて反転記号を表示する チャートのサイズ、ズーム、時間枠に適応 自動価格レベル計算 カスタマイズ可能な価格レベル密度 カスタマイズ可能な色とサイズ 通貨ペアの反転とは何ですか? 通貨ペアの反転とは、取引の主要通貨を反転させた2つの通貨間の為替レートを表示することです。たとえば、EURUSD、GBPUSD、およびUSDJPYを同じオーバーレイチャートにプロットする場合、価格が逆レートを反映するためにUSDJPYを反転することは理にかなっています:JPYUSD。これにより、JPYUSDの価格は、オーバーレイチャートの他の2つのシンボルと正の相関関係で移動し、チャートの学習が容易になります。 インジケーターのテスト
FREE
QuantumAlert RSI Navigator is a free indicator available for MT4/MT5 platforms, its work is to provide "alerts" when the market is inside "overbought and oversold" regions in the form of "buy or sell" signals. This indicator comes with many customization options mentioned in the parameter section below, user can customise these parameters as needful. Join our MQL5 group , where we share important news and updates. You are also welcome to join our private channel as well, contact me for the priva
FREE
価格波形パターン MT5へようこそ --(ABCD パターン)-- ABCD パターンは、テクニカル分析の世界で強力で広く使用されている取引パターンです。 これは、トレーダーが市場での潜在的な売買機会を特定するために使用する調和的な価格パターンです。 ABCD パターンを使用すると、トレーダーは潜在的な価格変動を予測し、いつ取引を開始および終了するかについて十分な情報に基づいた決定を下すことができます。 EA バージョン:     Price Wave   EA MT5 MT4バージョン:   Price Wave Pattern MT4 特徴 :  ABCDパターンの自動検出。 強気パターンと弱気パターン。  任意のシンボルと任意の時間枠で機能します。 主要なレベルと価格目標。 カスタマイズ可能な設定と繊維レベルの調整。 アラートと通知。 今後  さらに多くの 機能が追加される  予定です 。
FREE
Rainbow MT5
Jamal El Alama
4.33 (3)
Description : Rainbow MT5 is a technical indicator based on Moving Average with period 34 and very easy to use. When price crosses above MA and MA changes color to green, then this is a signal to buy. When price crosses below MA and MA changes color to red, then this is a signal to sell. The Expert advisor ( Rainbow EA MT5 ) based on Rainbow MT5 indicator is now available here . MT4 version is available here .
FREE
Are you tired of drawing trendlines every time you're analyzing charts? Or perhaps you would like more consistency in your technical analysis. Then this is for you. This indicator will draw trend lines automatically when dropped on a chart. How it works Works similar to standard deviation channel found on mt4 and mt5. It has 2 parameters: 1. Starting Bar 2. Number of bars for calculation The   starting bar   is the bar which drawing of the trend lines will begin, while the   number of bars for c
FREE
This Mt5 Indicator Signals when there is two opposite direction bars engulfed by current bar.  has a recent Exponential Moving Average Cross and past bar was oversold/bought Expert Advisor Available in Comments  Free Version Here : https://www.mql5.com/en/market/product/110114?source=Site  ; Full Alerts for mt5 terminal , phone , email, print to file, print to journal  Buy Signal ( blue line ) Past ema cross ( set at 30 bars back ) Past bar rsi is oversold ( level 40  ) Engulfing bar closes
FREE
HammerStar
Arismario Verissimo Neves
3.14 (7)
The HammerStar indicator is designed to search for the Hammer and Shooting Star patterns on charts of any currency pairs. Hammer Downward trend. The lower shadow is not less than 2 and no more than 3 times larger than the body. There is no upper shadow, or it is very short (no more than 10% of the candlestick range). The color of the body in the long game is not important, with the short - white hammer is much stronger than the black one. Confirmation is suggested. Shooting Star Uptrend.
FREE
すべてのストラテジーをスキャンし、選択したアクティブのすべてのタイムフレームでの買いポイントと売りポイントを表示するスキャナーをお持ちになったことはありますか? それがまさにこのスキャナーが行うことです。このスキャナーは、 Rule Plotter: プログラミング不要のストラテジー作成ツール で作成した買いシグナルと売りシグナルを表示し、さまざまなアクティブとタイムフレームで実行するために設計されています。 Rule Plotterのデフォルトストラテジーは陽線と陰線だけです。つまり、Rule Plotter内に何のストラテジーも描かない場合、このスキャナーは選択したアクティブのすべてのタイムフレームでのキャンドルの色を表示します。キャンドルが陰線の場合は赤で、陽線の場合は緑です。 好きなだけストラテジーを作成 標準のストラテジーに制限されることはありません。Metatraderで利用可能なすべての指標を使用して従来のストラテジーを構築するか、お好きな指標を使用してカスタムストラテジーを構築できます。 このスキャナーはRule Plotterが提供するもののほんの一部であり、Rule
FREE
Donchian Channel is an indicator created by Richard Donchian. It is formed by taking the highest high and the lowest low of the last specified period in candles. The area between high and low is the channel for the chosen period. Its configuration is simple. It is possible to have the average between the upper and lower lines, plus you have alerts when price hits one side. If you have any questions or find any bugs, please contact me. Enjoy!
FREE
これは非常にシンプルなインジケーターであり、誰にとっても使いやすいものです。 ただし、非常に視覚的で、便利で効果的です。 すべての外国為替シンボルと時間枠に適しています。 しかし、私のテストと調査から、時間枠 M1、M5、M15 での使用はお勧めしません。 設定。 - アラートのオン/オフを選択します (デフォルトはオン)。 - 2 つのアラート間の時間 (秒) を選択します。 デフォルトは 30 秒です 使い方? - 上昇トレンド - バーの色が緑色の場合。 - 下降トレンド - バーの色がオレンジの場合。 - バーの色が変わると反転します。 使用上の推奨事項 上昇トレンドでの買いとバーの高値はほぼ同じです (緑色)。 下降トレンドでの売りとバーの高値はほぼ同じです (オレンジ色)。 反転が発生したときに市場に参入することは避け、2 または 3 バーの継続を検討してください。 必要に応じて、上昇トレンドと下降トレンドのバーの色を変更することもできます。 KPLスイングインジケーターと組み合わせれば完璧 KPL Swing Indicator
FREE
ColoredMA
Paulo Henrique Faquineli Garcia
4.33 (3)
Média Móvel que possui todos tipos de Cálculo comum: Simples Exponencial Suavizada Ponderada Conta com suporte para aplicação sob outros indicadores! Seu principal diferencial é o esquema de cores em GRADIENTE que, de acordo com a mudança no ângulo da média, altera suas cores conforme demonstrado nas imagens abaixo. Com isso, espera-se que o usuário tenha uma percepção mais suavizada das pequenas alterações. Bons trades!!
FREE
Сonverter for historical data files(2 files, Ask and Bid) from external sources like ducascopy or others sources of non-standard .csv quotes. The output format is compatible with MetaTrader5 and can be imported to MetaTrader5. The script can process multiple files(batch), see parameter "Convert all files in folder Files/FrankEditor". User can choose output timeframe, specific months and other options. 2 input files should look like(UTC or EET time): GBPUSD_1 Min_Ask_2017.01.01
FREE
Wave Box Market Frenquency
Jean Jacques Huve Ribeiro
4.83 (6)
Totally linked to the result of a movement and the duration he had. Its height records how many ticks the asset walked during a given movement, its width shows us the duration that movement had. Its configuration must be in line with the Weis Wave Indicator configuration to observe the movement force and can indicate a possible accumulation or distribution of the movement;
FREE
Equidistant bands indicator with calculated moving average, allows you to configure the band size and can be used freely as an entry / exit indicator. Buffer 0 = price, buffer 1 = upper band, buffer 2 = lower band. you can also configure the periods of moving averages used in the calculations and also the shift to previous bars in addition to the price that can CLOSE (default) or OPEN. Excellent for fast daily moving pairs and frequent returns.
FREE
Bill Williams' divergent bar with angulation. The angle between the green line and the top/bottom of the bar is used as an angle, which basically corresponds to the updated recommendations from Justin Williams  Angulation for the Wiseman Bullish and Bearish Divergent Signal Bar - YouTube . The default settings of the angle of 85 and 21 bar from the moment of crossing the lip line of the Alligator work quite well. If you use this indicator in real trading, I highly recommend not to engage in day
FREE
これは、ほぼ10年前に初めて公開された私の有名なスキャルパー、ゴールドフィンチEAの最新版です。短期間で起こる急激なボラティリティの拡大で市場をスキャルピングします。突然の価格上昇の後、価格変動の慣性を利用しようとします。この新しいバージョンは、トレーダーがテスターの最適化機能を簡単に使用して最適な取引パラメーターを見つけられるように簡素化されています。 [ インストールガイド | 更新ガイド | トラブルシューティング | よくある質問 | すべての製品 ] 最適化を容易にするシンプルな入力パラメーター カスタマイズ可能な取引管理設定 取引セッションの選択 平日の選択 資金管理 注意してください... 多くの要因が見返りを台無しにする可能性があるため、ダニのダフ屋は危険です。変動スプレッドとスリッページは、取引の数学的期待値を低下させ、ブローカーからの低いティック密度は幻の取引を引き起こす可能性があり、ストップレベルは利益を確保する能力を損ない、ネットワークラグはリクオートを意味します。注意が必要です。 バックテスト Expert Advisorはティックデータのみを使
FREE
Market Time Pad
Vladislav Andruschenko
4.6 (15)
世界の主要市場の現在時刻を表示するインジケーター。また、現在のセッションも表示されます。 とても使いやすいです。チャート上であまりスペースを占めません。 ExpertAdvisorsやVirtualTradePad などの他のパネルと一緒に使用できます。 クラシックスタイルバージョン。 親愛なる友人やEAのユーザーの皆様、 レビュー セクションに評価を追加してください。 私たちの外国為替ソフトウェアへのすべてのアップデートは 無料 です! これは無料の取引ユーティリティです! その他の機能: 入力パラメータにはオプションがあります。ボタンの上にマウスを置くとヒントを表示/非表示にします。ヒントの言語を英語/ロシア語で選択することもできます。 [閉じる]ボタンはアプリケーションを停止します。 [最大化/最小化]ボタンは、チャートのペインを折りたたむ/展開します。 ペインはチャート上で移動できます。これを行うには、[閉じる]ボタンと[最小化]ボタンの近くにあるペインの上部をクリックしてから、ペインを目的の位置に移動します。 Expforex,Vladon,Indicator,Utilit
FREE
SUPERTREND; It is a trend following indicator based on the SuperTrend ATR created by Olivier Seban. It can be used to detect changes in trend direction and locate stops. When the price falls below the indicator curve, it turns red and indicates a downtrend. Conversely, when the price moves above the curve, the indicator turns green, indicating an uptrend. Like other indicators, it works well on SuperTrend when used in conjunction with other indicators such as MACD, parabolik SAR, Bollinger Band
FREE
このプロダクトを購入した人は以下も購入しています
まず第一に、このトレーディングシステムがノンリペイント、ノンリドロー、ノンラグのインジケーターであることを強調する価値がある。これにより、手動取引とロボット取引の両方に理想的なものになっています。 「スマートトレンドトレーディングシステム MT5」は、新規および経験豊富なトレーダー向けにカスタマイズされた包括的なトレーディングソリューションです。10以上のプレミアムインジケーターを組み合わせ、7つ以上の堅実なトレーディング戦略を備えており、多様な市場状況に対応する多目的な選択肢となっています。 トレンドフォロー戦略:トレンドを効果的に乗り越えるための正確なエントリーとストップロス管理を提供します。 リバーサル戦略:潜在的なトレンドの反転を特定し、トレーダーがレンジ相場を活用できるようにします。 スキャルピング戦略:高速で正確なデイトレードおよび短期取引のために設計されています。 安定性:すべてのインジケーターはノンリペイント、ノンリドロー、ノンラグであり、信頼性の高いシグナルを保証します。 カスタマイズ:個々の取引の嗜好に合わせたカスタム戦略をサポートします。7つ以上の戦略と組み合わせ
まず第一に、この取引インジケーターは再描画されず、再描画されず、遅延しないことを強調する価値があります。これにより、手動取引とロボット取引の両方に理想的なものになります。 アトミックアナリストは、価格の強さとモメンタムを利用して市場でより良いエッジを見つけるためのPA価格アクションインジケーターです。ノイズや誤ったシグナルを除去し、取引ポテンシャルを高めるための高度なフィルターを備えています。複雑なインジケーターの複数のレイヤーを使用して、アトミックアナリストはチャートをスキャンし、複雑な数学的計算をシンプルなシグナルと色に変換します。これにより、どのような初心者トレーダーでも理解して使用し、一貫した取引の決定を行うことができます。 「アトミックアナリスト」は、新規および経験豊富なトレーダー向けにカスタマイズされた包括的な取引ソリューションです。プレミアムインジケーターとトップノッチの機能を1つの取引戦略に組み合わせ、すべてのタイプのトレーダーにとって汎用性のある選択肢にします。 デイリートレーディングとスキャルピング戦略:高速で正確なデイトレーディングおよび短期トレード
ご紹介   クォンタム トレンド スナイパー インジケーターは 、トレンド反転を特定して取引する方法を変革する画期的な MQL5 インジケーターです。 13年以上の取引経験を持つ経験豊富なトレーダーのチームによって開発されました。     クォンタムトレンドスナイパーインジケーター   は、非常に高い精度でトレンドの反転を識別する革新的な方法で、あなたのトレーディングの旅を新たな高みに押し上げるように設計されています。 ***Quantum Trend Sniper Indicatorを購入すると、Quantum Breakout Indicatorを無料で入手できます!*** クォンタム ブレイクアウト インジケーターは、トレンドの反転を特定するとアラートを発し、矢印を示し、3 つのテイクプロフィットレベルを提案します。 初心者トレーダーにもプロのトレーダーにも適しています。 量子EAチャネル:       ここをクリック MT4のバージョン:       ここをクリック 推奨事項: 期間:すべての時間枠。最良の結果を得るには、M
Gold Stuff mt5
Vasiliy Strukov
4.89 (167)
Gold Stuff mt5 は、金専用に設計されたトレンド指標であり、あらゆる金融商品にも使用できます。 インジケーターは再描画せず、遅れません。 推奨時間枠 H1. 設定と個人的なボーナスを得るために、購入後すぐに私に連絡してください!   設定 矢印を描く - オンオフ。 チャートに矢印を描く。 アラート - 可聴アラートのオンオフ。 メール通知 - オンオフ。 電子メール通知。 プチ通知 - オンオフ。 プッシュ通知。 次に、色域を調整します。 Gold Stuff mt5 は、金専用に設計されたトレンド指標であり、あらゆる金融商品にも使用できます。 インジケーターは再描画せず、遅れません。 推奨時間枠 H1. 設定と個人的なボーナスを得るために、購入後すぐに私に連絡してください!   設定 矢印を描く - オンオフ。 チャートに矢印を描く。 アラート - 可聴アラートのオンオフ。 メール通知 - オンオフ。 電子メール通知。 プチ通知 - オンオフ。 プッシュ通知。 次に、色域を調整します。
トレンド スクリーナー インジケーターでトレンド取引の力を解き放ちます。ファジー ロジックと複数通貨システムを活用した究極のトレンド取引ソリューションです。 ファジー ロジックを活用した革新的なトレンド インジケーターである Trend Screener を使用して、トレンド取引を向上させます。 これは、13 を超えるプレミアム ツールと機能、および 3 つの取引戦略を組み合わせた強力なトレンド追跡インジケーターであり、Metatrader をトレンド アナライザーにする多用途の選択肢となります。 期間限定オファー : トレンド スクリーナー インジケーターは、わずか 50 ドルで生涯ご利用いただけます。 (元の価格 125$ ) (オファー延長) Trend Screener の 100% 非再描画精度の揺るぎない精度を体験して、取引の決定が過去の価格変動の影響を受けないようにしてください。 マルチタイムフレームおよびマルチ通貨機能の多用途性を解放し、比類のない自信を持って外国為替、商品、暗号通貨、インデックスの世界を取引できるようにします。 Trend Screener の包括的な
FX Volume MT5
Daniel Stein
4.94 (17)
mql5と Telegramの モーニング・ブリーフィングで、詳細とスクリーンショットを含む毎日のマーケット・アップデートをご覧 ください! FX Volumeは、ブローカーの視点から市場のセンチメントをリアルに洞察する、最初で唯一の出来高インジケーターです。 ブローカーのような機関投資家が外国為替市場でどのようなポジションをとっているか、COTレポートよりもはるかに速く、素晴らしい洞察を提供します。 この情報をチャート上で直接見ることは、あなたの取引にとって真のゲームチェンジャーであり、画期的なソリューションです。 以下のようなユニークなマーケットデータ洞察から利益を得てください。 比率は 、通貨のロングポジションとショートポジションの比率をパーセントで表示します。 比率の変化は 、選択した期間内のロング比率とその変化率を表示します。 Volumes Totalは 、通貨の取引量(ロングとショート)の合計をロット単位で表示します。 Volumes Long :全通貨のロングポジションの取引量を表示します。 Volumes(ショート )は、全通貨のショートポジションの取引量を表示
まず第一に、この取引ツールはノンリペイント、ノンリドロー、ノンラグの指標であり、プロの取引に理想的ですことを強調する価値があります。 スマートプライスアクションコンセプトインジケーターは、新米から経験豊富なトレーダーまで、非常 に強力なツールです。Inner Circle Trader AnalysisやSmart Money Concepts Trading Strategiesなど、20以上の有用な指標を1つに組み合わせています。このインジケーターはスマートマネーコンセプトに焦点を当て、大手機関の取引方法を提供し、彼らの動きを予測するのに役立ちます。 特に、流動性分析に優れており、機関がどのように取引しているかを理解しやすくしています。市場のトレンドを予測し、価格の動きを慎重に分析するのに優れています。機関の戦略とトレードを合わせることで、市場の動向についてより正確な予測ができます。このインジケーターは多目的であり、市場構造を分析し、重要な注文ブロックを特定し、さまざまなパターンを認識するのに優れています。 このインジケーターはBOSやCHoCHなどのパターンの識
現在33%オフ 初心者にもエキスパートトレーダーにも最適なソリューション このインジケーターは独自の機能と新しい公式を多数内蔵しており、ユニークで高品質かつ手頃な取引ツールです。このアップデートでは、2つの時間枠ゾーンを表示できるようになります。より長いTFだけでなく、チャートTFとより長いTF(ネストゾーンを表示)の両方を表示できます。すべてのSupply Demandトレーダーの皆さんのお気に召すはずです。:) 重要情報の公開 Advanced Supply Demandの可能性を最大化するには、 https://www.mql5.com/ja/blogs/post/720245 にアクセスしてください。   エントリーまたはターゲットの正確なトリガーポイントを正確に特定できれば取引がどのように改善されるか想像してみてください。新しい基盤となるアルゴリズムに基づいて構築されているため、買い手と売り手の間の潜在的な不均衡をさらに簡単に特定できます。これは、最も強い需要と供給のゾーンと、過去のパフォーマンス(古いゾーンを表示)がグラフィカルに表現されるためです。これらの機能は、最適
AW Trend Predictor MT5
AW Trading Software Limited
4.76 (55)
1 つのシステムでのトレンド レベルとブレイクダウン レベルの組み合わせ。高度なインジケーター アルゴリズムは、市場のノイズをフィルター処理し、トレンド、エントリー ポイント、および可能なエグジット レベルを決定します。インジケーターシグナルは統計モジュールに記録されるため、最適なツールを選択してシグナル履歴の有効性を示すことができます。この指標は、テイクプロフィットとストップロスのマークを計算します。 マニュアルと説明書 ->   ここ / MT4 バージョン ->   ここ インジケーターで取引する方法: Trend Predictor での取引は、たった 3 つの簡単なステップです。 ステップ 1 - ポジションを開く 70% 以上の成功率で買いシグナルが受信されました ステップ 2 - ストップロスの決定 逆信号でトランクを選択 ステップ 3 - テイクプロフィット戦略の定義 戦略 1: TP1 に到達したらポジション全体をクローズする 戦略 2: TP1 に達した時点でポジションの 50% をクローズし、TP2 に達した時点で残りの 50% をクローズします。 戦略 3:
TPSpro TRENDPRO  - is a trend indicator that automatically analyzes the market and provides information about the trend and each of its changes, as well as giving signals for entering trades without redrawing! The indicator uses each candle, analyzing them separately. referring to different impulses - up or down impulse. Exact entry points into transactions for currencies, crypto, metals, stocks, indices!  -  Version MT4                  DETAILED DESCRIPTION        /       TRADING SETUPS       
A key element in trading is zones or levels from which decisions to buy or sell a trading instrument are made. Despite attempts by major players to conceal their presence in the market, they inevitably leave traces. Our task was to learn how to identify these traces and interpret them correctly. Reversal First Impulse levels (RFI)   -  Version MT4                  INSTRUCTIONS                 RUS                 ENG                         R ecommended to use with an indicator   -  TREND PRO  
これはMT5のインジケーターで、再描画なしで取引に参入するための正確なシグナルを提供します。 外国為替、暗号通貨、金属、株式、インデックスなど、あらゆる金融資産に適用できます。かなり正確な見積もりを提供し、取引を開始して終了するのに最適な時期を教えてくれます。1つのシグナルを処理しただけでインジケーターの元が取れた例の 動画 (6:22)をご覧ください。Entry PointsPro インジケーターの助けを借りたほとんどのトレーダーの最初の1週間の結果が改善しています。 Telegramグループ に登録してください。Entry Points Proインジケーターのメリットは次の通りです。 再描画のないエントリーシグナル 再描画されるインジケーターでは一度表示されたシグナルが削除されて大きな金銭的損失につながることがありますが、これと異なり、表示されて確認されたシグナルは消えることがありません。 エラーなしの取引開始 インジケーターアルゴリズムによって取引を開始する(資産を売買する)理想的な瞬間を見つけることができます。それを使用するすべてのトレーダーの成功率が向上します。
Gartley Hunter Multi - An indicator for searching for harmonic patterns simultaneously on dozens of trading instruments and on all classic timeframes: (m1, m5, m15, m30, H1, H4, D1, Wk, Mn). Manual (Be sure to read before purchasing) | Version for MT4 Advantages 1. Patterns: Gartley, Butterfly, Shark, Crab. Bat, Alternate Bat, Deep Crab, Cypher 2. Simultaneous search for patterns on dozens of trading instruments and on all classic timeframes 3. Search for patterns of all possible sizes. Fr
今、147ドル(いくつかの更新後に499ドルに増加します) - 無制限のアカウント(PCSまたはMac) RelicusRoad ユーザー マニュアル + トレーニング ビデオ + プライベート Discord グループへのアクセス + VIP ステータス 市場の新しい見方 RelicusRoad は、外国為替、先物、暗号通貨、株式、および指数の世界で最も強力な取引インジケーターであり、トレーダーに収益を維持するために必要なすべての情報とツールを提供します。初心者から上級者まで、すべてのトレーダーが成功するためのテクニカル分析と取引計画を提供します。これは、将来の市場を予測するのに十分な情報を提供する重要な取引指標です。意味をなさないチャート上のいくつかの異なる指標ではなく、完全な解決策を信じています.これは、信号、矢印 + 価格アクション情報を表示するオールインワンのインジケーターで、他に類を見ない非常に正確です。 強力な AI に基づいて、RelicusRoad は不足している情報とツールを提供して、あなたを教育し、トレーディングのプロ、成功したトレーダーにします。
Noize Absorption Index - is the manual trading system that measures the difference of pressure between bears forces and bulls forces. Green line - is a noize free index that showing curent situation. Zero value of index shows totally choppy/flat market.Values above zero level shows how powerfull bullish wave is and values below zero measures bearish forces.Up arrow appears on bearish market when it's ready to reverse, dn arrow appears on weak bullish market, as a result of reverse expectation.
mql5と Telegramの モーニング・ブリーフィングで、詳細とスクリーンショットを含む毎日のマーケット・アップデートをご覧 ください! FX Power MT5 NGは 、長年の人気を誇る通貨強度計FX Powerの次世代モデルです。 この次世代ストレングスメーターは何を提供するのでしょうか?初代FXパワーの魅力すべて プラス GOLD/XAUの強さ分析 より正確な計算結果 個別に設定可能な分析期間 カスタマイズ可能な計算上限値により、さらに優れたパフォーマンスを実現 もっと見たい人のための特別なマルチインスタンス設定 すべてのチャートでお好みの色を無限に設定可能 数え切れないほどの通知オプションにより、重要なことを見逃すことはありません。 Windows 11とmacOSのスタイルで角を丸くした新しいデザイン 魔法のように動くインジケーターパネル FXパワーの主な機能 すべての主要通貨の強さの完全な履歴 すべての時間枠における通貨の強さの履歴 すべてのブローカーとチャートで同一の計算結果 100%信頼できるリアルタイム計算 -> リペイントなし ドロップダウン・リストから
ICT, SMC, SMART MONEY CONCEPTS, SMART MONEY, Smart Money Concept, Support and Resistance, Trend Analysis, Price Action, Market Structure, Order Blocks, BOS/CHoCH,   Breaker Blocks ,  Momentum Shift,   Supply&Demand Zone/Order Blocks , Strong Imbalance,   HH/LL/HL/LH,    Fair Value Gap, FVG,  Premium  &   Discount   Zones, Fibonacci Retracement, OTE, Buy Side Liquidity, Sell Side Liquidity, BSL/SSL Taken, Equal Highs & Lows, MTF Dashboard, Multiple Time Frame, BigBar, HTF OB, HTF Market Structure
MetaForecast M5
Vahidreza Heidar Gholami
5 (2)
MetaForecastは、価格データのハーモニクスに基づいて、どんな市場の未来を予測し視覚化します。市場が常に予測可能ではありませんが、価格にパターンがある場合、MetaForecastは可能な限り正確な未来を予測できます。他の類似製品と比較して、MetaForecastは市場のトレンドを分析することでより正確な結果を生成することができます。 入力パラメータ Past size (過去のサイズ) MetaForecastが将来の予測を生成するために使用するバーの数を指定します。モデルは選択したバー上に描かれた黄色の線で表されます。 Future size (将来のサイズ) 予測すべき将来のバーの数を指定します。予測された将来は、ピンクの線で表示され、その上に青い回帰線が描かれます。 Degree (程度) この入力は、MetaForecastが市場で行う分析のレベルを決定します。 Degree 説明  0 Degree 0の場合、価格の全てのピークや谷、そして詳細をカバーするために、「Past size」の入力に大きな値を使用することが推奨されています。  1 (推奨) Degr
Professional Scalping Tool on Deriv Attention! The indicator will be sold in limited quantities!!! The previous 5 copies were sold for $250 The next 5 copies will be sold for $350 The next price is $500 Description: This trading indicator is designed for professional traders focused on scalping. Designed with the market in mind, it provides highly accurate spike trading signals. It works on the M1 timeframe and supports the following symbols: Boom 300 Index, Boom 500 Index, Boom 1000 Index,
The Volume by Price Indicator for MetaTrader 5 features Volume Profile and Market Profile TPO (Time Price Opportunity). Get valuable insights out of currencies, equities and commodities data. Gain an edge trading financial markets. Volume and TPO histogram bar and line charts. Volume Footprint charts. TPO letter and block marker charts including split structures. Versatile segmentation and compositing methods. Static, dynamic and flexible ranges with relative and/or absolute visualizations. Lay
トレンド検出インジケーターはあらゆる戦略を補完し、独立したツールとしても使用できます。 インジケーターの操作に関する推奨事項、コメント   #8   でダウンロードできます 利点 使いやすく、不要な情報でチャートを過負荷にしません。 あらゆる戦略のフィルターとして使用できます。 利益を得るのとストップロスを設定するの両方に使用できる動的なサポートとレジスタンスのレベルが組み込まれています。 ローソク足が閉じた後、インジケーターの色は変わりません。  株式市場、指数、石油、金、およびすべての時間枠で機能します。 トースト通知、電子メール通知、プッシュ通知、サウンドアラートの機能があります。 私の他の開発はここで見つけることができます: https://www.mql5.com/ja/users/mechanic/seller 入力パラメータ Alert-オン/オフ。アラート; Push Notification-オン/オフ。プッシュ通知; Mail-オン/オフ電子メール通知; Fibo 1,2,3,4,5,6,7,11,21,31,41,51,61,71-動的サポートと抵抗
Quantum平均足PRO のご紹介 市場のトレンドに対する明確な洞察を提供するように設計された平均足キャンドルは、ノイズを除去し、誤ったシグナルを排除する能力で知られています。混乱を招く価格変動に別れを告げ、よりスムーズで信頼性の高いチャート表現を導入しましょう。 Quantum Heiken Ashi PRO を真にユニークなものにしているのは、従来のローソク足データを読みやすい色のバーに変換する革新的なフォーミュラです。赤と緑のバーはそれぞれ弱気トレンドと強気トレンドをエレガントに強調し、潜在的なエントリーポイントとエグジットポイントを驚くほど正確に見つけることができます。 量子EAチャネル:       ここをクリック MT4のバージョン:       ここをクリック この注目すべき指標には、いくつかの重要な利点があります。 明確性の向上: 価格変動を平滑化することで、平均足バーは市場トレンドをより明確に表現し、有利な取引機会を特定しやすくします。 ノイズの削減: 誤ったシグナルを引き起こすことが多い不安定な価格変動に別れを告げます。 Quantum Heik
IX Powerは 、FX Powerの無敵の精度をついにFX以外のシンボルにも提供します。 お気に入りの指数、株式、コモディティ、ETF、さらには暗号通貨の短期、中期、長期のトレンドの強さを正確に判断します。 お使いの端末が提供する すべてを分析する ことができます。ぜひお試しいただき、取引 タイミングが大幅に改善 されることをご体験ください。 IXパワーの主な特徴 100%正確で再描画されない計算結果 - ターミナルで利用可能なすべての取引シンボルに対して 予め設定され、さらに個別に設定可能な強度分析期間のドロップダウン選択 Eメール、メッセージ、モバイル通知による無数の通知オプション EAリクエストのためのアクセス可能なバッファ カスタマイズ可能な計算制限により、さらに優れたパフォーマンスを実現 もっと見たい人のための特別なマルチインスタンス設定 すべてのチャートでお好みの色を無限に設定可能 Windows 11とmacOSのスタイルで角を丸くした新しいパネルデザイン サブ・ウィンドウとメイン・チャートの間をシームレスに移動する、魔法のように動くイン
ブレーカートレーダーになり、価格が反転すると市場構造からの利益が変化します。 注文ブロックブレーカーインジケーターは、トレンドまたは価格の動きが枯渇に近づいており、逆転の準備ができていることを識別します。通常、反転または大規模なプルバックが発生しようとしているときに発生する市場構造の変化について警告します。 この指標は、ブレイクアウトと価格の勢いを識別する独自の計算を使用します。使い果たされる可能性のあるポイントの近くで新しい高値が形成されるたびに、インディケーターはその高値の作成を担当する最後の注文ブロックを描きます。次に、移動する価格とともに注文ブロックを追跡します。その後、価格が反対方向にシフトし、その注文ブロックを突破すると、新しい市場構造を作成し、トレンドまたは大きな後退の可能性のある反転の開始を警告します。 注文ブロックは、高値/安値が作成される前の最後の反対色のろうそくであり、価格がこれらの重要な領域を下抜けすると、トレンドの短期的ま​​たは長期的な反転の兆候です。 特徴 重要な枯渇点での市場構造の変化を警告します 価格が使い果たされるレベルに近づくと、
Was: $299  Now: $99   Supply Demand uses previous price action to identify potential imbalances between buyers and sellers. The key is to identify the better odds zones, not just the untouched ones. Blahtech Supply Demand indicator delivers functionality previously unavailable on any trading platform. This 4-in-1 indicator not only highlights the higher probability zones using a multi-criteria strength engine, but also combines it with multi-timeframe trend analysis, previously confirmed swings
BUY INDICATOR AND GET EA FOR FREE AS A BONUS + SOME OTHER GIFTS! ITALO VOLUME INDICATOR  is the best volume indicator ever created, and why is that? The Indicator works on all time-frames and assets, indicator built after 7 years of experience on forex and many other markets. You know many volume indicators around the internet are not complete, does not help, and it's difficult to trade, but the Italo Volume Indicator is different , the Italo Volume Indicator shows the wave volume, when market
ご紹介     Quantum Breakout PRO は 、ブレイクアウト ゾーンの取引方法を変革する画期的な MQL5 インジケーターです。 13年以上の取引経験を持つ経験豊富なトレーダーのチームによって開発されました。     クォンタム ブレイクアウト プロ   は、革新的でダイナミックなブレイクアウト ゾーン戦略により、あなたのトレーディングの旅を新たな高みに押し上げるように設計されています。 クォンタム ブレイクアウト インジケーターは、5 つの利益ターゲット ゾーンを備えたブレイクアウト ゾーン上のシグナル矢印と、ブレイクアウト ボックスに基づいたストップロスの提案を提供します。 初心者トレーダーにもプロのトレーダーにも適しています。 量子EAチャネル:       ここをクリック 重要!購入後、インストールマニュアルを受け取るためにプライベートメッセージを送ってください。 推奨事項: 時間枠: M15 通貨ペア: GBPJPY、EURJPY、USDJPY、NZDUSD、XAUUSD アカウントの種類: ECN、Raw、またはス
Auto Order Block with break of structure based on ICT and Smart Money Concepts Futures Break of Structure ( BoS )             Order block ( OB )            Higher time frame Order block / Point of Interest ( POI )    shown on current chart           Fair value Gap ( FVG ) / Imbalance   ,  MTF      ( Multi Time Frame )    Volume Imbalance     ,  MTF          vIMB Gap’s Equal High / Low’s     ,  MTF             EQH / EQL Liquidity               Current Day High / Low           HOD /
Step into the realm of Forex trading with confidence and precision using XQ, a cutting-edge Forex indicator designed to elevate your trading game to unprecedented heights. Whether you're a seasoned trader or just stepping into the world of currency exchange, XQ Forex Indicator empowers you with the insights and signals needed to make informed trading decisions. The signal conditions are a combination of three indicators, and XQ Forex Indicator only display  medium and long-term trends . The ind
MT4版  |  FAQ Owl Smart Levels Indicator は、 Bill Williams の高度なフラクタル、市場の正しい波構造を構築する Valable ZigZag、エントリの正確なレベルをマークする Fibonacci レベルなどの一般的な市場分析ツールを含む 1 つのインジケーター内の完全な取引システムです。 利益を得るために市場と場所に。 戦略の詳細な説明 インジケータを操作するための指示 顧問-取引助手 プライベートユーザーチャット ->購入後に私に書いて、私はプライベートチャットにあなたを追加し、あなたはそこにすべてのボーナスをダウンロードすることができます 力はシンプルさにあります! Owl Smart Levels 取引システムは非常に使いやすいので、専門家にも、市場を勉強し始めて自分で取引戦略を選択し始めたばかりの人にも適しています。 戦略と指標に秘密の数式や計算方法が隠されているわけではなく、すべての戦略指標は公開されています。 Owl Smart Levels を使用すると、取引を開始するためのシグナルをすばやく確認し、注文を出すため
作者のその他のプロダクト
This indicator created based on original John Carter's TTM_Squeeze indicator and represents "squeeze" of the market which can be followed (or maybe not) by significant moves. Original indicator prints black dots when Bollinger Bands are inside Kelthner Channels and exactly this implemented in this custom version. Instead of original implementation as momentum indicator MACD indicator with standard settings 12-26-9 is being used. Mainly, the indicator is useful for understanding when it's better
FREE
The same indicator as here Скачайте Технический индикатор 'John Carters TTM Squeeze with MACD Multitimeframe' для MetaTrader 5 в магазине MetaTrader Market (mql5.com) , but instead of MACD, Bill Williams' AO (Awesome Oscillator) is used. It goes well with a sleeping Alligator to determine periods of "compression-calm", which may be followed by significant movement. It is useful to use an indicator from a higher timeframe (coefficient 5 or 6) to determine the possible direction of a breakout.
FREE
The indicator is based on Robert Miner's methodology described in his book "High probability trading strategies" and displays signals along with momentum of 2 timeframes. A Stochastic oscillator is used as a momentum indicator. The settings speak for themselves period_1 is the current timeframe, 'current' period_2 is indicated - the senior timeframe is 4 or 5 times larger than the current one. For example, if the current one is 5 minutes, then the older one will be 20 minutes The rest of the
FREE
Bill's Williams Awesome Oscillator signal from his book "Trading chaos 2nd edition" on bars.  Normally this signal is being used for 2nd entry after 1st entry by Divergent bar ----------------------------------------------------------------------------------------------------------- Please make shure that you understand Bill's Williams system before trade with real money using this indicator. Ideal entry setup is: 1) Divergence with zero line AO crossing 2) Divergent bar on top of the final 5th
FREE
The same indicator that is published here  https://www.mql5.com/en/market/product/105645?source=Site+Market+My+Products+Page , but instead of the MACD, a Stochastic Oscillator is used.  The indicator can be useful for searching for the possibility of opening a position on the Momuntum of multiple timeframes - a method described by Robert Miner in his book "High probability trading strategies". The settings speak for themselves Period - the timeframe for which the indicator is calculated.
FREE
The indicator shows Jake Bernstein's MAC (Moving Average Channel) System signals ---------------------------------------- System assumes several types of entering in trade, in this indicator only one type implemented - on closing of second trigger bar. It is recommended to start using this indicator together with Jake Bernstein's free lessons  https://www.youtube.com/@JakeatMBH/videos Arrow shows signal bar - enter on closing or on opening of the next bar, cross - stop level, dot - minimum profi
FREE
Trading is challenging, espessially day trading. The main purpose of this program is to prevent the user from losing their account. The most important thing is DO NOT TURN IT OFF. It will not allow you to open abnormally large positions or trade too frequently. It will likely be difficult for you not to disable the program, especially if you are a beginner. If you are losing, you will have the urge to open larger positions and/or to reverse the position in the opposite direction, fearing that th
FREE
Market scanner based on the indicator published here  Download the 'John Carters TTM Squeeze with MACD' Technical Indicator for MetaTrader 5 in MetaTrader Market (mql5.com) .  Only the instruments that are in the Market Watch window are scanned. Maximum number of scanning tools up to 5000. The scan timeframe is selected from the timeframe panel of the terminal. To use it, open any chart and attach the Expert Advisor to the chart, the 'Search' button will appear in the upper left corner. When you
FREE
Bill Williams' divergent bar with angulation. The angle between the green line and the top/bottom of the bar is used as an angle, which basically corresponds to the updated recommendations from Justin Williams  Angulation for the Wiseman Bullish and Bearish Divergent Signal Bar - YouTube . The default settings of the angle of 85 and 21 bar from the moment of crossing the lip line of the Alligator work quite well. If you use this indicator in real trading, I highly recommend not to engage in day
FREE
Market scanner based on the indicator published here Download the 'Divergent Bar' Technical Indicator for MetaTrader 5 in MetaTrader Market (mql5.com) . Only the instruments that are in the Market Watch window are scanned. Maximum number of scanning tools up to 5000. The scan timeframe is selected from the timeframe panel of the terminal. To use it, open any chart and attach the Expert Advisor to the chart, the 'Search' button will appear in the upper left corner. When you click on the button, t
FREE
フィルタ:
レビューなし
レビューに返信
バージョン 1.1 2023.09.28
Critical issue fixed