AutoSR Automatic Support and Resistance Indicator
- インディケータ
- Yibeltal Beyabel Eneyew
- バージョン: 1.0
- アクティベーション: 5
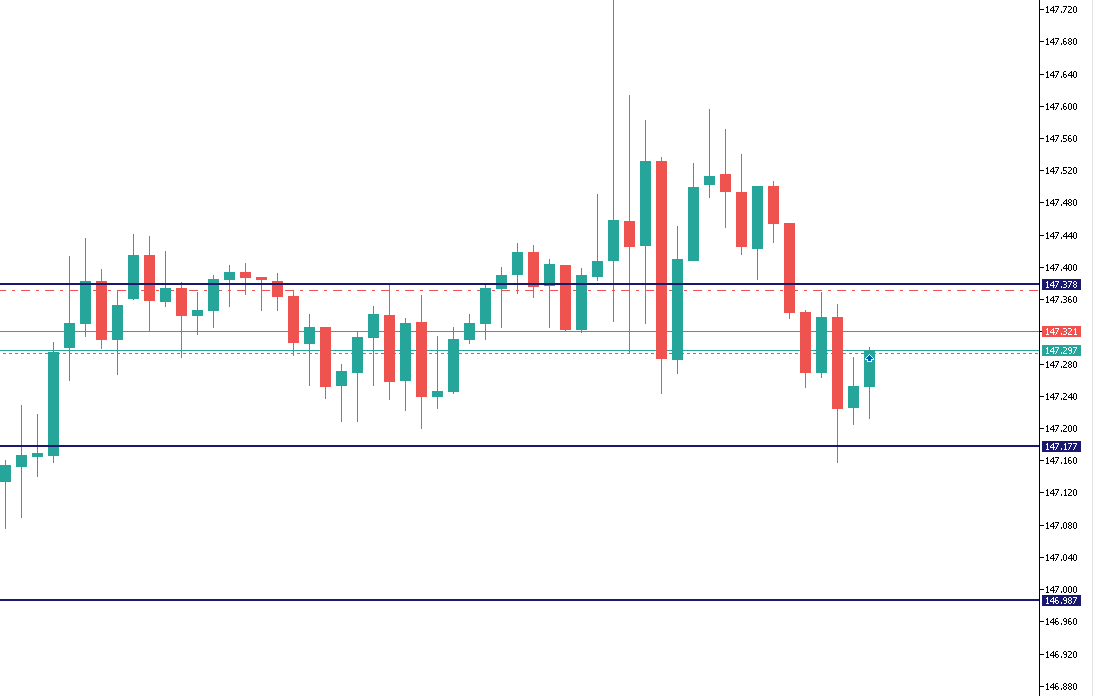
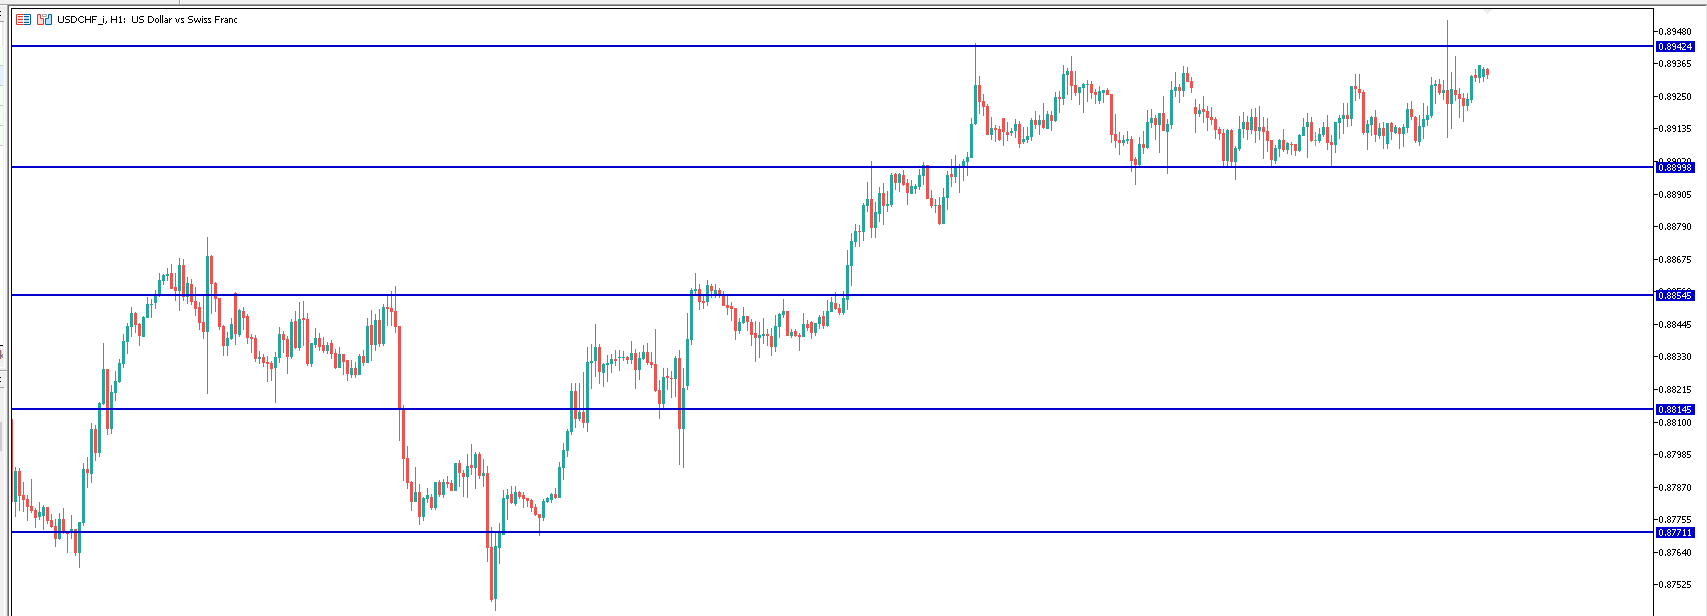
This Automatic support/resistance indicator calculates various peaks and troughs of the price action, identifies relevant levels and draws support and resistance automatically. It uses the built-in "ZigZag" indicator in Metatrader as a data source hence, very much accurate indicator.
The support and resistance lines are contineusely updated as new levels and formed.
The indicator has only 5 parameters to set, and mostly it can be used with the default values:
The description of the settings is shown below:
- Minimum gap between peaks: if two peaks are, say, 100 points apart, they may not be different, they are part of a level with slight difference. Default value is 100
- Sensitivity: There must be at least a certain number of peaks on the same level for the level to be considered as either a support or resistance. Otherwise, it is just a random peak (likely false one). default value is 2
- Lookback count: The display chart should limit to consider a certain number of levels, otherwise it could be unnecessary display cluttering. The default value is 50.
- Line Color: obviously, the color of the support/resistance lines can be adjusted as required. Default value is midnight blue color
- Line weight: This is the thickness of the line. Default value is 2
The indicator is automatically removed from the computer memory as soon as the chart window is closed. This avoids unnecessary computer slow down.