Over And Under Pattern Scanner Mt5
- インディケータ
- Davoud Moghaddam
- バージョン: 1.1
- アップデート済み: 21 12月 2023
- アクティベーション: 20
- This is the Full Version, to get the free version please contact me.
- The free version works on “USDJPY” charts.
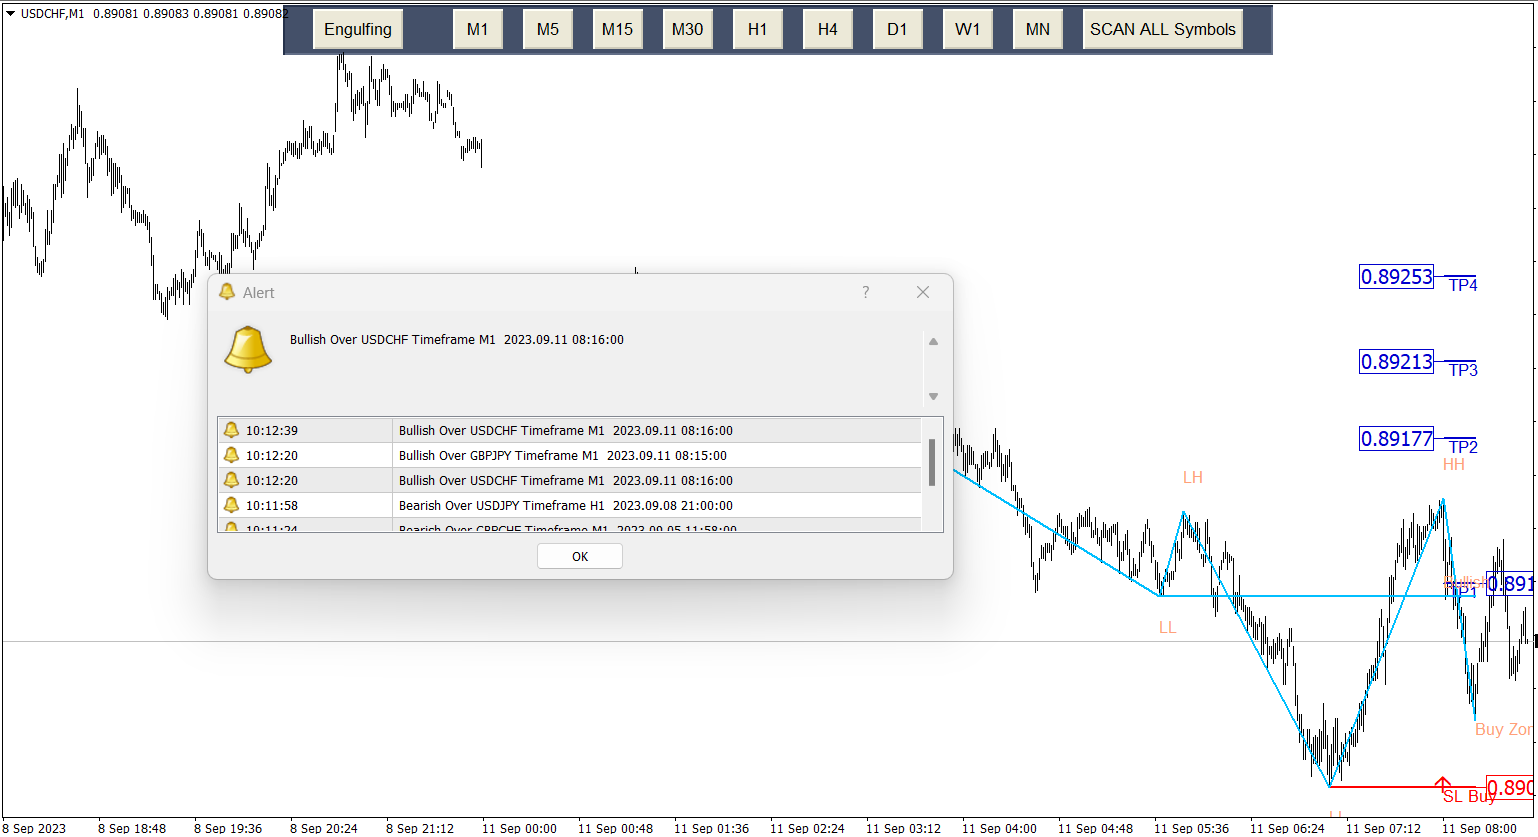
- All symbols and time frames scanner.
- Contact me after payment to send you the User-Manual PDF File.
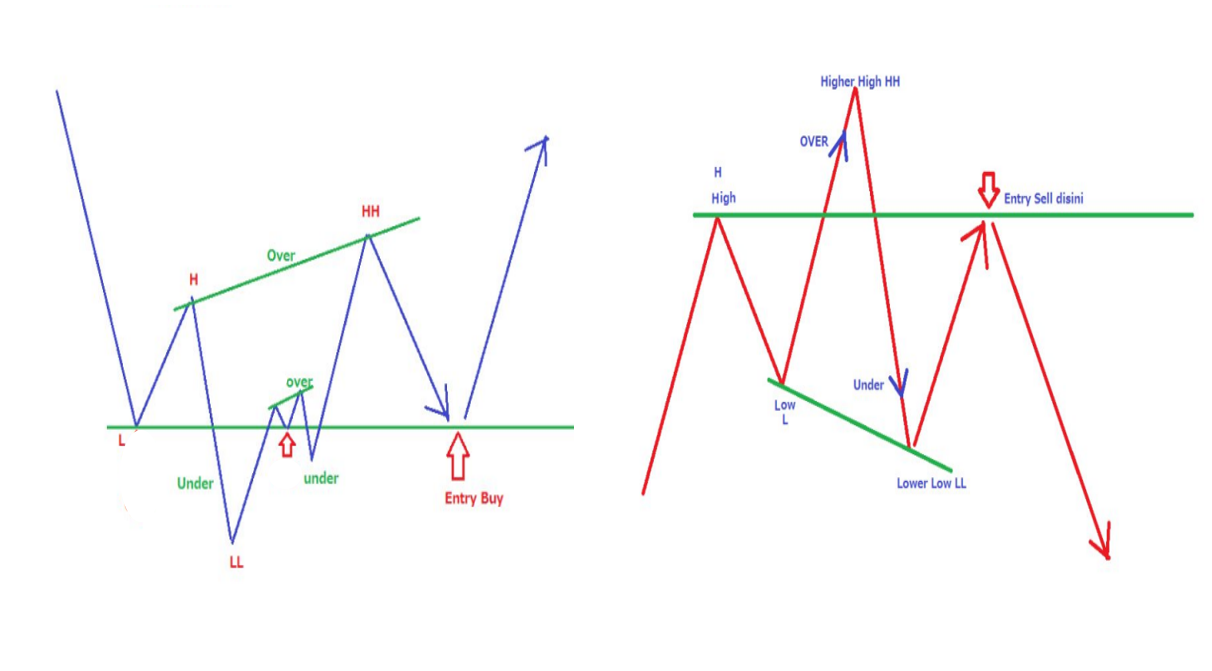
OVER and UNDER
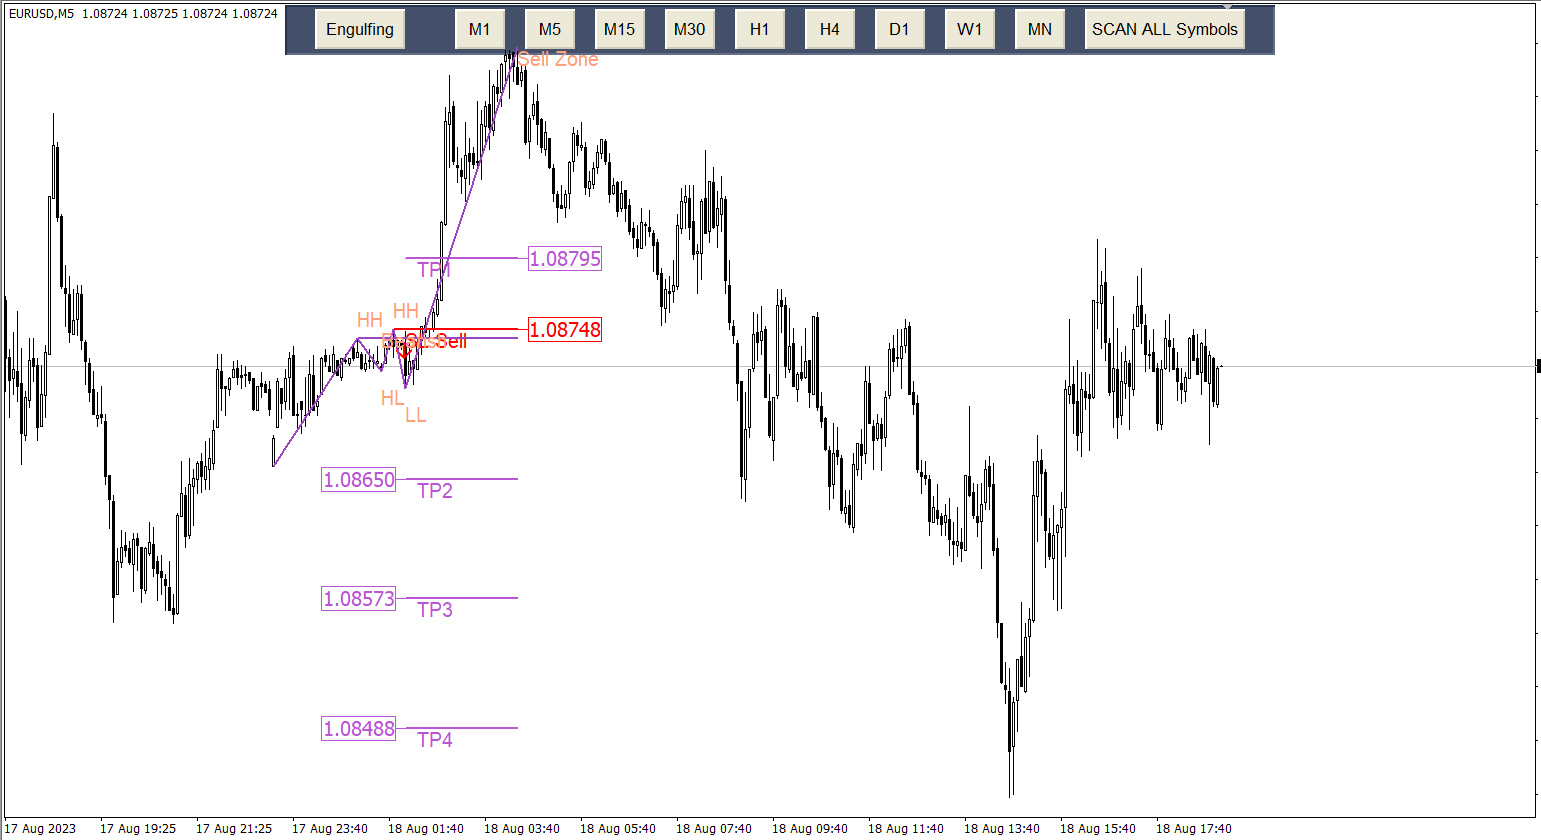
Over & Under pattern is an advanced price action trading concept in the trading industry. The Over & Under pattern is more than a confluence pattern or entry technique than a trading strategy. It is a reversal pattern that is created after a significant obvious trend. It uses to confirm the trader’s bias. If you combine this pattern with your trading strategy, it increases your trading odds & boosts your confidence level. It helps you to make better decisions on time as well. Many supply & demand traders use this pattern to identify the strong tradable zones. Over & Under pattern does not appear all the time, but when this happens, traders should not ignore it. It is one of the most reliable and powerful patterns to trade.
Main Features |
Input Parameters |
Display / Style Option
- Changing the color of the bullish and bearish Over and Under,TP and SL
- Changing line thickness
Alert Settings
- Display Alert, Enable or disable Alert
- Display Notification, Enable or disable Notification
- Send Email, Enable or disable Email


Good scanner