PnF Charts
- インディケータ
- Marcin Konieczny
- バージョン: 1.2
- アップデート済み: 18 11月 2021
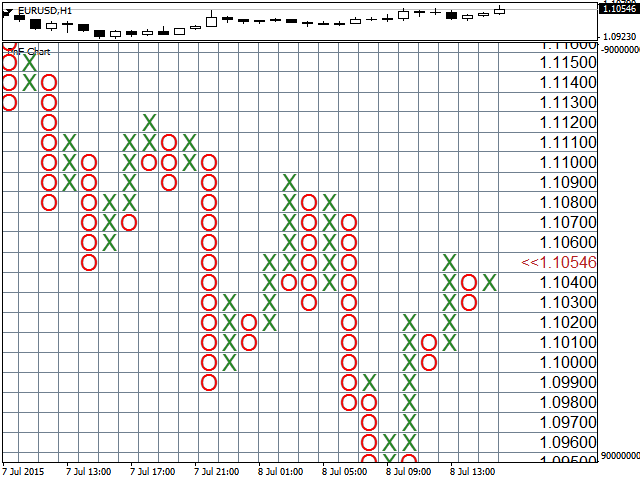
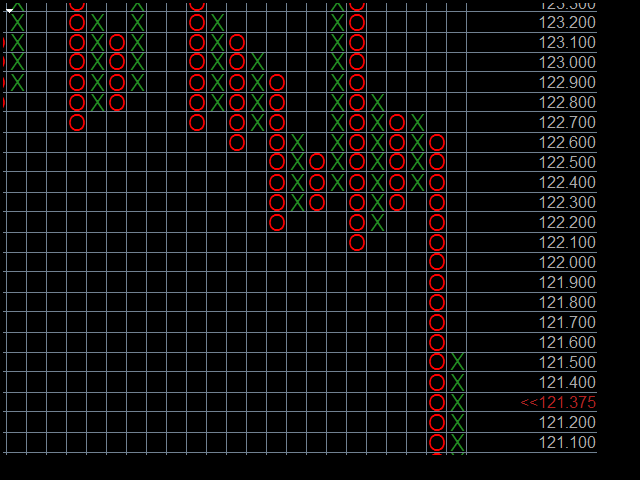
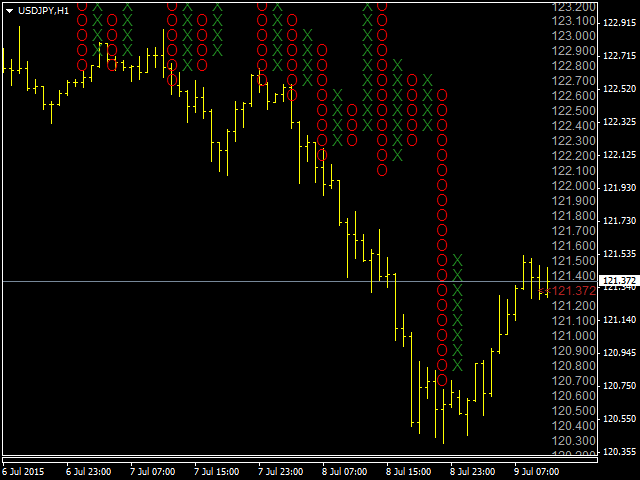
This indicator displays Point & Figure charts (PnF charts) in the indicator window. PnF charts show only price movements that are bigger than the specified box size. It helps to eliminate noise and allows focusing on main trends.
Time is not a factor here. Only price movements are taken into account. That is why PnF chart is not synchronized with the main chart it is attached to.
More about PnF charts: http://stockcharts.com/school/doku.php?id=chart_school:chart_analysis:pnf_charts
Indicator works in two modes:
- CLOSE - only close prices are taken into account while building the chart
- HIGH_LOW - only high/low prices are taken into account
The chart is updated only after closing of each bar. It means that PnF chart will be updated more frequently when attached to M1 and less frequently when attached to charts of higher timeframes.
Features:
- Reversal amount can be changed
- Two methods of drawing 1-box reversal charts (compressed and normal)
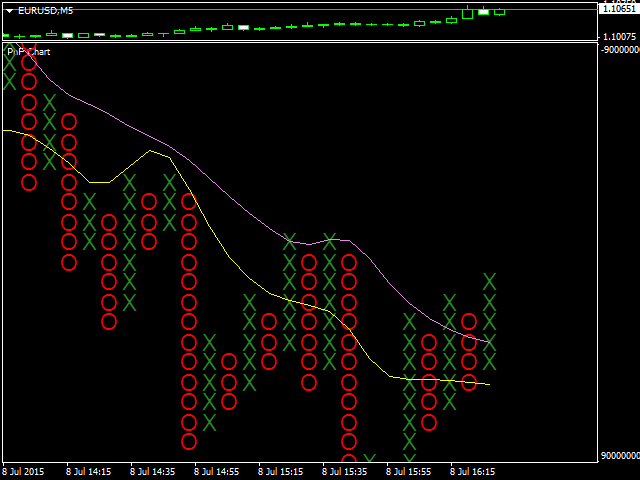
- You can add up to 2 moving averages to the chart (SMA or EMA)
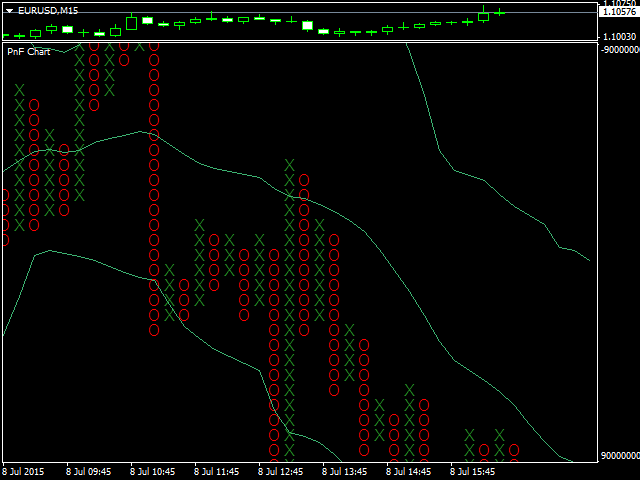
- You can add Bollinger Bands to the chart
- Colors are fully customizable
- Grid can be turned on and off
- Moving and zooming the chart with keyboard
Bollinger Bands and Moving Averages can not be used in compressed 1-box reversal mode.
Parameters:
- Price_Mode [CLOSE / HIGH_LOW] - in CLOSE mode the chart is built based on Close price of each bar while in HIGH_LOW mode the chart is built based on High and Low prices of each bar
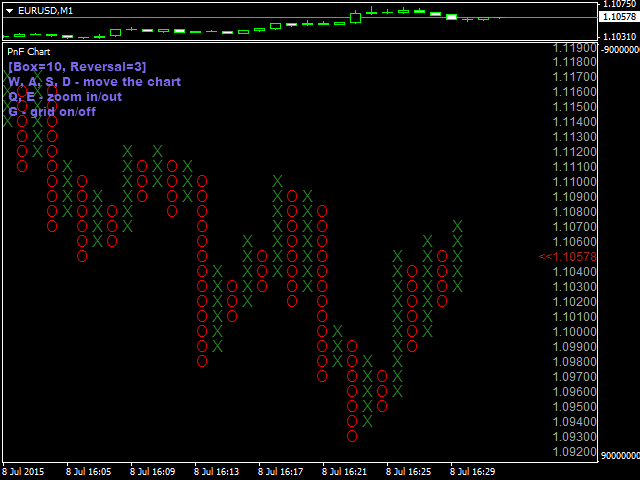
- Box_Size - minimal price movement required to draw a new box in the direction of current trend
- Reversal_Boxes - minimal counter-trend price movement required to change the trend (entered as a number of boxes, default = 3)
- Compress_1_Box_Chart - enables compressed mode of drawing 1-box reversal charts
- Max Columns - sets the maximal number of columns to display
- Scale - initial size of X's and O's
- Draw_in_Main_Window - sets the location of the PnF chart (either main chart window or indicator's subwindow)
- Draw_Grid - shows/hides the grid
- Draw_Price_Scale - shows/hides the price scale on right side of the chart
- Right_Shift - amount of empty space on the right side of the chart
- Show_Info - shows/hides information label in the upper left corner
- Draw_MA1 - adds a moving average to the chart (SMA or EMA)
- MA1_Type, MA1_Color, MA1_Period, MA1_Shift - parameters of the first moving average
- Draw_MA2 - adds a second moving average to the chart
- MA2_Type, MA2_Color, MA2_Period, MA2_Shift - parameters of the second moving average
- Draw_BB - adds Bollinger Bands to the chart
- BB_Color, BB_Period, BB_Deviations, BB_Shift - parameters of Bollinger Bands
Keys:
- W, S, A, D - moving the chart
- Q, E - zooming in/out
- G - show/hide grid


Очень хороший индикатор, совершенно по новому меняет зрение в торговле. Без него просто не могу торговать!!!!!