• 概要
  • レビュー
  • コメント
  • 最新情報

Institutional Alligator Structure

Introducing our advanced indicator, which builds upon the foundation of the renowned William's Alligator indicator—a powerful tool in technical analysis. Our enhanced indicator offers valuable insights into market trends through three distinct methods, empowering traders with comprehensive market analysis.

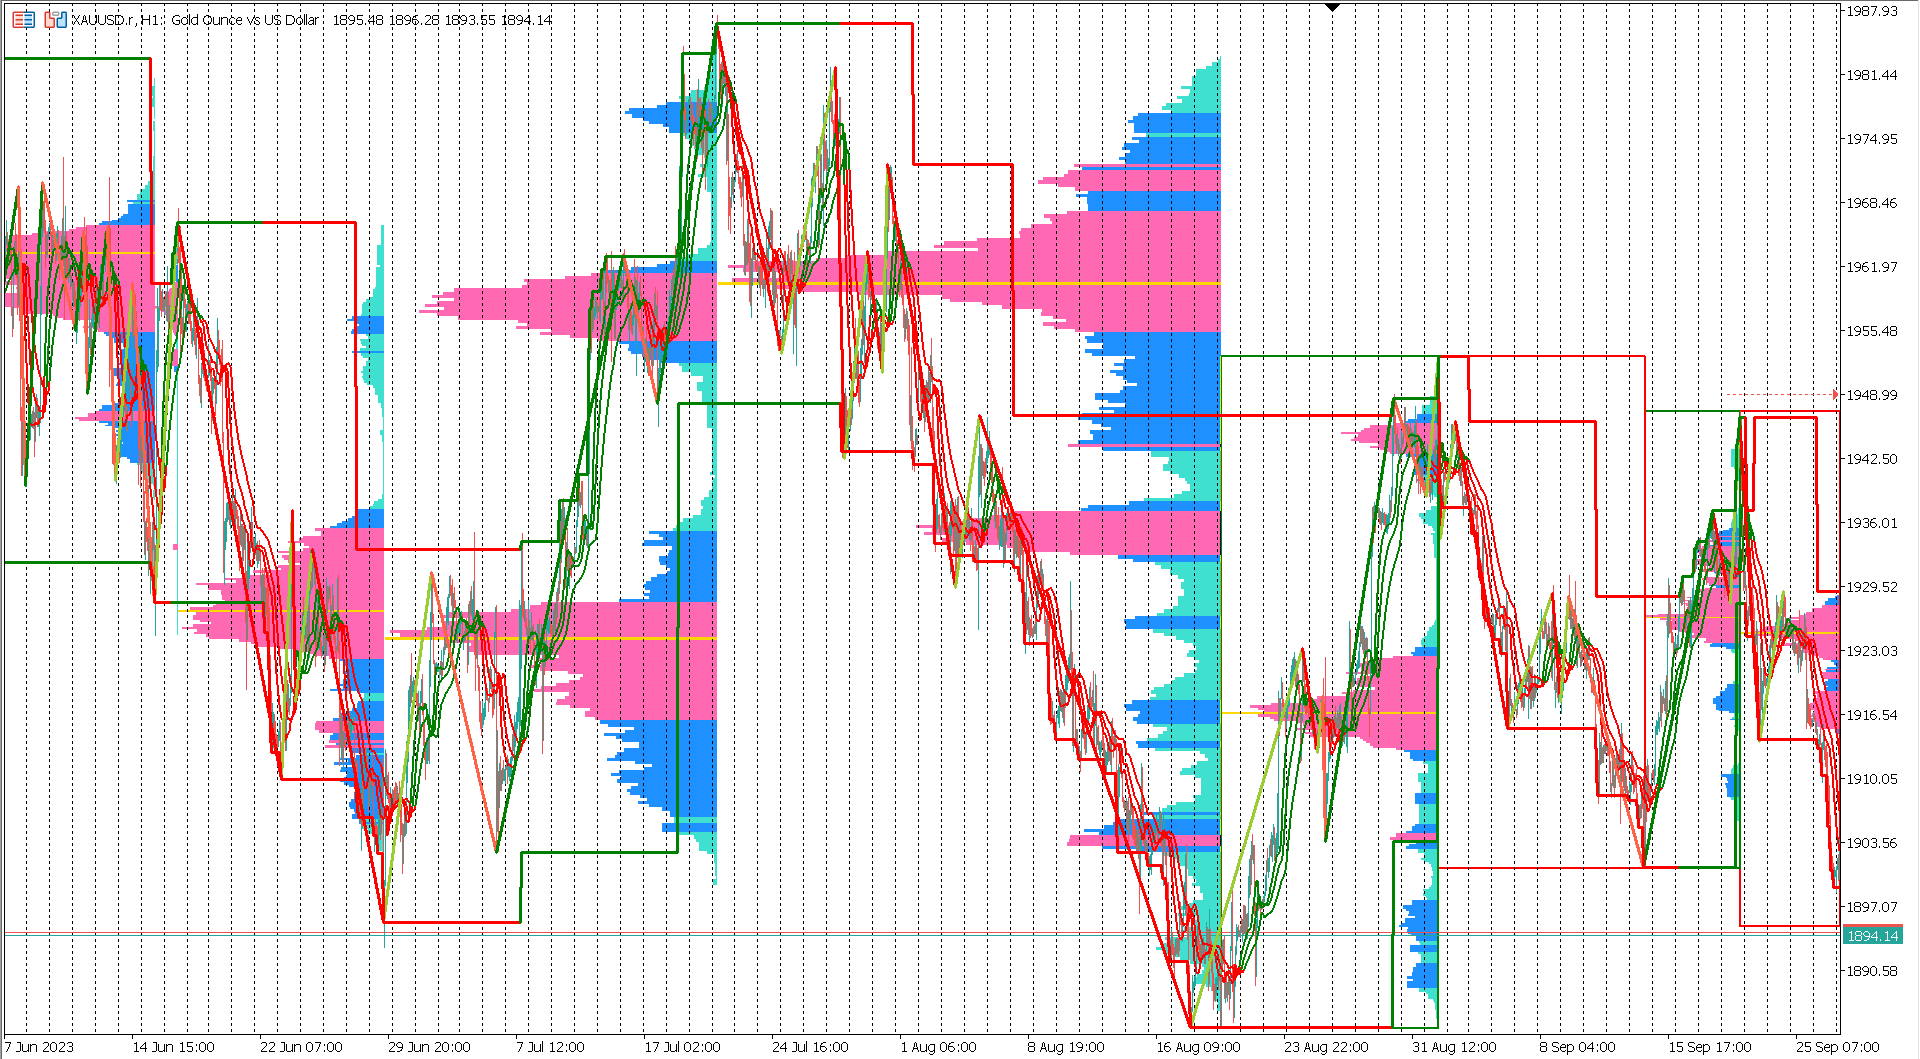
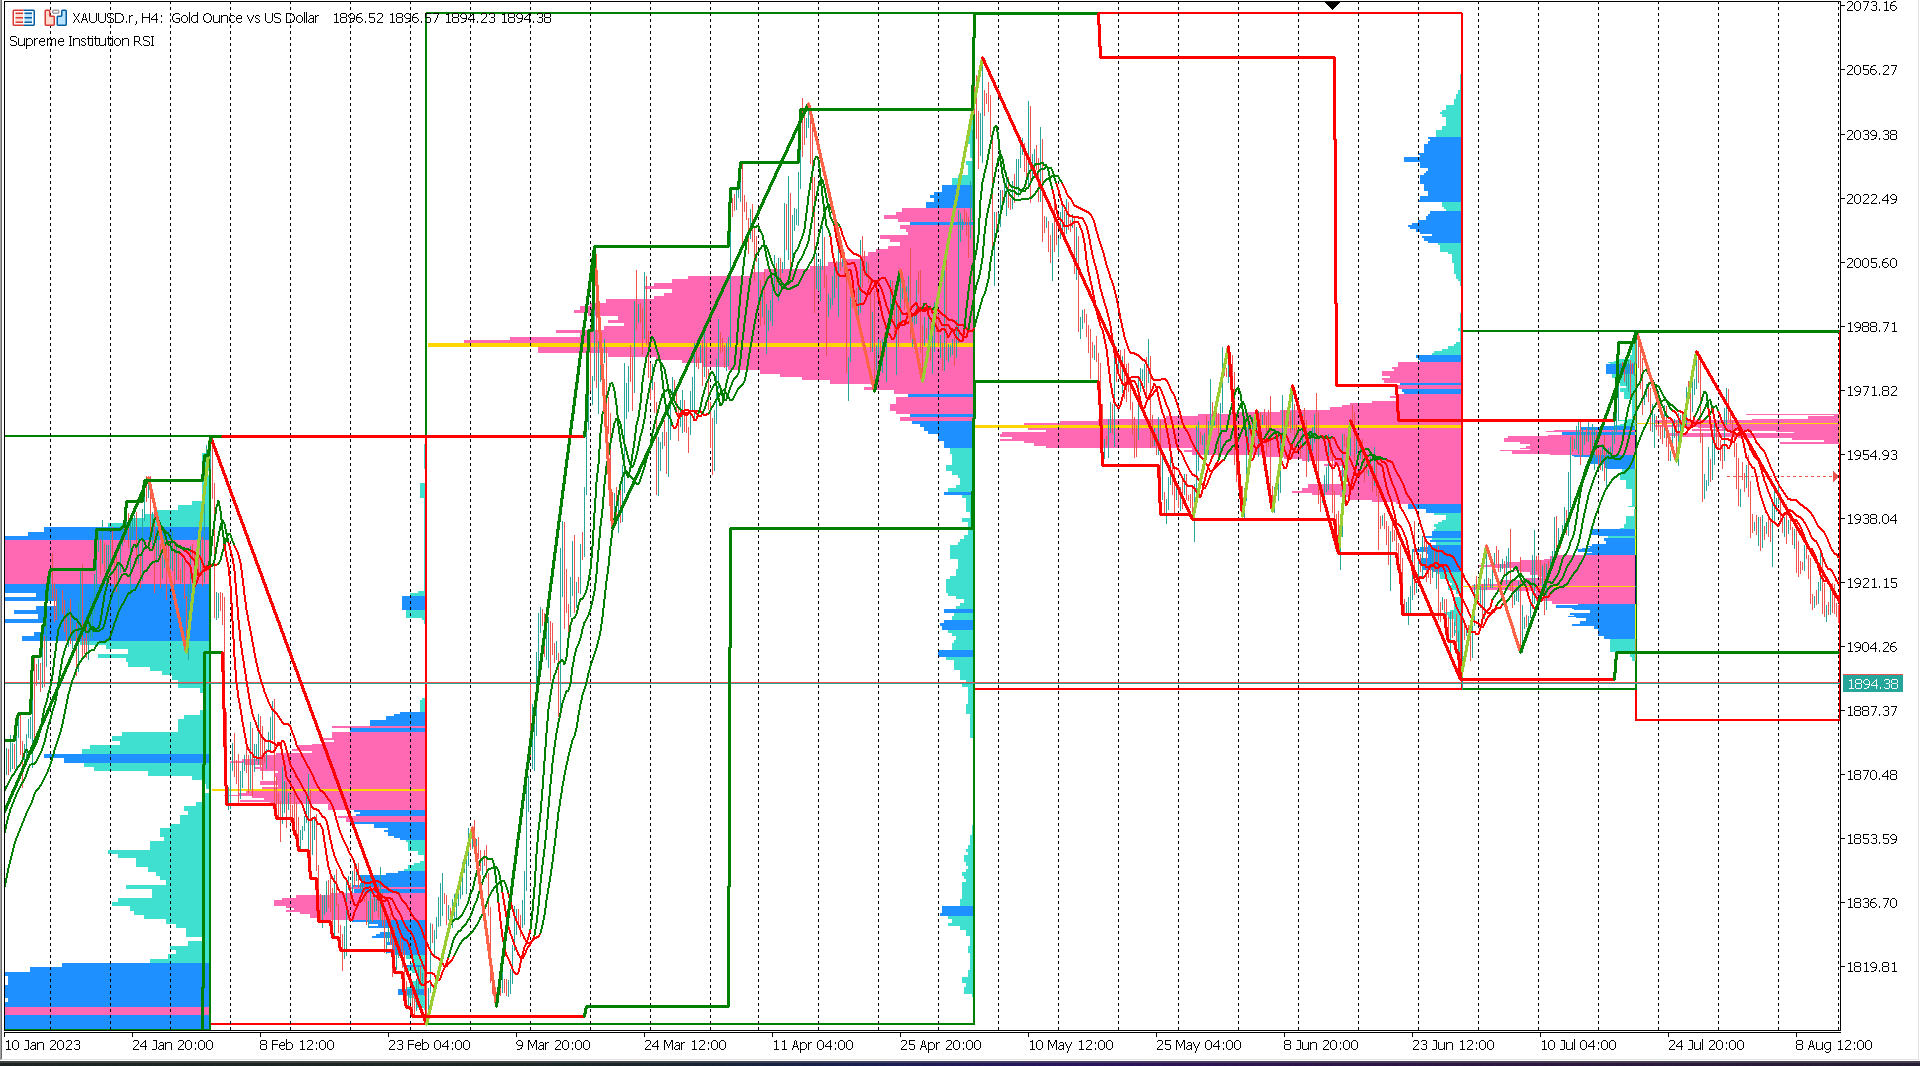
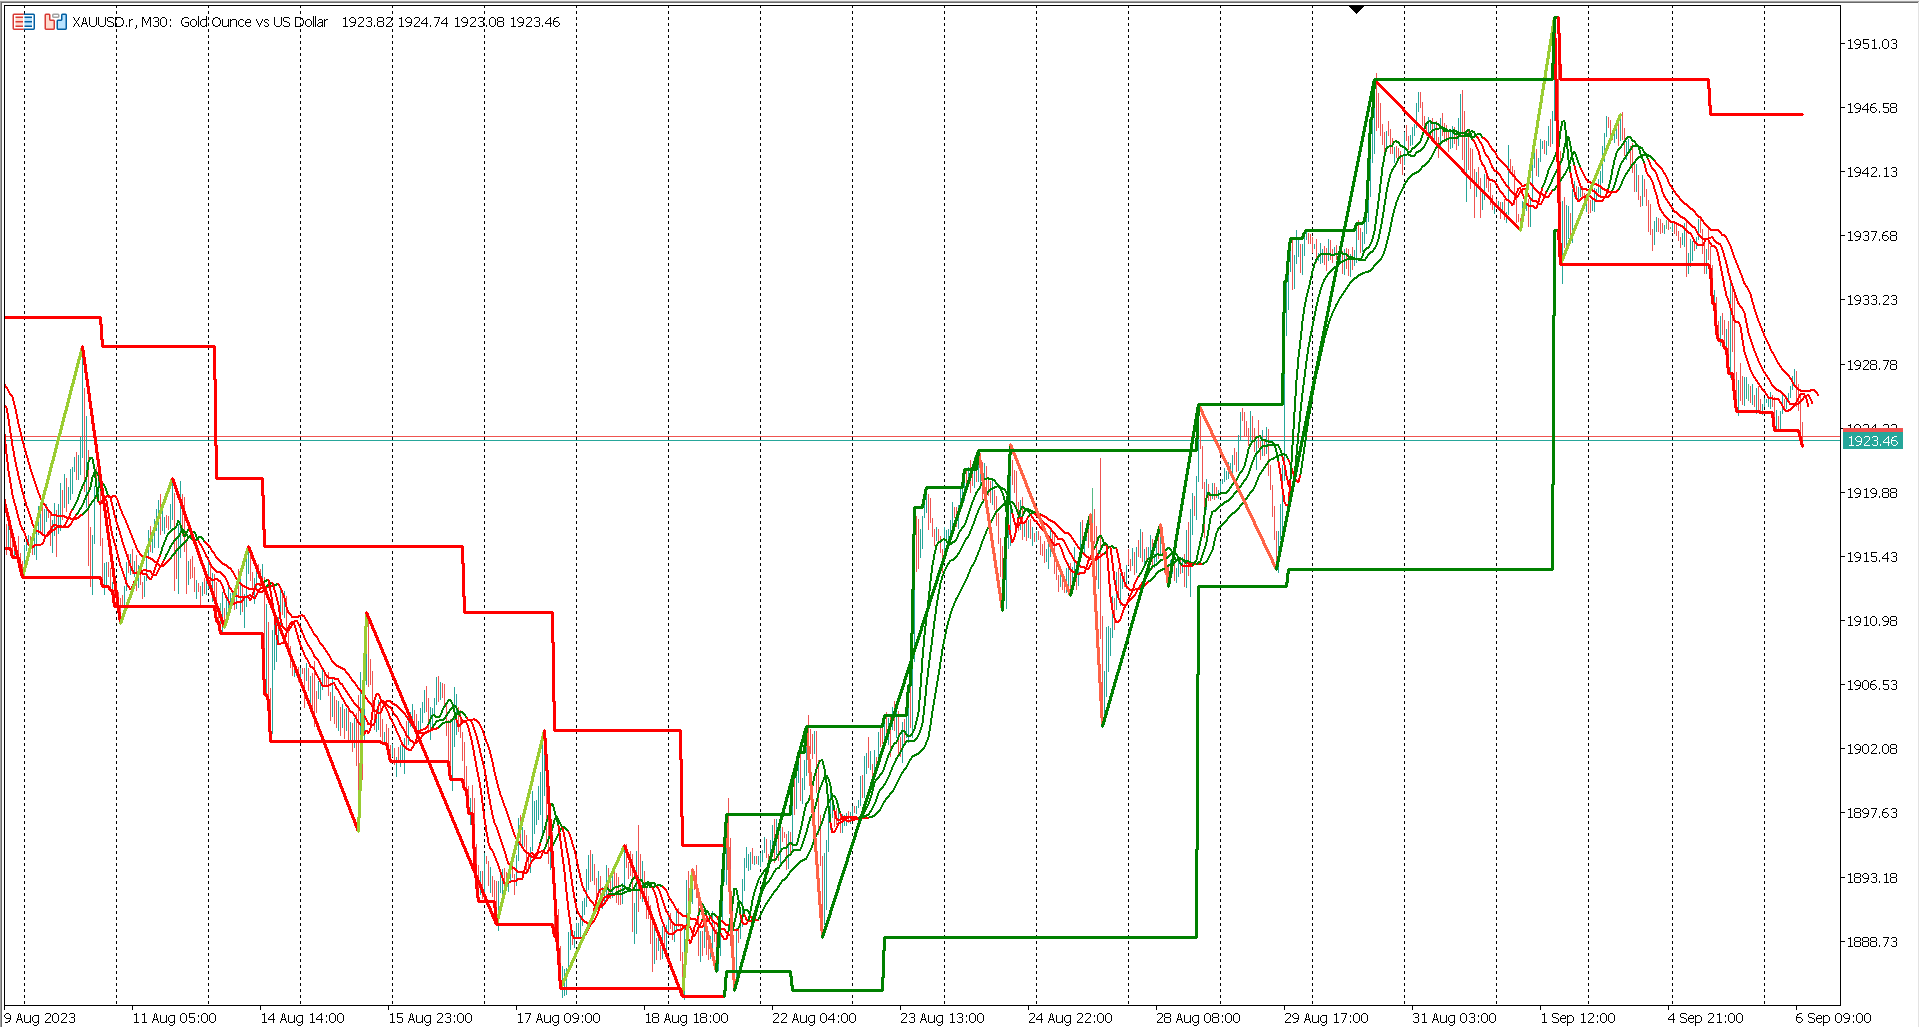
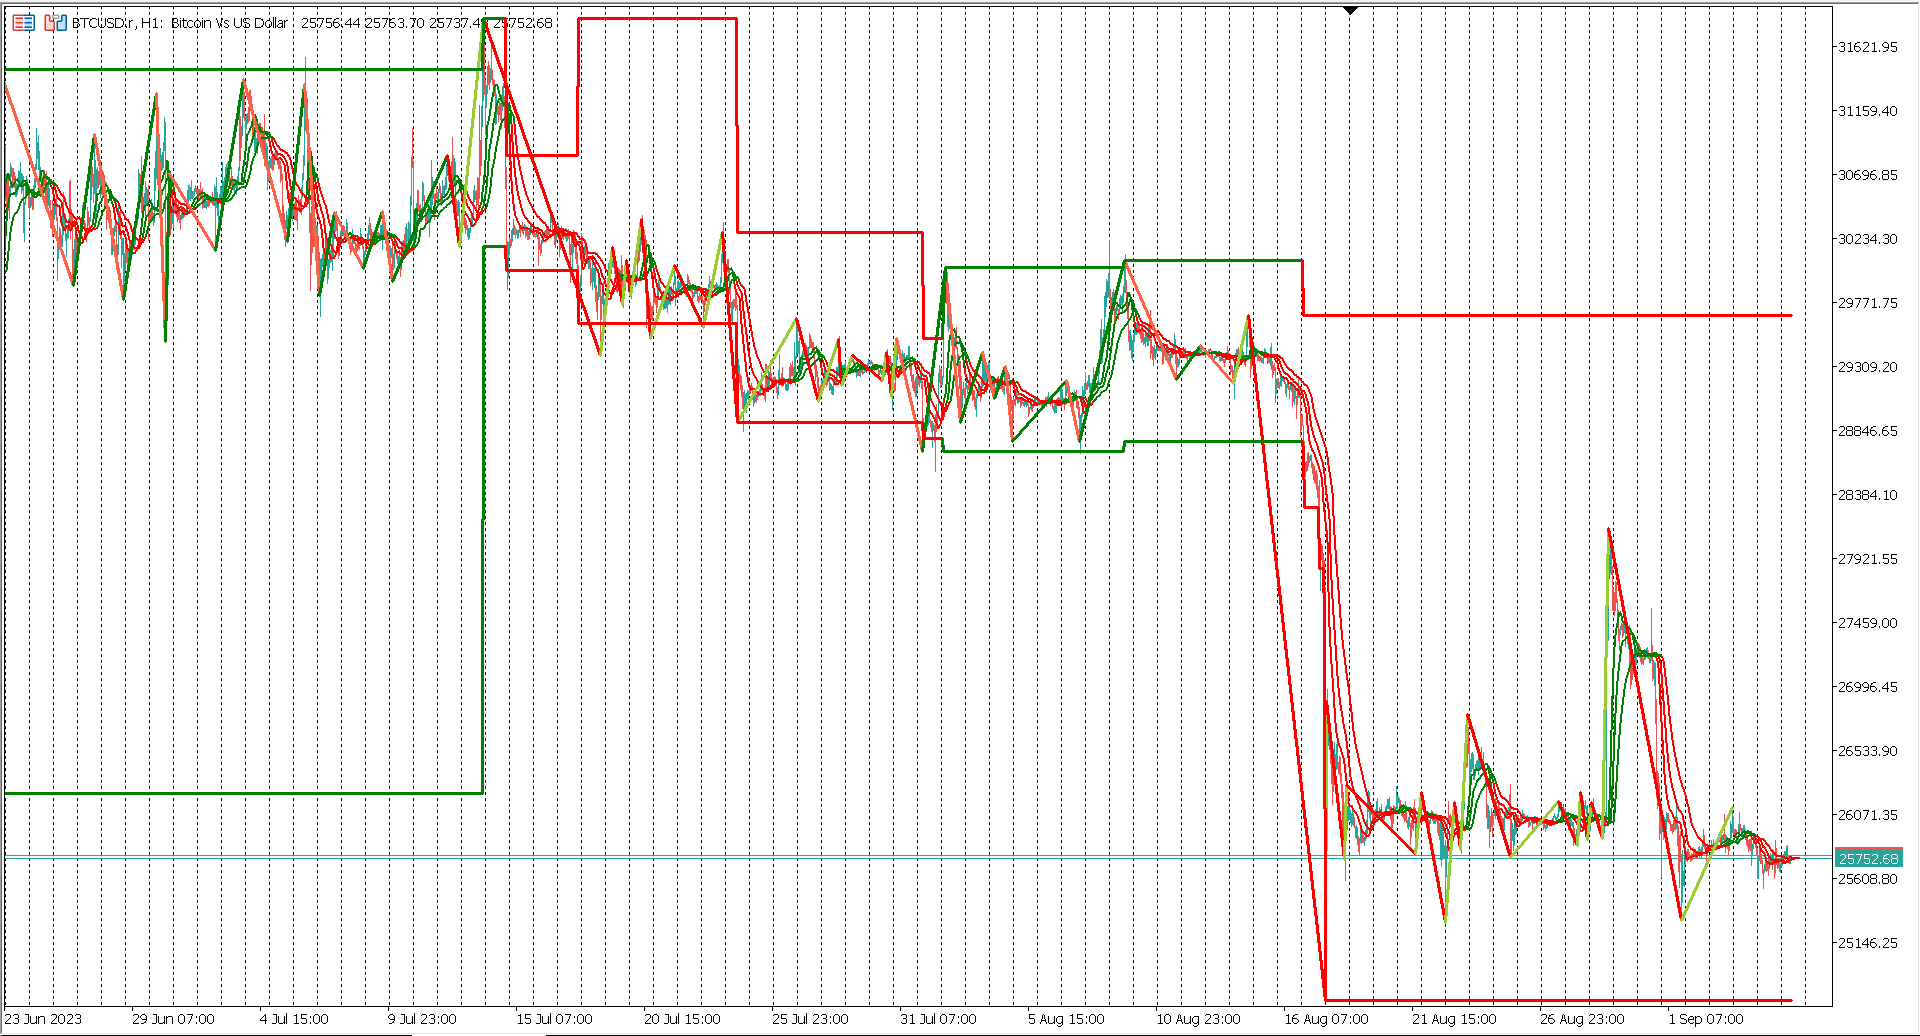
  1. Alligator Indicator Expansion: This innovative indicator harnesses the essence of the Williams Alligator by closely monitoring its three crucial components: the lips, teeth, and jaws. When these elements expand, it serves as a strong signal that the market is in a trending phase. To enhance clarity and ease of interpretation, we've introduced color-coded visual cues. A vibrant green signifies a bullish trend, while a bold red highlights a bearish trend.

  2. Internal Swing Analysis: In addition to the classic Alligator approach, we introduce an internal swing analysis. This feature dynamically plots a zigzag pattern based on the movements of the Alligator's moving averages. Each new swing reflects changes in market sentiment, offering traders a nuanced view of four distinct trends: Bearish, Bullish, Bearish Correction, and Bullish Correction. This granular insight helps traders adapt to shifting market dynamics with precision.

  3. External Swing Perspective: Our indicator takes trend analysis a step further with the external swing component. It constructs a major trend line by identifying swing highs and swing lows, creating a visual channel-like representation. This external swing line adopts a color scheme to signify market trends—green for bullish and red for bearish—offering traders an immediate grasp of overarching market sentiment.

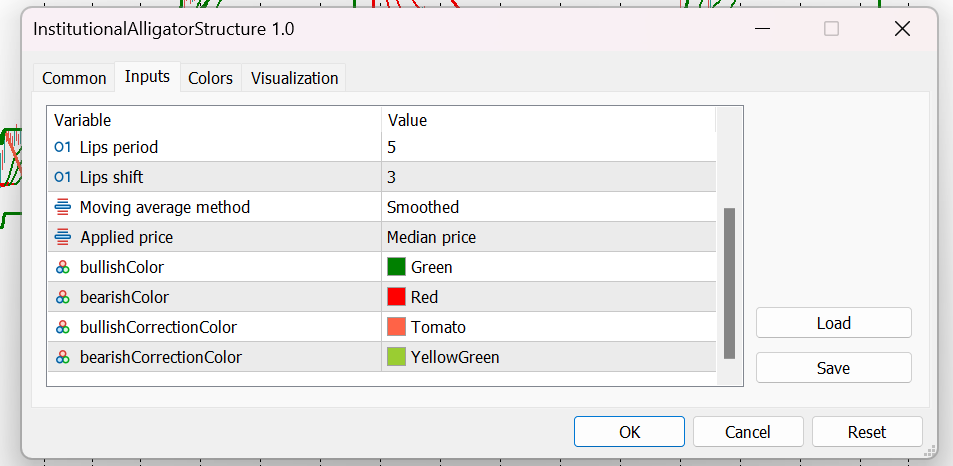
Moreover, we understand that customization is key for traders. Hence, we've included user-friendly input parameters that allow you to tailor the indicator's trend colors according to your preferences.

Elevate your trading strategy with our comprehensive indicator, designed to provide you with a holistic view of market trends, enhancing your ability to make informed trading decisions. Whether you're a seasoned trader or just starting, our indicator is a valuable addition to your toolkit, helping you navigate the complex world of financial markets with confidence.


おすすめのプロダクト
NomadAI
Tsog Erdene Borjigon Enkhkhudulmur
Introducing Nomad AI: Your Expert Navigator for the Forex Markets Nomad AI is not just another grid trading system; it's an evolutionary approach that thrives in the real-world market. Designed to tap into the market's natural flow, Nomad AI eschews the traditional retrospective fitting approach. Instead, it leverages genuine market inefficiencies, turning the unpredictable market waves to your advantage with a strategy that's as mobile and adaptable as the nomad for which it's named. 3 copy
Introducing our dynamic Swing Tunnel indicator, a powerful and straightforward tool designed to simplify market analysis while providing invaluable insights for traders. This versatile indicator relies on the interplay of two moving averages, forming a visual "tunnel" that changes color, offering clear signals for bullish and bearish market conditions. Let's delve into its features: Swing Tunnel Color Change: The heart of this indicator lies in the Swing Tunnel—a visual representation of marke
Project 1 RSI
Abdelrahman Ahmed Mahmoud Ahmed
5 (1)
Introducing Project 1 RSI, an expert advisor designed to simplify your trading experience. This powerful tool offers a user-friendly interface, making it easy to modify according to your specific trading strategies. With its lightning-fast backtesting capabilities, you can swiftly evaluate different scenarios and make informed decisions.  Whether you are a seasoned trader or just starting your journey, Project 1 RSI empowers you to make data-driven decisions with confidence. Experience the simpl
AI Heisenberg MT5
Vitali Vasilenka
3.67 (3)
AI ハイゼンベルクは、ニューラル ネットワークと特定の設計モデルに基づく自己学習をベースにした万能取引ロボットで、市場を分析して最適な取引決定を下すことができます。 追加の RSI インジケーターを使用して、価格逆転のシグナルとなる可能性のある取引を除外します。 注意!!! - 購入後、ギフトを受け取るには個人的なメッセージを書いてください: VIPチャットへのアクセス 最適な設定 もう一人のアドバイザーをプレゼント AI ハイゼンベルクには次の機能と利点があります。 自己学習: ハイゼンベルグ AI は過去の取引データから継続的に学習し、そのアルゴリズムを市場状況の変化に適応させます。 トレンド、出来高、移動平均、確率論などのさまざまな要素を考慮できます。 利食い: AI ハイゼンベルグは、損失を出してもポジションを閉じることも、所定の収益性レベルに達すると利益を上げることもできます。 これにより、長期的な一方向の値動きの中でも安定した利益を得ることができます。 ストップロス: AI ハイゼンベルクは、一定の収益性レベルに達したときに勝つか利益を上げた場合、ポジションを閉じるこ
Tired of information overload when analyzing forex currency strength? Introducing "All Currency Strength Live", the ultimate dashboard indicator for MetaTrader 5 that simplifies your trading life. This innovative tool provides a clear, concise overview of the strength of all major currencies, empowering you to make informed trading decisions with ease. With "All Currency Strength Live,"  you gain access to real-time insights into both price and volume strength across all major currencies. No mor
IX Powerは 、FX Powerの無敵の精度をついにFX以外のシンボルにも提供します。 お気に入りの指数、株式、コモディティ、ETF、さらには暗号通貨の短期、中期、長期のトレンドの強さを正確に判断します。 お使いの端末が提供する すべてを分析する ことができます。ぜひお試しいただき、取引 タイミングが大幅に改善 されることをご体験ください。 IXパワーの主な特徴 100%正確で再描画されない計算結果 - ターミナルで利用可能なすべての取引シンボルに対して 予め設定され、さらに個別に設定可能な強度分析期間のドロップダウン選択 Eメール、メッセージ、モバイル通知による無数の通知オプション EAリクエストのためのアクセス可能なバッファ カスタマイズ可能な計算制限により、さらに優れたパフォーマンスを実現 もっと見たい人のための特別なマルチインスタンス設定 すべてのチャートでお好みの色を無限に設定可能 Windows 11とmacOSのスタイルで角を丸くした新しいパネルデザイン サブ・ウィンドウとメイン・チャートの間をシームレスに移動する、魔法のように動くイン
Element is a Forex arrow indicator that implements a kind of technical analysis based on the idea that the market is cyclical in nature. Follows the market trend with good reliability, ignoring sharp market fluctuations and noise around the average price. Thus, all intersection points will be optimal points at which the movement changes taking into account the indicator period. It catches the trend and shows favorable moments of entering the market with arrows. Displays signals simply and clear
MultiPair
ООО 'Уралтранзит'
3.75 (4)
Треугольным арбитражем называют одновременно открытие ордеров по трем валютным парам. Направление сделок и пары выбираются таким образом, чтобы одновременно открытые позиции страховали друг друга. За счет этого можно открываться достаточно большими лотами, и риск невелик. Варианты треугольников: EURUSD – USDJPY – EURJPY Ордера, входящие в состав такого треугольника находятся в постоянном движении. Советник анализирует реальные цены на данный момент и просчитывает какими они должны быть. При ра
FREE
Knowledge of the strength and weakness of each currency is vital for every forex trader. Our   Currency Strength Meter indicator   measures the strength of eight major currencies (USD, EUR, GBP, CHF, JPY, CAD, AUD, NZD) by using the Relative Strength Index indicator, also known as RSI. The Currency Strength Meter indicator shows you, simply and quickly, when a currency is oversold, overbought, or in "normal area". This way, you can identify which currency is the strongest and the weakest. Our
Trade system "PAX Multi TMA/HMA 8" for MT5 It is a ready-made trading system for trading on any instrument and any timeframe. Completely ready for manual trading and use in robots. Not redrawn signals ( See the picture ) It is convenient to work on any timeframe. Tested on metals, currency pairs, oil, international stocks, Russian stocks, cryptocurrencies, monetary and cryptocurrency indices. What the trading system consists of: 1. The main channel of price movement named Medi
Ichimoku Tecnic
Ignacio Agustin Mene Franco
Ichimoku technic . is a candlestick indicator, which captures bullish and bearish trends according to its sail color! where there are breaks, it also captures with candle colors, The 2 most important colors to hunt trends are red and aqua, where clearly by color it tells you when it goes up or down, Serve for all seasons! It works for the forex markets and synthetic indices, also crypto! World Investor. Good profit!
QuantNas100
Thiago Levi Azevedo Valente
Start the Year 2024 in the perfect way by taking advantage of the Quantitative EA that performed wonderful results in previous years (including 2023) on the NASDAQ Index (NAS100)! It is not a high frequency EA. There are few operations. But they are very precise operations, where the EA analyzes the previous price/volume to understand the current movement and moment. Monthly TP/SL Video = 10% https://www.youtube.com/watch?v=dwgEMMEIIPc Monthly TP/SL Video = 20% https://www.youtube.com/watch?
The Signal Sunrise channel indicator automatically builds a trend movement support channel. The price is in its trend movement in a certain range, and not a chaotic spread of the price is unclear in which direction. And if the price deviates within a certain range, then this means that the boundaries of these ranges are support and resistance lines and form a channel. It is no secret that the wave theory, like many others, is based on observations, however, one of the most important patterns
RecurseAI MT5     人工ニューラルネットワークのアンサンブルに基づく完全自動システム。トレーニングロジックは再帰的な戦略に基づいていました。古いタイムチャートの動きは若いチャートに依存し、その逆も同様です。 システムの特徴       RecurseAI MT5     取引を長期間保持せずに最適な時点で取引を終了し、現在の市場から安全に利益を集め、取引が長くて大きなドローダウンに陥ることを防ぐことです。著者の設定を備えたボリンジャーバンドインジケーターは、取引を開始する責任があります。 RecurseAI MT5     大規模なドローダウンや取引の長期保有について心配したくない人に最適です。設定は初心者でもシンプルでわかりやすいです。また、コメントには、各ペアのファイルのセットがあります。 RecurseAI MT5             StopLossとTakeProfitが組み込まれています。市場では常に1つの取引のみが開かれています。     マルチンゲール、ヘッジ、アービトラージは使用されません。 ストック! 99ドルの最初の10バージョン-急いで入手
Space X  it is a Secure Automated Software for trade Forex market and indices. The architecture is a Fully Automatic Autonomous Robot Expert capable of independently analyzing the market and making trading decisions Space X It is an advanced and professional trading system. This is a FULL configurable system.     Space X     is a professional system, Ready to personalized your profile.                            You can download the demo and test it yourself.                        Space X
Benefits: A new and innovative way of looking across multiple timeframes and multiple indicators on any chart. Provides instant multi-timeframe analysis of any market. i.e. forex currency pairs, cryptocurrency pairs, commodities, etc. It offers precise indications across multiple timeframes of volatility as measured by RSI, ADX and STOCH within one chart. Helps you determine high probability trading setups. See example strategy in comments. Can see bullish/bearish volatility building across mult
インジケータMTFクリスタリウム矢印は、半自動取引システムであります. これは、すべての通貨ペアで動作します。  インジケータは、三つのルールを使用しています:1)我々は唯一のトレンドで取引、2)"誰もが販売しているときに購入し、誰もが買うときに販売する"、3)価格  インジケータMTF矢印は、内蔵の指標を使用して、複数の時間枠全体のクリスタリウムフィルタルール。 トレンドは、選択した時間間隔で一致した場合、インジケータは、市場に参入するための矢印を与えます。 それからあなた自身の決定をする。 購入する-緑の矢印、売る-赤い矢印。 指標では、ロットを変更したり、EAの取引時間とシャットダウン時間を設定することができます。 また、作業期間と時間フィルタを変更することができます。 ビープ音が鳴ってる  推薦された働く期間D1。 フィルタH1とH4。  設定: TF働く期間(推薦されたD1) Cci_cperiodcomment CCIレベルアップ CCIレベルDn CCI価格 SARステップ SAR最大値 TFのFilter1–(推薦されたH1)
The strategy which is applied in finance market all around the world is known as CTA strategy. A successful CTA always includes multi-strategies, multi-instruments and multi-timeframe. The series of Multi Instruments TrendSystem (MITS) provide a profitable strategy which can be used in different instruments with different timeframe. Multi Instruments TrendSystem 3 BS  MT5 (Blood Sword)  is a fully automated multi-instrument Expert Advisor. This EA is one of our trend strategies EA, it can be u
Go Ferramentas
Fabio Oliveira Magalhaes
This product is a set of tools that help the trader to make decisions, bringing information from different categories that complement each other: trend, support / resistance and candle patterns. It also has a panel with information about the balance. The trend has two different calculations and is shown as colored candles. Strategy 1 is longer, having 3 different states: up, down and neutral trend. Strategy 2 has a faster response and has only 2 states: up and down trend. Support and resistance
Niubility Trend  Niubility Trend  displays the trend direction for all time frames in real time. You'll see at a glance at which direction the trends are running, how long they last and how powerful they are. All this makes it an easy-to-use trend trading system for beginners, advanced and professional traders. Features Easy to trade Customizable colors and sizes It is non-repainting and non-backpainting It is fantastic as a trailing stop method It implements alerts of all kinds
MACD Scanner provides the multi symbols and multi-timeframes of MACD signals. It is useful for trader to find the trading idea quickly and easily. User-friendly, visually clean, colorful, and readable. Dynamic dashboard display that can be adjusted thru the external input settings. Total Timeframes and Total symbols as well as the desired total rows/panel, so it can maximize the efficiency of using the chart space. The Highlight Stars on the certain matrix boxes line based on the selected Scan M
The Netsrac Correlation Trade Indicator (NCTI) was created to trade correlations between different assets. NCTI offers five different strategies to do this. Five different correlation trading strategies with two or three assets Fast access your assets with one click via asset buttons Your profit/loss at a glance Configurable alerts via screen or mobile You can use the indicator with every timeframe. Higher timeframes give fewer but better signals. If you have some questions or suggestions - pl
Attention!!! Do not try to test the EA in the MT4 Tester, it is simply impossible, because the EA opens positions on 27 different instruments and 8 timeframe . The tester is able to test only one pair. Multi-currency tester is possible only in MT5. Instructions for launching a multi-currency tester in MT5:  https://youtu.be/WrQQwMQclrY How EA works: 1. The main strategy for the breakdown of local extremes is used. 2. An additional algorithm is used to control losing trades and redistribute loss
In finance, a moving average (MA) is a stock indicator that is commonly used in   technical analysis . The reason for calculating the moving average of a stock is to help smooth out the price data by creating a constantly updated   average price . This Indicator determines the current time frame and calculates 3 moving averages from the next 3 available time frames. You can put this indicator on M1, M5, M15, M30, H1 and H4 TF. Blue and Magenta Arrows show the moment to go Long or Short accordi
Xtrade Trend Detector is an indicator capable of finding the best opportunities to take a position in any stock market. Indeed, it is a great tool for scalpers but also for Daytraders. You could therefore use it to identify areas to trade, it fits easily on a chart. I use it to detect trends on Big timeframes and take positions on Small timeframes. Don't hesitate to give me a feedback if you test it.
Automated Report Generator for the Spanish Treasury. Modelo 720. This utility allows you to generate a panel report with the information necessary to fill out the Spanish tax form 720 form. You just have to load this utility on any graph and timeframe, once the report and panel have been generated, the EA will close automatically. This includes: Current account balance in the reference currency Calculated balance as of December 31, 2023 in the reference currency Total movements between Oc
UT Bot Simple
Bartlomiej Tadeusz Tomaja
**Features:** 1. **Innovative Trend Tracking:** The UT BOT Simple Indicator leverages the power of the Average True Range (ATR), a renowned volatility measure, to calculate precise trailing stop values, providing unparalleled insights into market trends. 2. **Customizable Settings:** Flexibility is paramount in any trading strategy. With this in mind, our indicator allows you to adjust the ATR periods and other key parameters to tailor the tool to your trading style and strategy. 3. **Rea
Kapitaltrader
Erick Gabriel Palma Montufar
The price is 450$ for next 10 buyers (Remaining copy :10) Next price: 600$ KAPITAL SECURE EA    : I s a fully automated "arbitrage" trading system, which is especially effective in trading popular currency pairs, it uses 11 pairs at the same time: EURCHF, GBPNZD, AUDNZD, NZDUSD, NZDJPY, GBPAUD, EURCAD, EURUSD, EURJPY. In order to pass the MQL4 tests, we have modified the settings, you just need to download our profitable settings that we use on LIVE accounts. LIVE Signals: Capital #1  50K € Cap
注意事項 EAには最大6つのエントリーポイントが含まれ、各取引のロット数は注文ロット数に6を乗じたものとなるため、ロット数が大き過ぎないようご注意ください。 ロット数のデフォルトの計算方法は資金のパーセンテージではありません。デフォルトの計算方法はレバレッジの影響を受けないため、リスクをより正確に管理できます。  リスク耐性を高めるために、1,000ドル以上の資金のご利用をお勧めします。 複数の通貨ペアを同時に使用するとリスクが蓄積される可能性があるためご注意ください。 こちらはMT5バージョンです。MT5バージョンは市場環境をより正確に再現できます。 MT4バージョンが必要な場合は、後日リリースいたします。 取引にはリスクが伴うため、こうしたリスクを理解し効果的に管理することが非常に重要です。 リアルマネーシグナル: クリックして表示 ライブシグナル: クリックして表示 MT4バージョン: MT4へ移動 EAはまもなく価格を上げる予定です。興味があれば、お早めにご購入ください。 実行の推奨事項 推奨通貨ペア:GBPUSD、USDCAD、AUDUSD、EURUSD、USDC
Gold Chaser
Evgeniy Scherbina
5 (1)
The "Gold Chaser" expert advisor trades in fully automated mode these 4 symbols: XAUUSD (Gold), XAGUSD (Silver), BTCUSD (Bitcoin), and XBRUSD (Brent Oil). I am going to add other cryptocurrencies and/or stock exhange indices in the near future. Possibilities of the "non-major" symbols really differ from what you are accustomed to with the usual set of symbols. First of all, gold moves very quickly. Like major symbols, gold reacts to political events, important economic events and speeches of VIP
このプロダクトを購入した人は以下も購入しています
まず第一に、このトレーディングシステムがノンリペイント、ノンリドロー、ノンラグのインジケーターであることを強調する価値がある。これにより、手動取引とロボット取引の両方に理想的なものになっています。 「スマートトレンドトレーディングシステム MT5」は、新規および経験豊富なトレーダー向けにカスタマイズされた包括的なトレーディングソリューションです。10以上のプレミアムインジケーターを組み合わせ、7つ以上の堅実なトレーディング戦略を備えており、多様な市場状況に対応する多目的な選択肢となっています。 トレンドフォロー戦略:トレンドを効果的に乗り越えるための正確なエントリーとストップロス管理を提供します。 リバーサル戦略:潜在的なトレンドの反転を特定し、トレーダーがレンジ相場を活用できるようにします。 スキャルピング戦略:高速で正確なデイトレードおよび短期取引のために設計されています。 安定性:すべてのインジケーターはノンリペイント、ノンリドロー、ノンラグであり、信頼性の高いシグナルを保証します。 カスタマイズ:個々の取引の嗜好に合わせたカスタム戦略をサポートします。7つ以上の戦略と組み合わせ
まず第一に、この取引インジケーターは再描画されず、再描画されず、遅延しないことを強調する価値があります。これにより、手動取引とロボット取引の両方に理想的なものになります。 アトミックアナリストは、価格の強さとモメンタムを利用して市場でより良いエッジを見つけるためのPA価格アクションインジケーターです。ノイズや誤ったシグナルを除去し、取引ポテンシャルを高めるための高度なフィルターを備えています。複雑なインジケーターの複数のレイヤーを使用して、アトミックアナリストはチャートをスキャンし、複雑な数学的計算をシンプルなシグナルと色に変換します。これにより、どのような初心者トレーダーでも理解して使用し、一貫した取引の決定を行うことができます。 「アトミックアナリスト」は、新規および経験豊富なトレーダー向けにカスタマイズされた包括的な取引ソリューションです。プレミアムインジケーターとトップノッチの機能を1つの取引戦略に組み合わせ、すべてのタイプのトレーダーにとって汎用性のある選択肢にします。 デイリートレーディングとスキャルピング戦略:高速で正確なデイトレーディングおよび短期トレード
FX Volume MT5
Daniel Stein
4.94 (17)
mql5と Telegramの モーニング・ブリーフィングで、詳細とスクリーンショットを含む毎日のマーケット・アップデートをご覧 ください! FX Volumeは、ブローカーの視点から市場のセンチメントをリアルに洞察する、最初で唯一の出来高インジケーターです。 ブローカーのような機関投資家が外国為替市場でどのようなポジションをとっているか、COTレポートよりもはるかに速く、素晴らしい洞察を提供します。 この情報をチャート上で直接見ることは、あなたの取引にとって真のゲームチェンジャーであり、画期的なソリューションです。 以下のようなユニークなマーケットデータ洞察から利益を得てください。 比率は 、通貨のロングポジションとショートポジションの比率をパーセントで表示します。 比率の変化は 、選択した期間内のロング比率とその変化率を表示します。 Volumes Totalは 、通貨の取引量(ロングとショート)の合計をロット単位で表示します。 Volumes Long :全通貨のロングポジションの取引量を表示します。 Volumes(ショート )は、全通貨のショートポジションの取引量を表示
ご紹介   クォンタム トレンド スナイパー インジケーターは 、トレンド反転を特定して取引する方法を変革する画期的な MQL5 インジケーターです。 13年以上の取引経験を持つ経験豊富なトレーダーのチームによって開発されました。     クォンタムトレンドスナイパーインジケーター   は、非常に高い精度でトレンドの反転を識別する革新的な方法で、あなたのトレーディングの旅を新たな高みに押し上げるように設計されています。 ***Quantum Trend Sniper Indicatorを購入すると、Quantum Breakout Indicatorを無料で入手できます!*** クォンタム ブレイクアウト インジケーターは、トレンドの反転を特定するとアラートを発し、矢印を示し、3 つのテイクプロフィットレベルを提案します。 初心者トレーダーにもプロのトレーダーにも適しています。 量子EAチャネル:       ここをクリック MT4のバージョン:       ここをクリック 推奨事項: 期間:すべての時間枠。最良の結果を得るには、M
mql5と Telegramの モーニング・ブリーフィングで、詳細とスクリーンショットを含む毎日のマーケット・アップデートをご覧 ください! FX Power MT5 NGは 、長年の人気を誇る通貨強度計FX Powerの次世代モデルです。 この次世代ストレングスメーターは何を提供するのでしょうか?初代FXパワーの魅力すべて プラス GOLD/XAUの強さ分析 より正確な計算結果 個別に設定可能な分析期間 カスタマイズ可能な計算上限値により、さらに優れたパフォーマンスを実現 もっと見たい人のための特別なマルチインスタンス設定 すべてのチャートでお好みの色を無限に設定可能 数え切れないほどの通知オプションにより、重要なことを見逃すことはありません。 Windows 11とmacOSのスタイルで角を丸くした新しいデザイン 魔法のように動くインジケーターパネル FXパワーの主な機能 すべての主要通貨の強さの完全な履歴 すべての時間枠における通貨の強さの履歴 すべてのブローカーとチャートで同一の計算結果 100%信頼できるリアルタイム計算 -> リペイントなし ドロップダウン・リストから
これはMT5のインジケーターで、再描画なしで取引に参入するための正確なシグナルを提供します。 外国為替、暗号通貨、金属、株式、インデックスなど、あらゆる金融資産に適用できます。かなり正確な見積もりを提供し、取引を開始して終了するのに最適な時期を教えてくれます。1つのシグナルを処理しただけでインジケーターの元が取れた例の 動画 (6:22)をご覧ください。Entry PointsPro インジケーターの助けを借りたほとんどのトレーダーの最初の1週間の結果が改善しています。 Telegramグループ に登録してください。Entry Points Proインジケーターのメリットは次の通りです。 再描画のないエントリーシグナル 再描画されるインジケーターでは一度表示されたシグナルが削除されて大きな金銭的損失につながることがありますが、これと異なり、表示されて確認されたシグナルは消えることがありません。 エラーなしの取引開始 インジケーターアルゴリズムによって取引を開始する(資産を売買する)理想的な瞬間を見つけることができます。それを使用するすべてのトレーダーの成功率が向上します。
今、147ドル(いくつかの更新後に499ドルに増加します) - 無制限のアカウント(PCSまたはMac) RelicusRoad ユーザー マニュアル + トレーニング ビデオ + プライベート Discord グループへのアクセス + VIP ステータス 市場の新しい見方 RelicusRoad は、外国為替、先物、暗号通貨、株式、および指数の世界で最も強力な取引インジケーターであり、トレーダーに収益を維持するために必要なすべての情報とツールを提供します。初心者から上級者まで、すべてのトレーダーが成功するためのテクニカル分析と取引計画を提供します。これは、将来の市場を予測するのに十分な情報を提供する重要な取引指標です。意味をなさないチャート上のいくつかの異なる指標ではなく、完全な解決策を信じています.これは、信号、矢印 + 価格アクション情報を表示するオールインワンのインジケーターで、他に類を見ない非常に正確です。 強力な AI に基づいて、RelicusRoad は不足している情報とツールを提供して、あなたを教育し、トレーディングのプロ、成功したトレーダーにします。
Step into the realm of Forex trading with confidence and precision using XQ, a cutting-edge Forex indicator designed to elevate your trading game to unprecedented heights. Whether you're a seasoned trader or just stepping into the world of currency exchange, XQ Forex Indicator empowers you with the insights and signals needed to make informed trading decisions. The signal conditions are a combination of three indicators, and XQ Forex Indicator only display  medium and long-term trends . The ind
Was: $299  Now: $99   Supply Demand uses previous price action to identify potential imbalances between buyers and sellers. The key is to identify the better odds zones, not just the untouched ones. Blahtech Supply Demand indicator delivers functionality previously unavailable on any trading platform. This 4-in-1 indicator not only highlights the higher probability zones using a multi-criteria strength engine, but also combines it with multi-timeframe trend analysis, previously confirmed swings
現在33%オフ 初心者にもエキスパートトレーダーにも最適なソリューション このインジケーターは独自の機能と新しい公式を多数内蔵しており、ユニークで高品質かつ手頃な取引ツールです。このアップデートでは、2つの時間枠ゾーンを表示できるようになります。より長いTFだけでなく、チャートTFとより長いTF(ネストゾーンを表示)の両方を表示できます。すべてのSupply Demandトレーダーの皆さんのお気に召すはずです。:) 重要情報の公開 Advanced Supply Demandの可能性を最大化するには、 https://www.mql5.com/ja/blogs/post/720245 にアクセスしてください。   エントリーまたはターゲットの正確なトリガーポイントを正確に特定できれば取引がどのように改善されるか想像してみてください。新しい基盤となるアルゴリズムに基づいて構築されているため、買い手と売り手の間の潜在的な不均衡をさらに簡単に特定できます。これは、最も強い需要と供給のゾーンと、過去のパフォーマンス(古いゾーンを表示)がグラフィカルに表現されるためです。これらの機能は、最適
ICT, SMC, SMART MONEY CONCEPTS, SMART MONEY, Smart Money Concept, Support and Resistance, Trend Analysis, Price Action, Market Structure, Order Blocks, BOS/CHoCH,   Breaker Blocks ,  Momentum Shift,   Supply&Demand Zone/Order Blocks , Strong Imbalance,   HH/LL/HL/LH,    Fair Value Gap, FVG,  Premium  &   Discount   Zones, Fibonacci Retracement, OTE, Buy Side Liquidity, Sell Side Liquidity, BSL/SSL Taken, Equal Highs & Lows, MTF Dashboard, Multiple Time Frame, BigBar, HTF OB, HTF Market Structure
TPSpro TRENDPRO  - is a trend indicator that automatically analyzes the market and provides information about the trend and each of its changes, as well as giving signals for entering trades without redrawing! The indicator uses each candle, analyzing them separately. referring to different impulses - up or down impulse. Exact entry points into transactions for currencies, crypto, metals, stocks, indices!  -  Version MT4                  DETAILED DESCRIPTION        /       TRADING SETUPS       
Gannスクエアインジケーターは、W.D. Gannによって執筆された「市場予測のための数学的な式」の記事に基づく強力な市場分析ツールです。このツールは、解析に数学的な概念を応用し、Gann理論に基づいています。それは、144、90、52のスクエアや9のスクエアなど、Gannの関連テクニックの要素を取り入れています。さらに、の方法を組み込んでおり、9のスクエアとその関連性についてのチャネルやスターパターンに焦点を当てています。 ユーザーマニュアルと使用方法: このインジケーターを使用する前に、ユーザーマニュアルを読んで疑問点を解決するためにお問い合わせいただくことをお勧めします。ユーザーマニュアルの完全版は、当社のウェブサイトで入手できます。 MT5の完全版は購入できますし、MT4の無料版も試すことができます。両方のバージョンへのリンクを提供していますので、ご利用ください。 主な機能と機能: Gannスクエアインジケーターは、市場分析のための完全なツールセットを提供し、幾何学的な概念とGann理論に基づいて的確な判断を行う手助けをします。以下に主な機能を示します。 9のスクエアの分析:
A key element in trading is zones or levels from which decisions to buy or sell a trading instrument are made. Despite attempts by major players to conceal their presence in the market, they inevitably leave traces. Our task was to learn how to identify these traces and interpret them correctly. Reversal First Impulse levels (RFI)   -  Version MT4                  INSTRUCTIONS                 RUS                 ENG                         R ecommended to use with an indicator   -  TREND PRO  
ご紹介     Quantum Breakout PRO は 、ブレイクアウト ゾーンの取引方法を変革する画期的な MQL5 インジケーターです。 13年以上の取引経験を持つ経験豊富なトレーダーのチームによって開発されました。     クォンタム ブレイクアウト プロ   は、革新的でダイナミックなブレイクアウト ゾーン戦略により、あなたのトレーディングの旅を新たな高みに押し上げるように設計されています。 クォンタム ブレイクアウト インジケーターは、5 つの利益ターゲット ゾーンを備えたブレイクアウト ゾーン上のシグナル矢印と、ブレイクアウト ボックスに基づいたストップロスの提案を提供します。 初心者トレーダーにもプロのトレーダーにも適しています。 量子EAチャネル:       ここをクリック 重要!購入後、インストールマニュアルを受け取るためにプライベートメッセージを送ってください。 推奨事項: 時間枠: M15 通貨ペア: GBPJPY、EURJPY、USDJPY、NZDUSD、XAUUSD アカウントの種類: ECN、Raw、またはス
The Volume by Price Indicator for MetaTrader 5 features Volume Profile and Market Profile TPO (Time Price Opportunity). Get valuable insights out of currencies, equities and commodities data. Gain an edge trading financial markets. Volume and TPO histogram bar and line charts. Volume Footprint charts. TPO letter and block marker charts including split structures. Versatile segmentation and compositing methods. Static, dynamic and flexible ranges with relative and/or absolute visualizations. Lay
MT4版  |  FAQ Owl Smart Levels Indicator は、 Bill Williams の高度なフラクタル、市場の正しい波構造を構築する Valable ZigZag、エントリの正確なレベルをマークする Fibonacci レベルなどの一般的な市場分析ツールを含む 1 つのインジケーター内の完全な取引システムです。 利益を得るために市場と場所に。 戦略の詳細な説明 インジケータを操作するための指示 顧問-取引助手 プライベートユーザーチャット ->購入後に私に書いて、私はプライベートチャットにあなたを追加し、あなたはそこにすべてのボーナスをダウンロードすることができます 力はシンプルさにあります! Owl Smart Levels 取引システムは非常に使いやすいので、専門家にも、市場を勉強し始めて自分で取引戦略を選択し始めたばかりの人にも適しています。 戦略と指標に秘密の数式や計算方法が隠されているわけではなく、すべての戦略指標は公開されています。 Owl Smart Levels を使用すると、取引を開始するためのシグナルをすばやく確認し、注文を出すため
Gartley Hunter Multi - An indicator for searching for harmonic patterns simultaneously on dozens of trading instruments and on all classic timeframes: (m1, m5, m15, m30, H1, H4, D1, Wk, Mn). Manual (Be sure to read before purchasing) | Version for MT4 Advantages 1. Patterns: Gartley, Butterfly, Shark, Crab. Bat, Alternate Bat, Deep Crab, Cypher 2. Simultaneous search for patterns on dozens of trading instruments and on all classic timeframes 3. Search for patterns of all possible sizes. Fr
TrendDecoder Premium MT5
Christophe, Pa Trouillas
5 (1)
レンジと次の動きを特定     |    トレンドの最も早いシグナルと強さを得る     |    反転の前に明確な出口を得る     |    価格がテストするフィボ・レベルを見つける。   |  非リペイント、非遅延インディケータ - マニュアルおよび自動売買に最適 - すべての資産、すべての時間単位に対応 - 発売記念50%割引   - その後 149 ドルに戻る 購入後、 推奨セッティングについては、このチャンネルで私に連絡してください。 MT4 バージョン: ここをクリック BladeSCALPER と PowerZONES を使った完全な方法を入手する どのようなものですか? TrendDECODERは、トレンド監視をシンプルかつ簡単にするための複数のイノベーションを集約したものです。 Projective TrendLine (投影トレンドライン) - 今後のトレンドのスピードリファレンス RealTime TrendLine vs. Projective TrendLine (リアルタイムトレンドライン vs. Projective Tren
MetaBands M5
Vahidreza Heidar Gholami
4.67 (3)
MetaBandsは、強力でユニークなアルゴリズムを使用してチャンネルを描画し、トレンドを検出して、トレーダーに取引の入出ポイントを提供することができます。チャンネル指標に加えて、強力なトレンド指標でもあります。入力パラメータを使用して新しいチャンネルを作成するために、異なるタイプのチャンネルを統合することができます。MetaBandsは、市場のイベントについてユーザーに通知するために、すべてのタイプのアラートを使用します。 特徴 ほとんどのチャンネルアルゴリズムをサポート 強力なトレンド検出アルゴリズム 異なるタイプのチャンネルを統合する能力 マルチタイムフレームおよびマルチカレンシー(シグナルマトリックス) すべてのタイプのアラート機能(サウンド、画面フラッシャー、プッシュ通知、メール、ポップアップ、矢印) 再描画しない トレンド検出 MetaBandsは、チャネル内を振動する青いラインを使用してトレンドを検出します。ラインがチャネルの上部バンドに達すると、下降トレンドの開始を示し、下部バンドに達すると上昇トレンドの開始を示します。青いラインが中心ラインに近づくと、市場はコンソ
Was: $249  Now: $99   Market Profile defines a number of day types that can help the trader to determine market behaviour. A key feature is the Value Area, representing the range of price action where 70% of trading took place. Understanding the Value Area can give traders valuable insight into market direction and establish the higher odds trade. It is an excellent addition to any system you may be using. Inspired by Jim Dalton’s book “Mind Over Markets”, this indicator is designed to suit the
TPA True Price Action indicator reveals the true price action of the market makers through 100% non-repainting signals strictly at the close of a candle! TPA shows entries and re-entries, every time the bulls are definitely stronger than the bears and vice versa. Not to confuse with red/green candles. The shift of power gets confirmed at the earliest stage and is ONE exit strategy of several. There are available now two free parts of the TPA User Guide for our customers. The first "The Basics"
クリスマスセール!40% OFF!1月1日に価格が$250に値上がり! GoldenGate Entriesをご紹介します:最先端のトレーディングソリューション! GoldenGate Entries(GGE)を使用して取引する革新的なアプローチを発見しましょう。GGEは、取引体験を向上させるために設計された先進的なインジケーターで、ユーザーに正確性と自信を持たせるための包括的な機能を提供します。 通貨ペア:Any(FX - 商品 - 株式 - 株式 - クリプト) タイムフレーム:15分からH1 主な特徴: 買いと売りの矢印の指示:常に情報を受け取るために、買いと売りの矢印の指示をポップアップアラートとともに受け取ります。 GoldenGate_Algo:GoldenGate_Algoを使用して市場の状況を把握し、市場が「売り過ぎ」または「買い過ぎ」かどうかを評価する強力なツールです。 現在のトレンド分析:視聴中のタイムフレームで現在のトレンドにアクセスして、取引を市場の主流方向に合わせることができます。 組み込みのピボットポイント:組み込まれた
Matrix Arrow Indicator MT5
Juvenille Emperor Limited
5 (14)
マトリックスアローインジケーターMT5は、すべてのシンボル/商品(外国為替、商品、暗号通貨、インデックス、株式)で使用できる100%再描画されていないマルチタイムフレームインジケーターに続くユニークな10in1トレンドです。マトリックスアローインジケーターMT5は、初期段階で現在のトレンドを判断し、最大10の標準インジケーターから情報とデータを収集します。 平均方向移動指数(ADX) 商品チャネルインデックス(CCI) クラシック平研アシキャンドル 移動平均 移動平均収束発散(MACD) 相対活力指数(RVI) 相対力指数(RSI) 放物線SAR ストキャスティクス ウィリアムズのパーセント範囲 すべてのインジケーターが有効な買いまたは売りシグナルを与えると、対応する矢印がチャートに印刷され、次のろうそく/バーの開始時に強い上昇トレンド/下降トレンドを示します。ユーザーは、使用するインジケーターを選択し、各インジケーターのパラメーターを個別に調整できます。マトリックスアローインジケーターMT5は選択されたインディケーターからのみ情報を収集し、それらのデータのみに基づいてアローを印
Bill Williams Advanced is designed for automatic chart analysis using Bill Williams' "Profitunity" system. The indicator analyzes four timeframes at once. Manual (Be sure to read before purchasing) Advantages 1. Automatically analyzes the chart using the "Profitunity" system of Bill Williams. The found signals are placed in a table in the corner of the screen. 2. Equipped with a trend filter based on the Alligator indicator. Most of the system signals are recommended to be used only accordi
note: this indicator is for METATRADER4, if you want the version for METATRADER5 this is the link:  https://www.mql5.com/it/market/product/108106 TRENDMAESTRO recognizes a new TREND in the bud, he never makes mistakes. The certainty of identifying a new TREND is priceless. DESCRIPTION TRENDMAESTRO identifies a new TREND in the bud, this indicator examines the volatility, volumes and momentum to identify the moment in which there is an explosion of one or more of these data and therefore the mome
Trade Assistant MetaTrader System  — a multi-timeframe system that is based on three standard indicators:   Stochastic oscillator ,   RSI   (Relative Strength Index), and   CCI   (Commodity Channel Index). It displays current trend directions for M1, M5, M15, M30, H1, H4, D1, W1, and MN1 timeframes. When you follow such an indicator you have a clear picture of the trends across all important timeframes. It doesn't matter which timeframe you attach this indicator to. Input parameters CheckCandl
- 50% off - Telegram group : https://t.me/+5RIceImV_OJmNDA0 MT4 version : https://www.mql5.com/en/market/product/84526?source=Unknown%3Ahttps%3A%2F%2Fwww.mql5.com%2Fen%2Fmarket%2Fmy Master Pullback is a complete system that gives unique trading opportunities and a clear indication of the market: trend, signals as well as stop loss and take profit levels. This system has been designed to be as simple as possible and detects extreme overbought and oversold zones, support and resistance levels, a
Professional Scalping Tool on Deriv Attention! The indicator will be sold in limited quantities!!! Description: This trading indicator is designed for professional traders focused on scalping. Designed with the market in mind, it provides highly accurate spike trading signals. It works on the M1 timeframe and supports the following symbols: Boom 300 Index, Boom 500 Index, Boom 1000 Index, Crash 300 Index, Crash 500 Index, Crash 1000 Index. Functional Features: - Direction: - Trading is ca
Quantum平均足PRO のご紹介 市場のトレンドに対する明確な洞察を提供するように設計された平均足キャンドルは、ノイズを除去し、誤ったシグナルを排除する能力で知られています。混乱を招く価格変動に別れを告げ、よりスムーズで信頼性の高いチャート表現を導入しましょう。 Quantum Heiken Ashi PRO を真にユニークなものにしているのは、従来のローソク足データを読みやすい色のバーに変換する革新的なフォーミュラです。赤と緑のバーはそれぞれ弱気トレンドと強気トレンドをエレガントに強調し、潜在的なエントリーポイントとエグジットポイントを驚くほど正確に見つけることができます。 量子EAチャネル:       ここをクリック MT4のバージョン:       ここをクリック この注目すべき指標には、いくつかの重要な利点があります。 明確性の向上: 価格変動を平滑化することで、平均足バーは市場トレンドをより明確に表現し、有利な取引機会を特定しやすくします。 ノイズの削減: 誤ったシグナルを引き起こすことが多い不安定な価格変動に別れを告げます。 Quantum Heik
作者のその他のプロダクト
Volume Profile Institutional Live
Agustinus Biotamalo Lumbantoruan
3 (1)
Unlock the Power of Market Analysis with Precision Are you ready to take your trading to the next level? The "Institutional Volume Profile" indicator is here to empower your trading decisions like never before. Key Features: Custom Volume Profiles : Plot volume profiles effortlessly by simply adding horizontal lines or Fibonacci tools on your MetaTrader 5 chart. There's no limit to how many profiles you can create. Insightful Visualization : The indicator beautifully displays crucial information
The Stochastic Momentum Index (SMI), developed by William Blau and featured in the January 1993 edition of Technical Analysis of Stocks & Commodities magazine, introduces a unique perspective to trading analysis. Distinguished from the conventional Stochastic Oscillator, which evaluates the current close in relation to the recent x-period high/low range, the SMI assesses the close's position relative to the midpoint of this range. This innovation yields an oscillator with a range of +/- 100, re
FREE
Lunatic
Agustinus Biotamalo Lumbantoruan
Ever wonder how to apply zodiac and moon cycle on your trading? Don't get me wrong, moon cycle doesn't give you when to buy or when to sell. But it gives you a different time frame that isn't shown in minutes, hourly or daily time frame. Pay attention to the market movement during New Moon and Full Moon Phases. Set to True "Use 4 Phases Only". Often the market is trending during these phases. ================ This indi also shows you the current trend of the market and it paints a candle on eac
This indi lets you plot higher time frame candle stick (Japanese Candlestick or Heiken Ashi Candlestick). This indicator could greatly help your trading style either its scalping, day trading or swing trading as it shows you the higher time frame candlesticks activity while you are about to pull a trigger on your trade. The candlesticks will only appear on a time frame that is lower than the higher time frame. It won't draw if the current time frame is equal to or higher than the time frame set
Super Gator
Agustinus Biotamalo Lumbantoruan
This indi shows the following 1. Supertrend 2. Alligator (Not a regular alligator) 3. ZigZag 4. Moving Average 5. Trend Continuation/Mini correction Signal (plotted in X) (See screenshots in green background color 6. Early Signal Detection (See screenshots in green background color) You may treat Alligator as the lagging indicator The leading indicator is the supertrend. The zig zag is based on the leading indicator where it gets plotted when the leading indicator got broken to the opposite.
One Four Four 144
Agustinus Biotamalo Lumbantoruan
This indicator displays support and resistance at fixed levels. The level won't change regardless how many days or minutes has gone by. There are 7 levels start from green ends at gray color. Imagine it like do (green),re,mi,fa,sol,la,si,DO (green) Market often goes one octave from do to DO or fa to FA. You will see this occurring at all markets This indicator can be used to spot your take profit or stop loss target. It can be also used to find support and resistance or supply and demand.
Richter Scale
Agustinus Biotamalo Lumbantoruan
This oscillator helps you to identify sideways movement that allows you to close your current position before you place a new position. It's simple straight and forward. When the indicator is flat, it indicates it's trending. When the indicator is printing at the extreme low (-1)/high(1) back and forth like a Richter scale graph, it indicates the market is in correction (sideway/diagonally). I call this earthquake, this is the opportunity for you to either take partial profit or open positio
This indicators analyze particular candle that determines the trend. It has 2 graphic lines Moving average and dynamic support & resistance line The colored MA is a leading indicator Dynamic & Support resistance is a lagging indicator to confirm or strengthen the leading indicator The candle also draws what institution candle in by default in blue color with green or red outline. Green outline with blue body, indicate a very strong bullish candle Red outline with blue body, indicate a very stron
Institutional Order Block
Agustinus Biotamalo Lumbantoruan
This indicator doesn't repaint & shows several things 1) Order Block 2) Imbalance candle stick (the icon is a vertical rectangle) 3) Swings (zigzag), 3 to be exact (minor, major and external major zigzags). If you know market structure, you should understand internal & external trends. Minor & major are internal trends of external major in this indicator. 4) Supply & Demand (arrow icon) 5) Major supply & demand (purple arrow) 6) Range/Bias lines (only shown in time frame 1hour & lower) 7) Previo
Supreme Institution RSI
Agustinus Biotamalo Lumbantoruan
Supreme Institution RSI helps traders to spot the trend with RSI. The RSI will change color accordingly and it can be set from the input. This indicator could aids your decision making before pulling the trigger. Just see the color and use it to aid your decision making. Any period works, any timeframe works, any instrument works. You could add 2 of them to your chart, one with period 3 (Fast) and another with period 16 (Slow). The default period is 3. If asked for recommendation, I'd recommend
Unlock the full profit potential of your trading strategy with Institutional Ichimoku—an unparalleled indicator that elevates your market analysis to a professional level. Institutional Ichimoku encapsulates the rich essence of the Ichimoku system and transforms it into a dynamic decision-making powerhouse, giving you the edge you need in today's complex trading landscape. Decode Market Trends: Delve deep into the intricacies of market trends with Institutional Ichimoku. This indicator provides
Institutional Fractal
Agustinus Biotamalo Lumbantoruan
Introducing our innovative Fractal Trend Indicator – a powerful tool designed to help you navigate the financial markets with ease. This user-friendly indicator utilizes fractals to provide valuable insights into market trends while allowing you to customize your visual cues for trend identification. Fractal Clarity: Our indicator employs dots to highlight fractal points, clarifying their significance in the market. These dots do not signify the trend themselves but serve as crucial reference p
Institutional Bollinger Band
Agustinus Biotamalo Lumbantoruan
The Bollinger Band Indicator, favored by institutional traders, offers a swift and comprehensive assessment of market conditions. It's an indispensable tool to distinguish between trending and sideways markets. This multifaceted indicator provides insights through three distinct means: Bollinger Bands, candle analysis, zigzag, and external swing. Trend Analysis: Bollinger Band Color: This feature uses green for bullish and red for bearish trends, offering a clear visual distinction. Candle Colo
Introducing our dynamic Swing Tunnel indicator, a powerful and straightforward tool designed to simplify market analysis while providing invaluable insights for traders. This versatile indicator relies on the interplay of two moving averages, forming a visual "tunnel" that changes color, offering clear signals for bullish and bearish market conditions. Let's delve into its features: Swing Tunnel Color Change: The heart of this indicator lies in the Swing Tunnel—a visual representation of marke
Golden Death Cross
Agustinus Biotamalo Lumbantoruan
Elevate Your Forex Trading with the "Gold Death Cross" Indicator! Are you ready to take your Forex trading game to the next level and harness the power of time-tested technical analysis techniques? Look no further! The "Gold Death Cross" indicator is here to revolutionize your trading experience and maximize your profit potential. Unlock the Wisdom of Multiple Moving Averages: The "Gold Death Cross" indicator doesn't just stop at one moving average; it brings you the combined insight of four mo
Swing Volume Profile
Agustinus Biotamalo Lumbantoruan
Are you tired of sifting through endless charts and data to make informed trading decisions? Look no further! The Swing Volume Profile is here to revolutionize your trading experience. With its cutting-edge features, this tool provides you with the insights you need to navigate the dynamic world of financial markets with confidence. Feature 1: Volume Profile Measured from Major Swing High to Major Swing Low   Accurate volume analysis is key to making informed trading decisions. The Swing Volume
Anchored VWAP Channel Bands
Agustinus Biotamalo Lumbantoruan
Point and Plot:  The Anchored VWAP with Channel Bands tool is designed for traders of all levels, from beginners to seasoned professionals. Point to the price level you want to anchor to, plot the horizontal line, and watch as this versatile tool transforms your trading approach. User-Friendly Interface : Navigate the tool effortlessly with a user-friendly interface that ensures you never miss a crucial detail. Real-Time Analysis : Make informed decisions in real time with dynamic data that upda
フィルタ:
レビューなし
レビューに返信
バージョン 1.12 2023.10.12
-zz update
バージョン 1.11 2023.10.07
aggressive mode setting in the input parameter
バージョン 1.10 2023.10.05
improvement
バージョン 1.9 2023.09.30
-improvement
バージョン 1.8 2023.09.29
-volume object update
バージョン 1.7 2023.09.29
-volume profile value area logic update
バージョン 1.6 2023.09.28
-code optimization
-initial volume profile setting is plotted to 10. It can be change from the input parameter "initial amount of plotted volume profile
バージョン 1.5 2023.09.27
- update to vol profile color
バージョン 1.4 2023.09.26
- plot vol right to left
- option to hide the frame of the volume
バージョン 1.3 2023.09.24
- M1 TF Vol profile
バージョン 1.2 2023.09.23
-volume profile
バージョン 1.1 2023.09.08
-bug fix to swing zigzag