SX Advanced MACD MT5
- インディケータ
- Mojtaba Sarikhani
- バージョン: 1.20
- アップデート済み: 3 3月 2024
- アクティベーション: 7
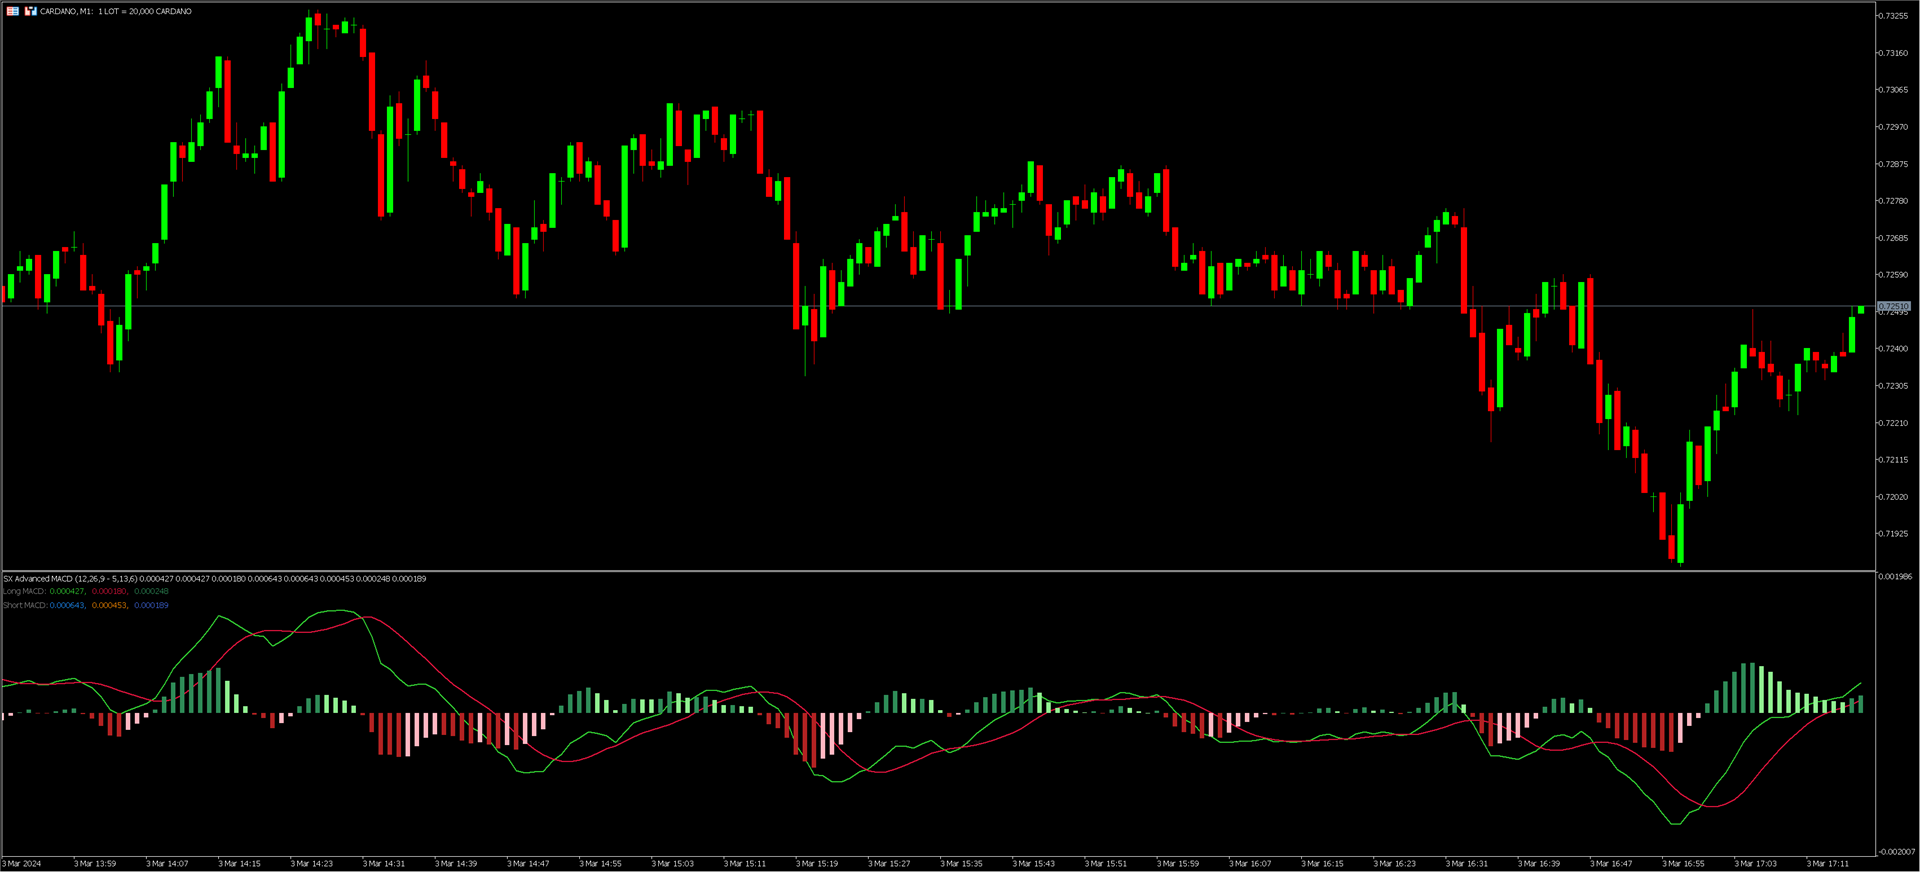
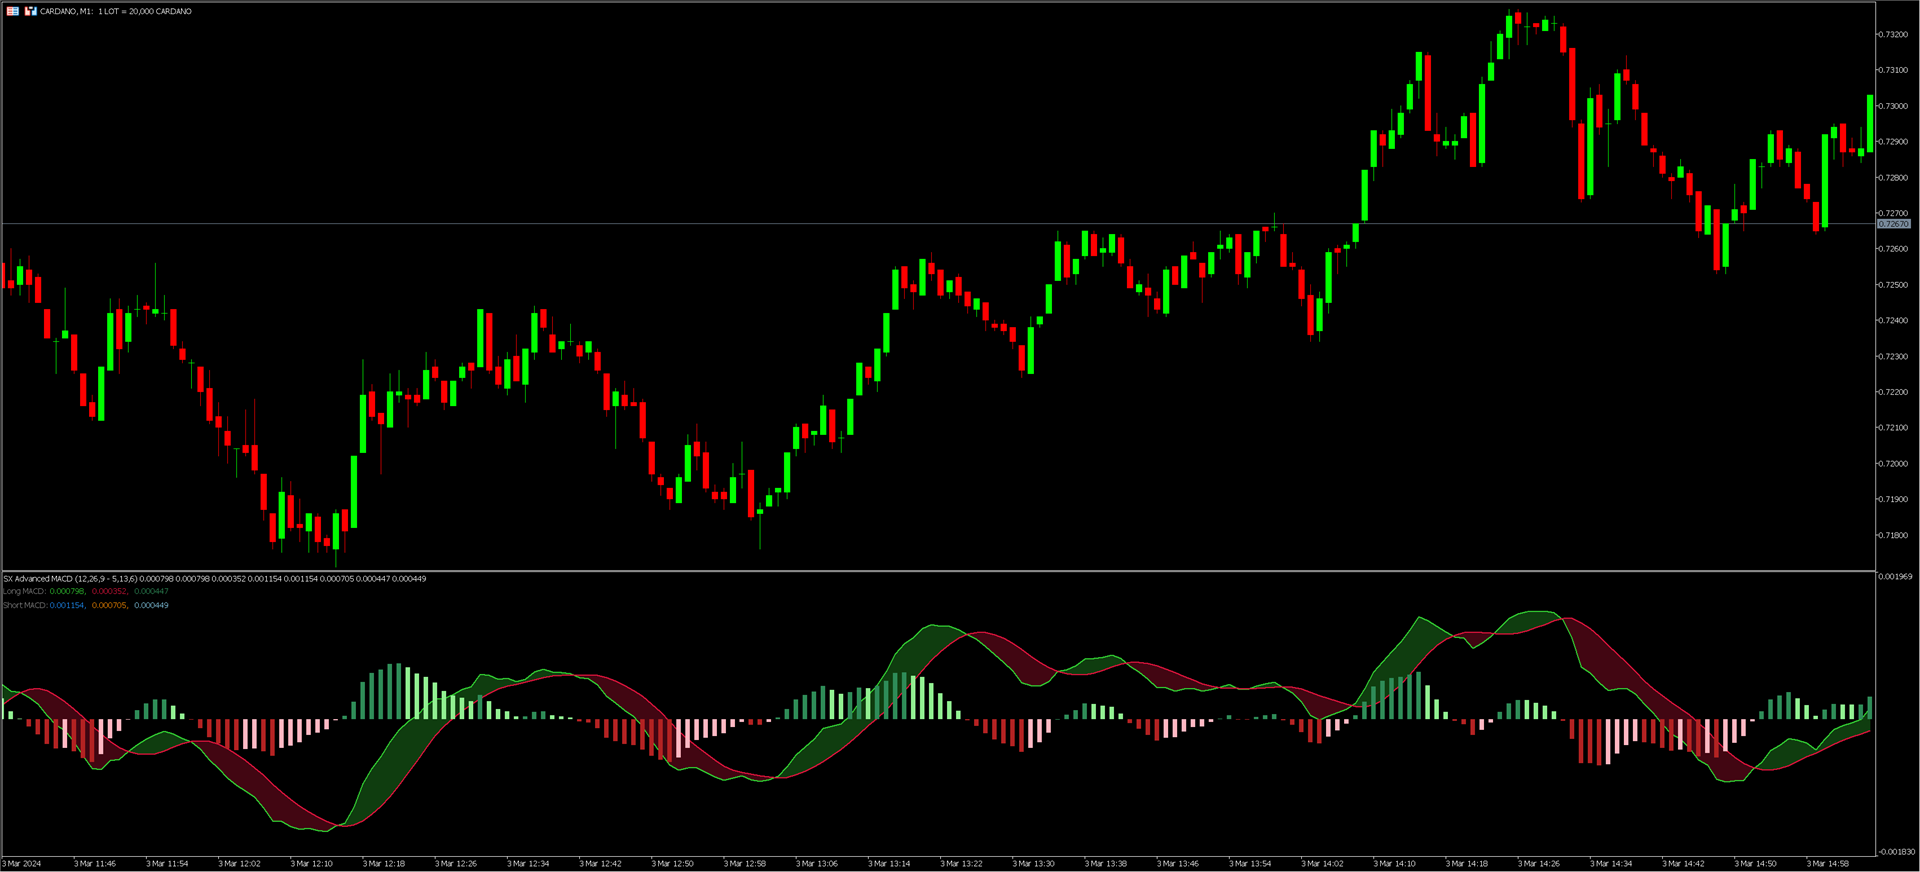
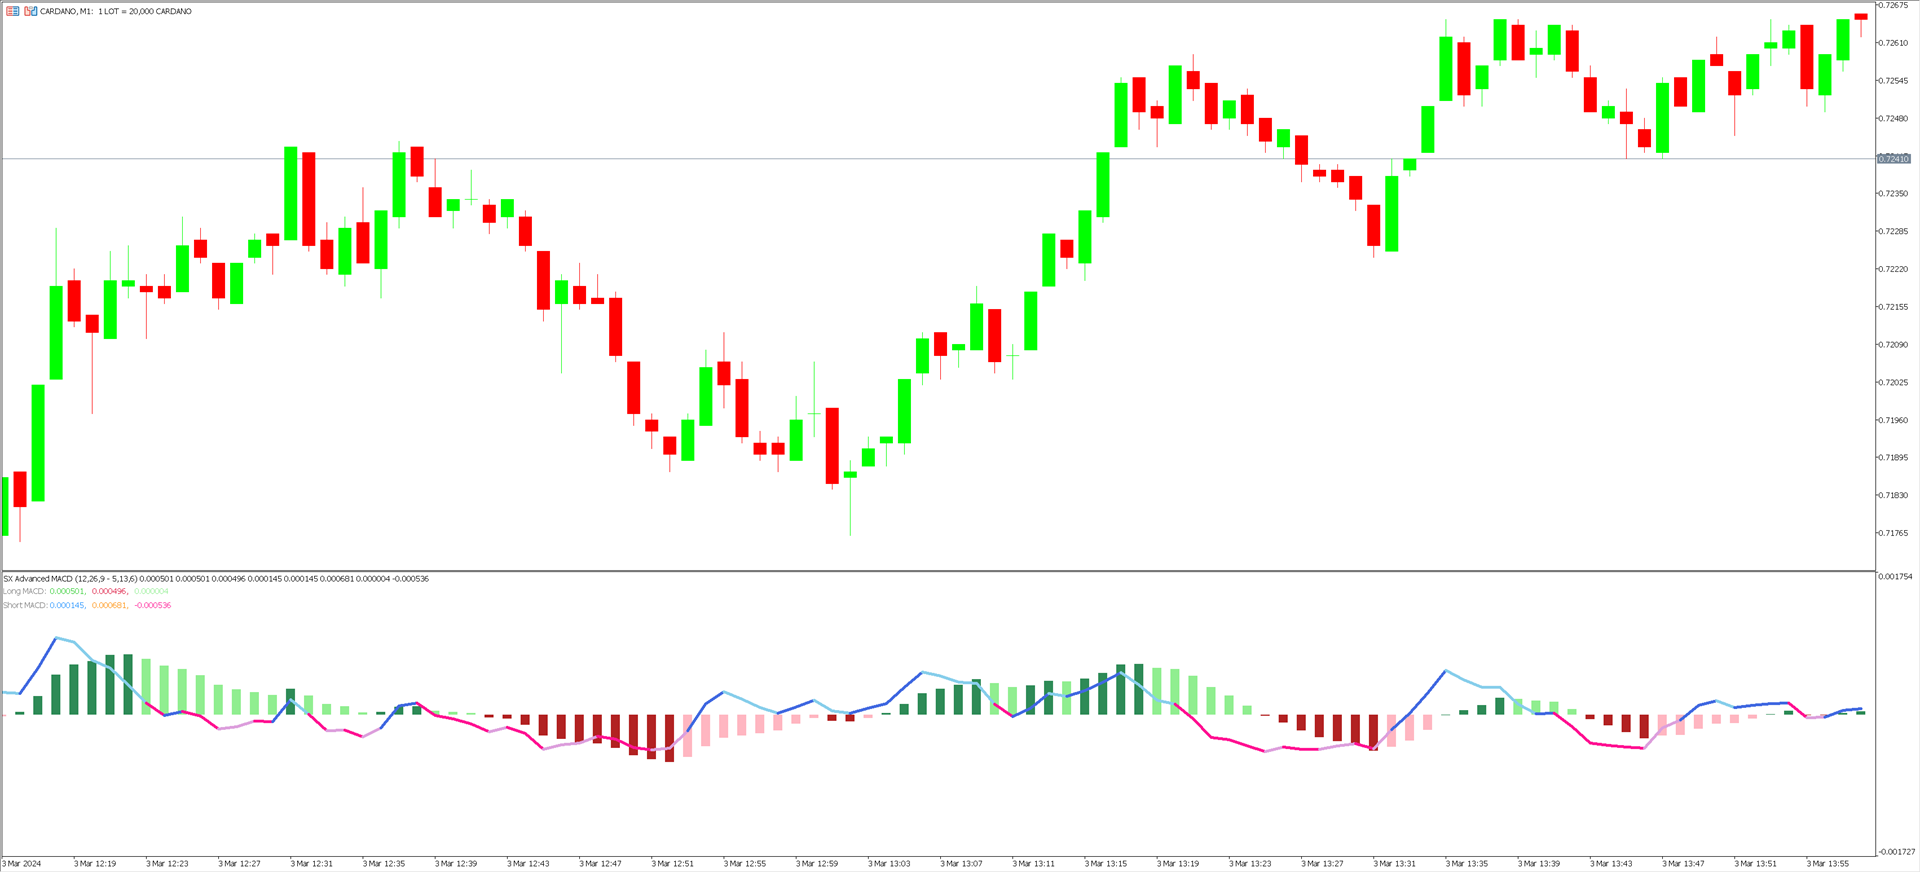
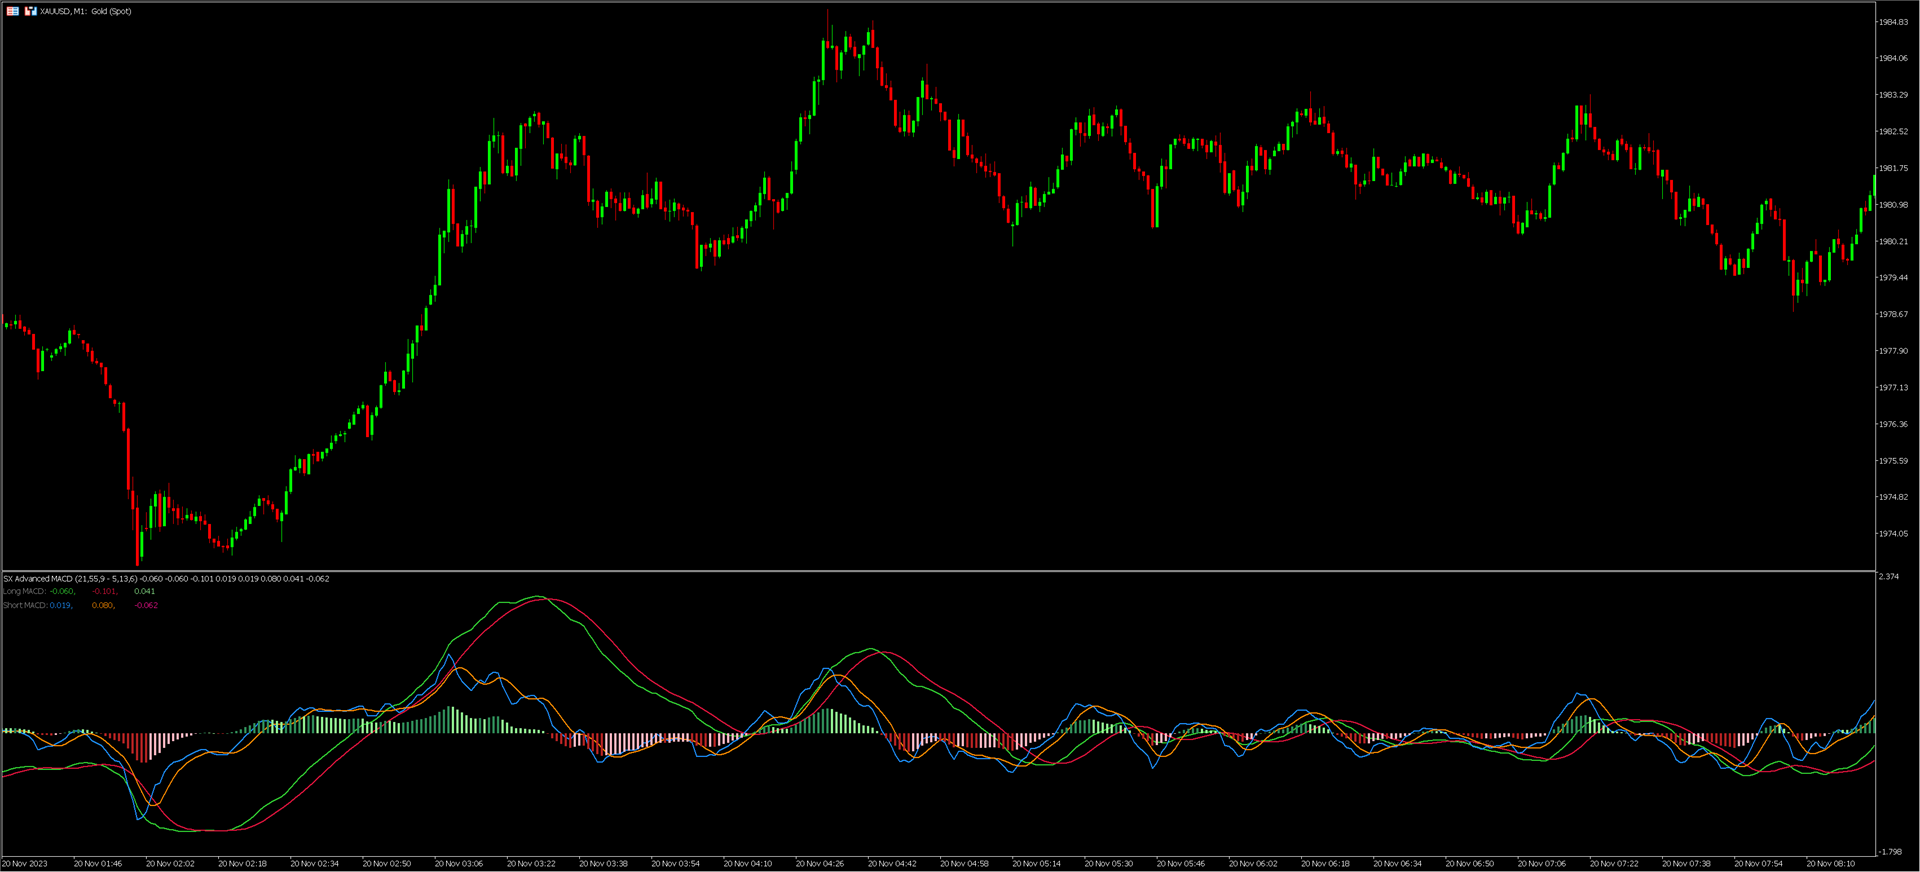
MACD (Moving Average Convergence/Divergence) is a widely used indicator in technical analysis. What makes the MACD such a valuable tool for technical analysis is that it effectively combines two indicators into one. It can help to identify trends and measure momentum simultaneously.
SX Advanced MACD for MT4 is available here.
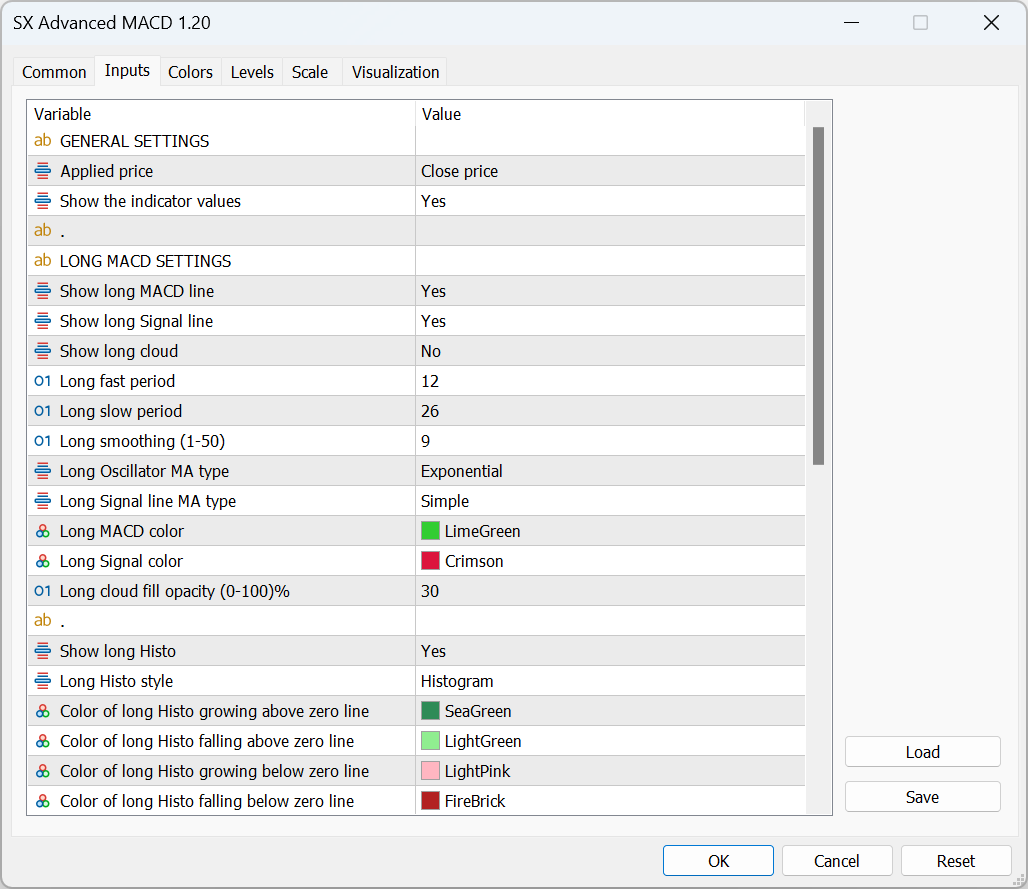
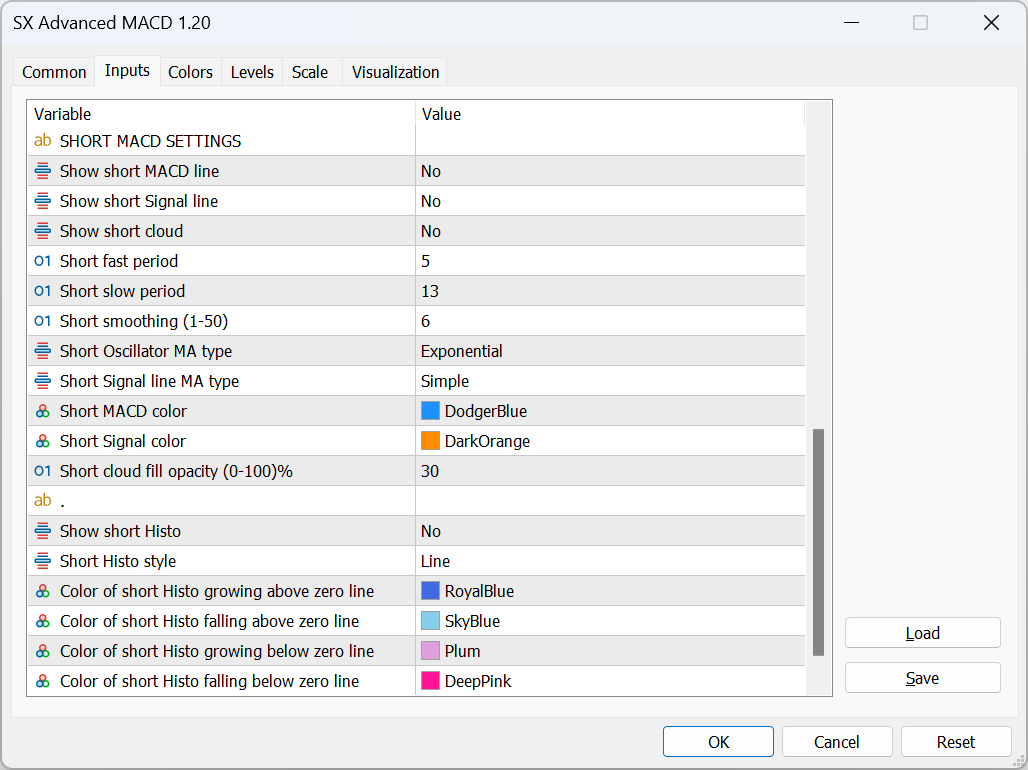
SX Advanced MACD indicator takes this concept further by plotting two distinct MACD indicators on a single chart, facilitating clear visual correlation between each other. This enhanced approach provides faster and more accurate signals compared to a single MACD, as it shows signals from both short and long timeframes together. The correlation between these indicators reveals the strength of the momentum in the current direction and indicates peak momentum levels.
Additionally, the indicator comes with default cloud options, which display the MACD and Signal lines for improved readability. The cloud changes color when the MACD and Signal lines cross, making it easier to distinguish between the four lines.
By default, all MACD/Signal lines and clouds are turned on, but users have the flexibility to toggle each one off in the indicator's settings. Furthermore, customization options allow users to modify the colors of each component according to their preferences, offering a personalized and tailored indicator experience.
#Tags: MACD, Moving Average Convergence Divergence, Advanced MACD, Best MACD, Colored MACD, Extended MACD, Multicolor MACD, MultiColored MACD, Multi-color MACD, Multi-Colored MACD, Two line MACD, Extended MultiColored MACD, Enhanced MACD, Signal, Momentum Indicator, Momentum
DISCLAIMER: Please notice that we do not provide any financial advice. We only provide tools for anyone interested in improving their trading.