MostTr
- インディケータ
- Ahmet Metin Yilmaz
- バージョン: 1.0
- アクティベーション: 5
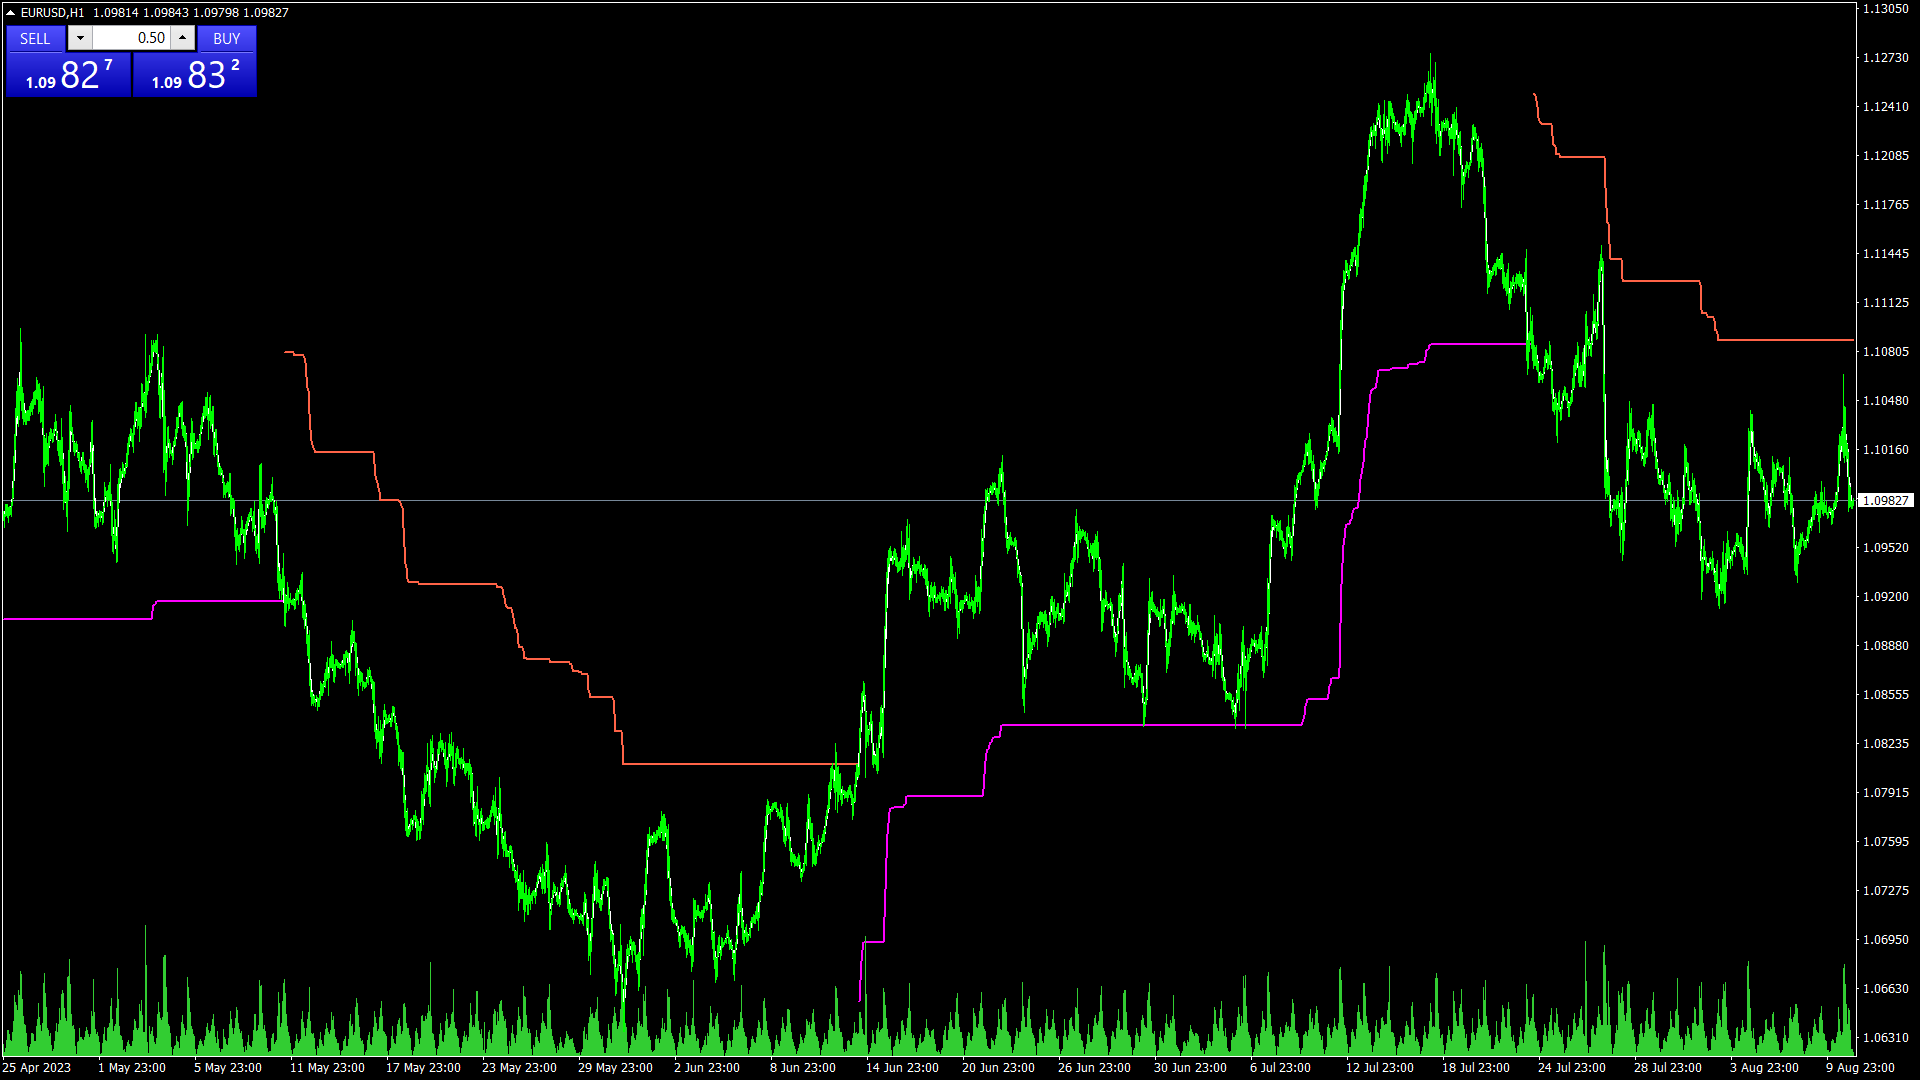
MOST インジケーターは、他のプラットフォーム、特に株式や指数で使用されている非常に人気のあるインジケーターです。基本は移動平均と高値と安値のレベルです。株式および指数の場合はパーセント入力を 2、外国為替商品の場合は 1 ~ 1.5 を使用するのが適切な場合があります。楽器ごとに独自の調整を行うことができます。使いやすく、シンプルで分かりやすいインジケーターです。 1時間足チャートや日足チャートでよく見られます。今のところMT4プラットフォーム向けにのみ編集していますが、MT5向けのリクエストがあれば、将来的に公開する予定です。
MOST インジケーターは、他のプラットフォーム、特に株式や指数で使用されている非常に人気のあるインジケーターです。基本は移動平均と高値と安値のレベルです。株式および指数の場合はパーセント入力を 2、外国為替商品の場合は 1 ~ 1.5 を使用するのが適切な場合があります。楽器ごとに独自の調整を行うことができます。使いやすく、シンプルで分かりやすいインジケーターです。 1時間足チャートや日足チャートでよく見られます。今のところMT4プラットフォーム向けにのみ編集していますが、MT5向けのリクエストがあれば、将来的に公開する予定です。