MCP MA strategies panel MT5
- インディケータ
- Anton Iudakov
- バージョン: 1.8
- アクティベーション: 5
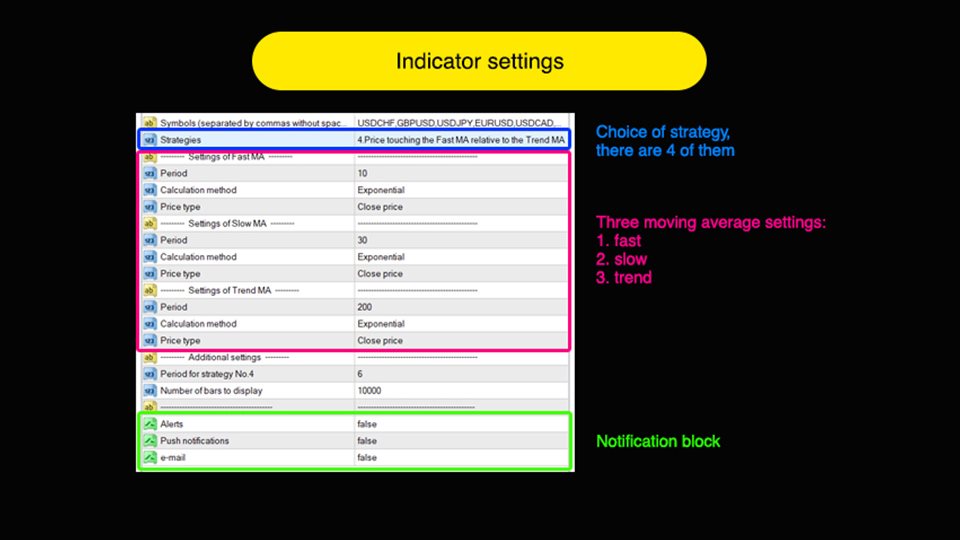
Multicurrency indicator in table format. Signals appear with confirmation, no repaints. Works on the current (open) timeframe. Notifications come for an open instrument. In the indicator settings, you can choose 1 of 4 Moving Average strategies.
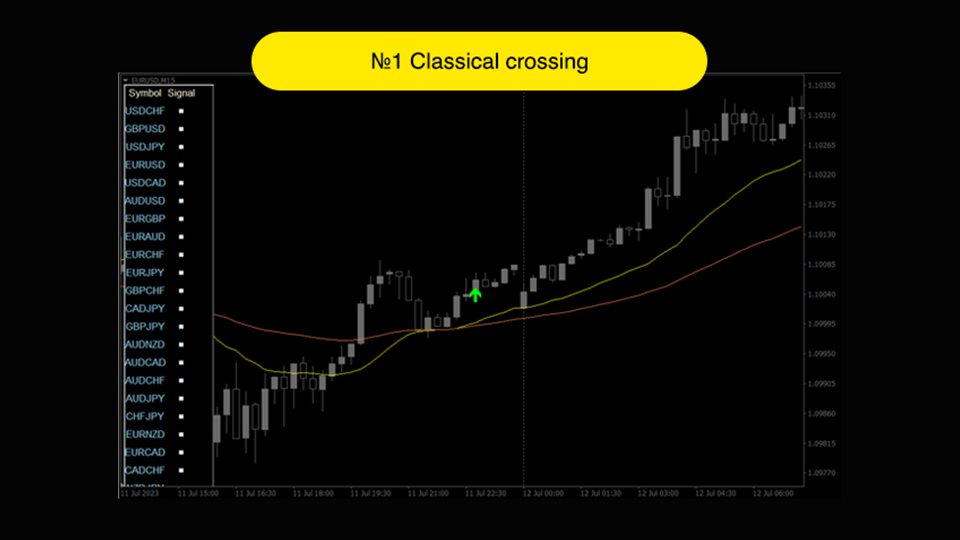
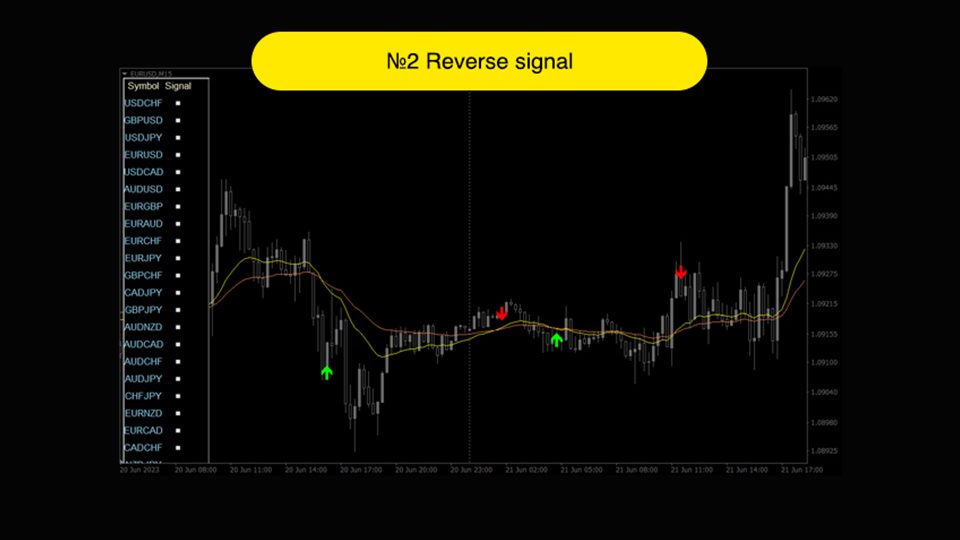
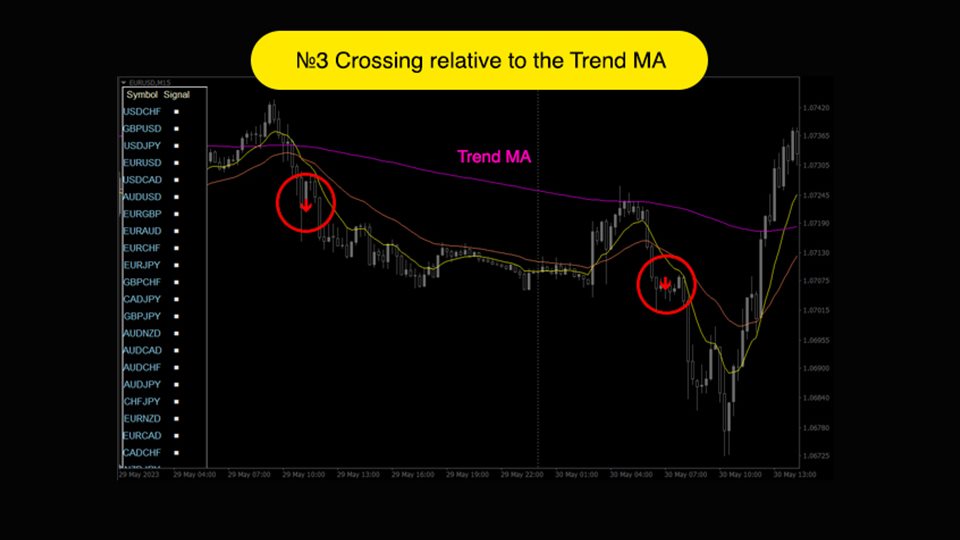
Strategies (represented in screenshots):
- Classic fast and slow moving average crossover
- Reverse signal of classic crossing (used for flat/sideways movement)
- Classic crossover relative to a slower moving average (Trend MA in settings)
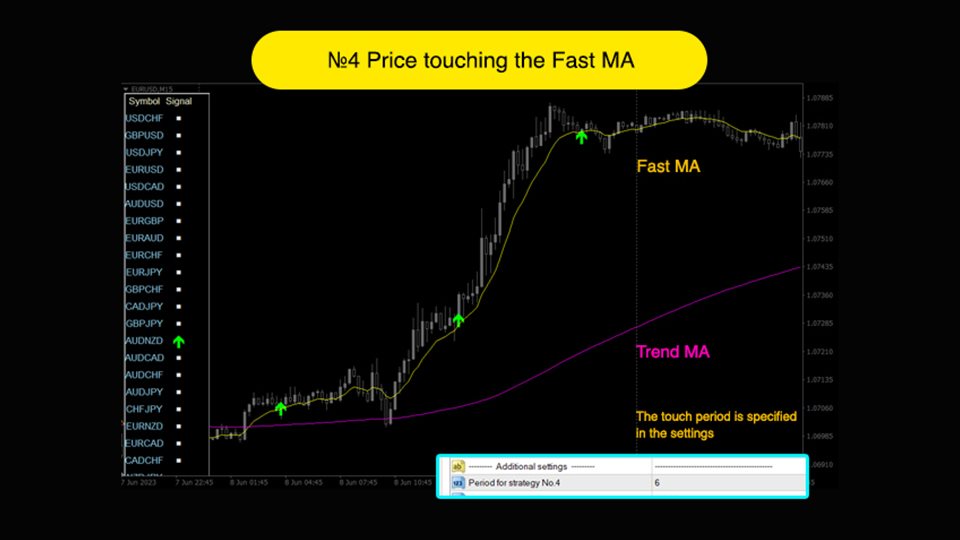
- Price touching the fast moving average relative to Trend MA
| Name | Description |
|---|---|
| Symbols | Symbols are listed separated by commas and without spaces. They will be displayed in the table |
| Moving average settings | Moving average settings |
| Period for strategy No.4 | Period for determining if the price touches the fast moving average for strategy No. 4 |
| Number of bars to display | The number of bars to display the indicator on an open chart. |
| Alerts | Signal presence alert. The arrows are not redrawn. |
Version for mt4 - see