Gold TMAFractal MTF 4
- インディケータ
- Sergei Linskii
- バージョン: 5.0
- アップデート済み: 10 10月 2023
- アクティベーション: 5
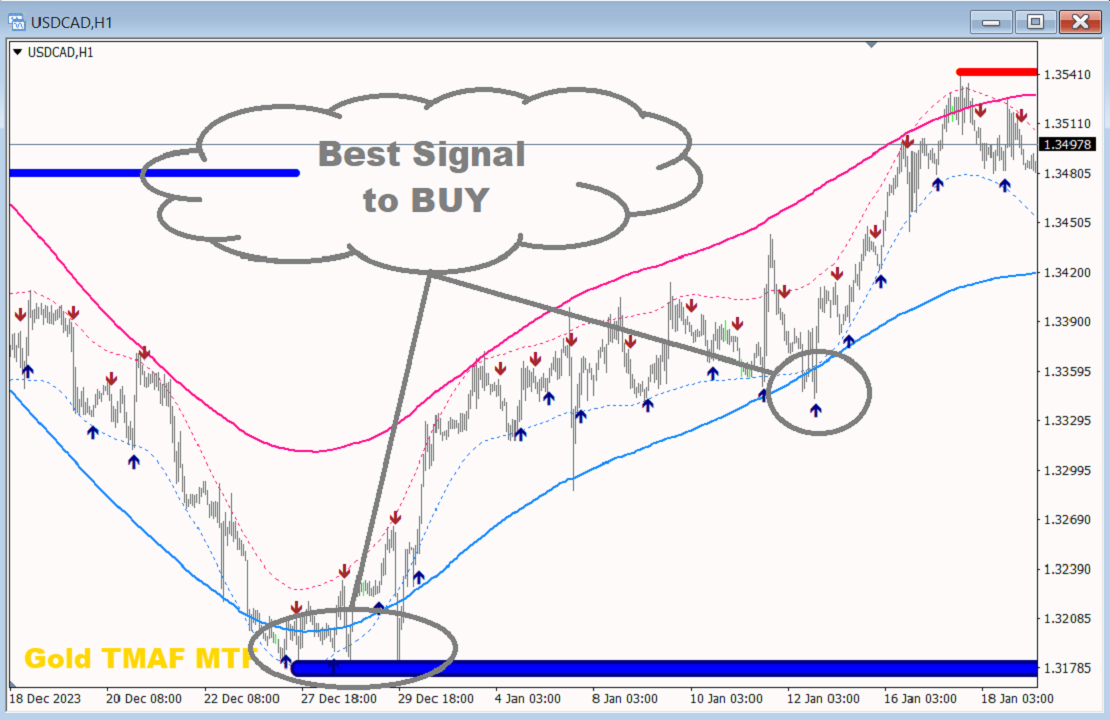
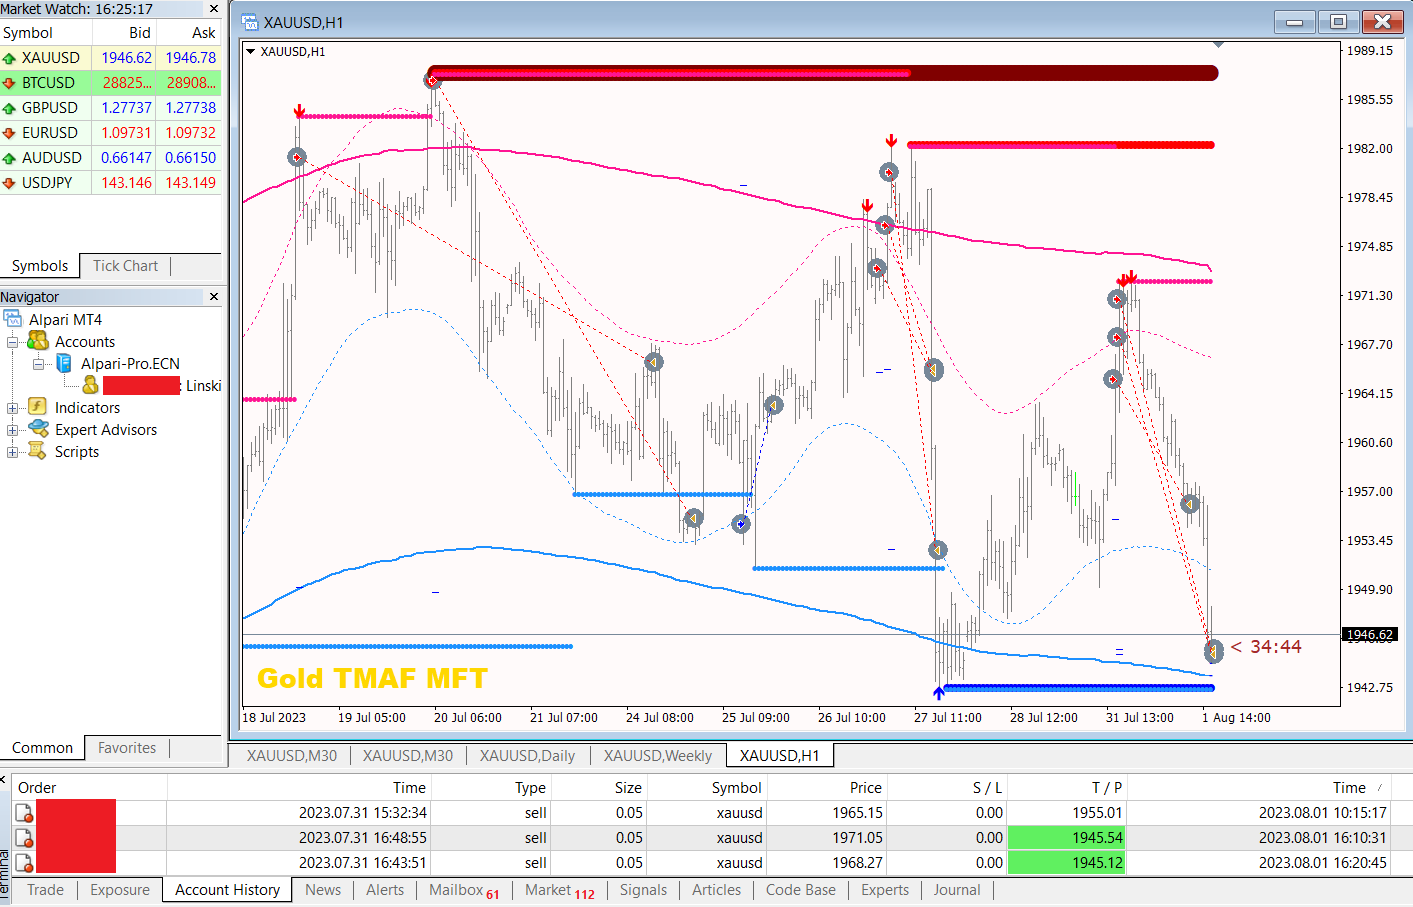
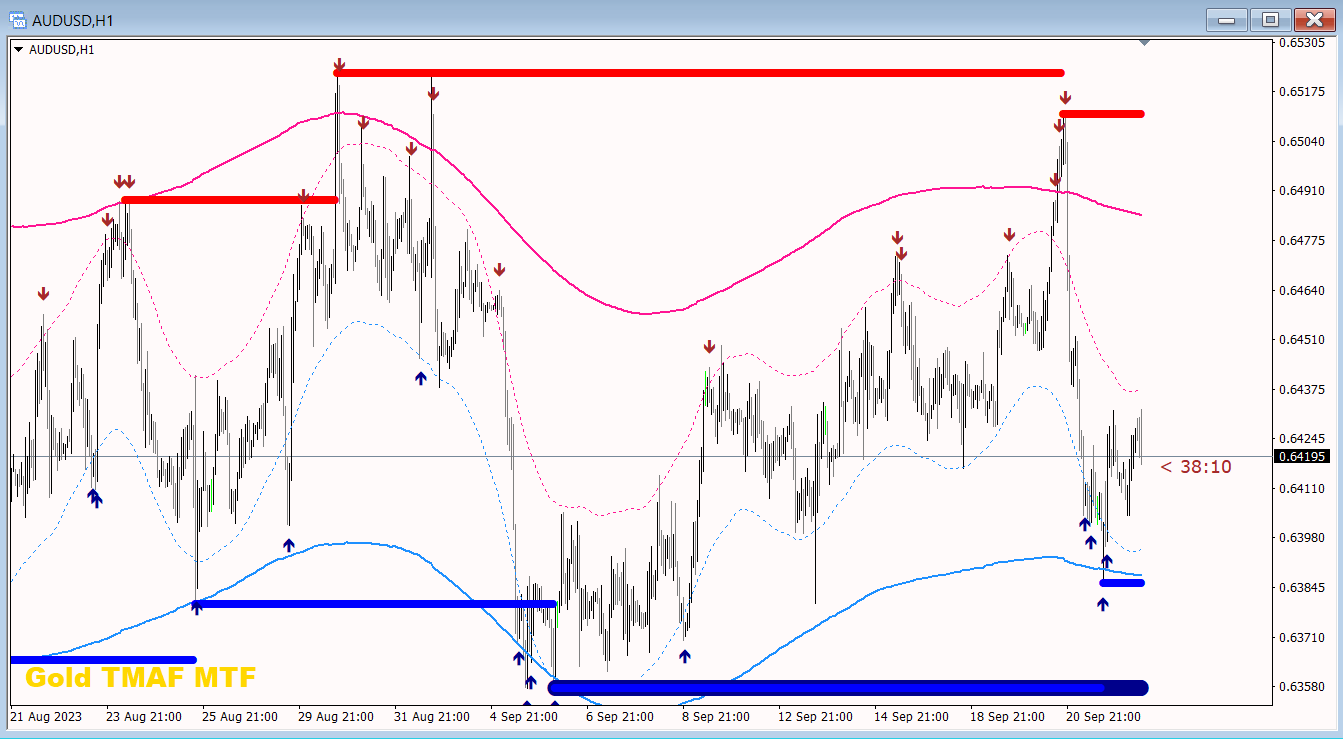
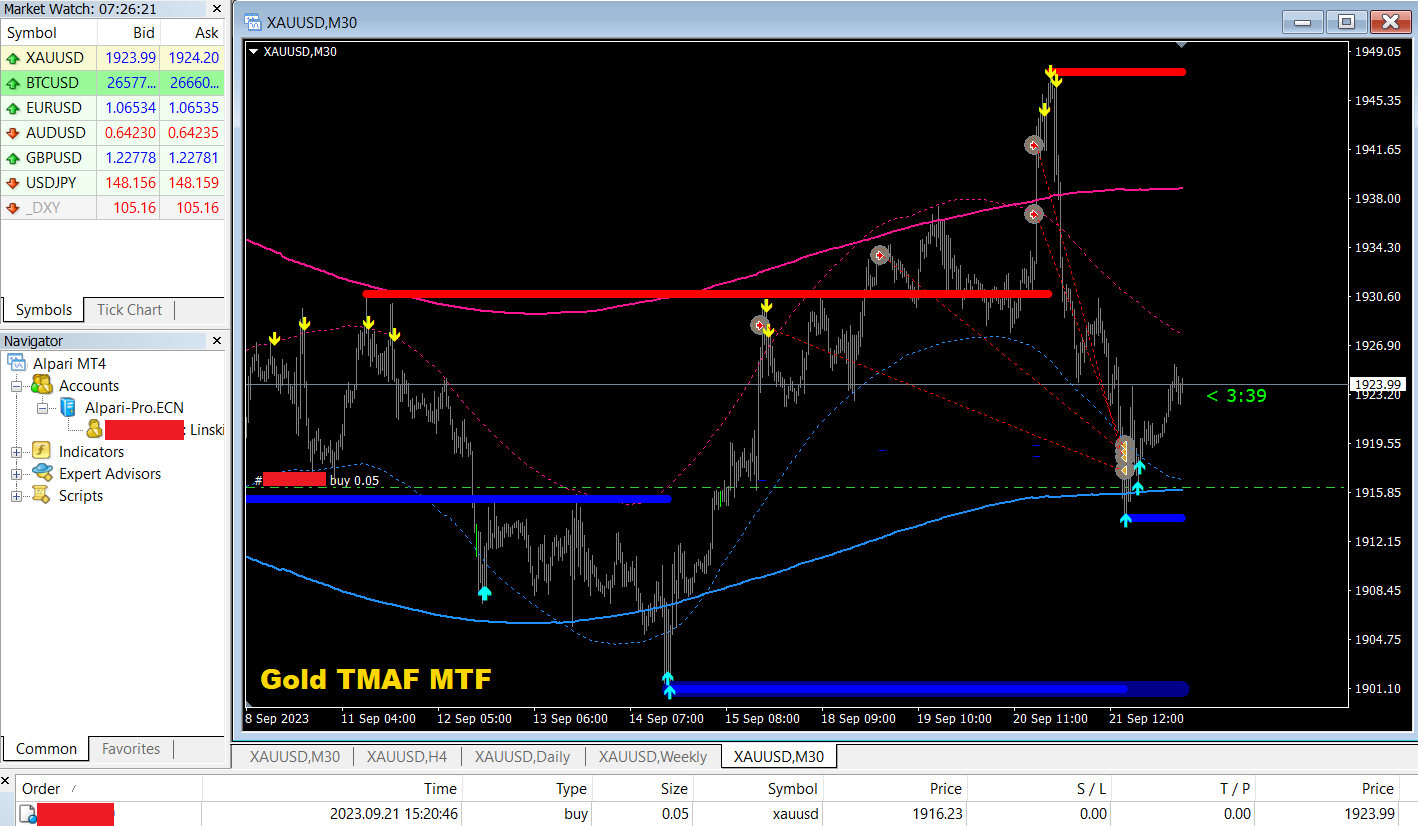
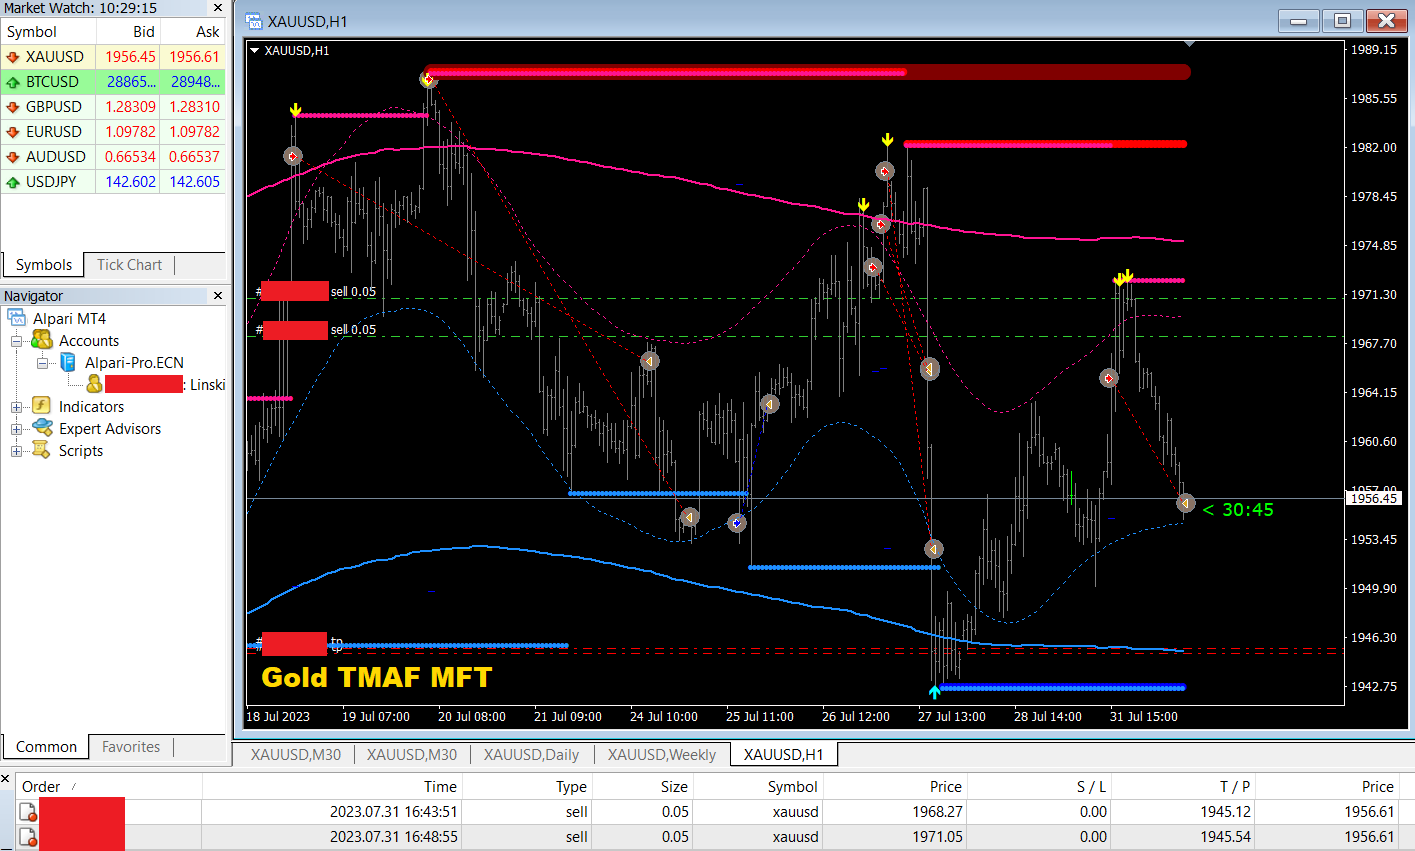
Gold TMAF MTF - これは最高の株式テクニカル指標です。指標のアルゴリズムは、資産の値動きを分析し、ボラティリティと潜在的なエントリーゾーンを反映しています。
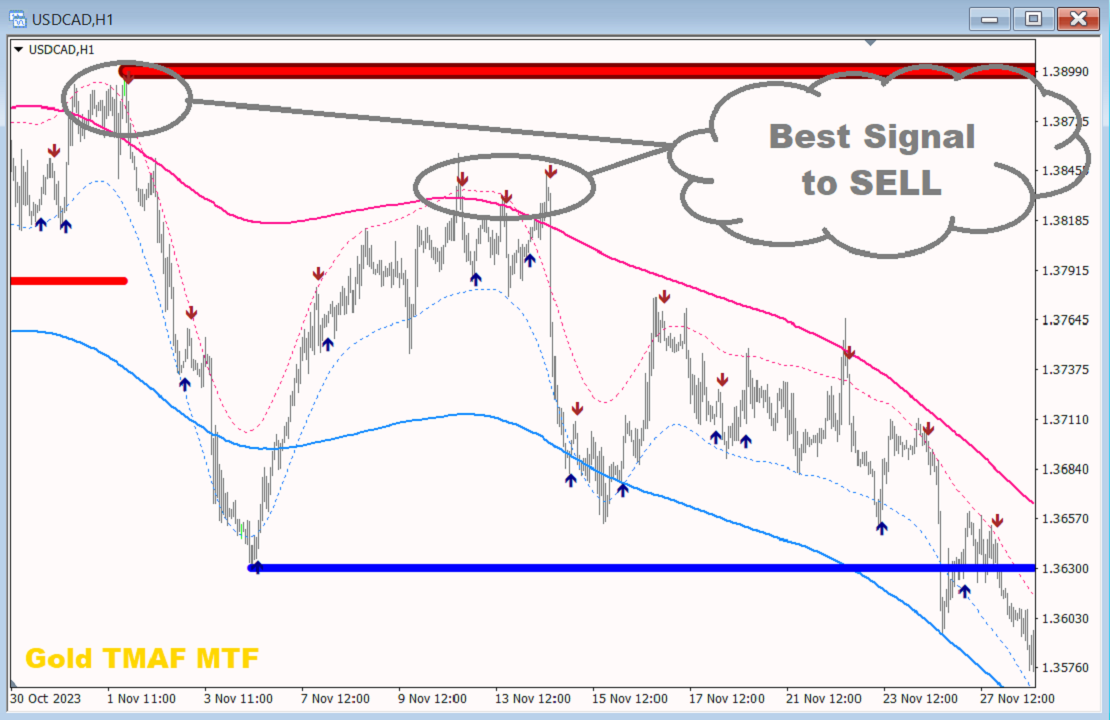
最高の指標シグナル:
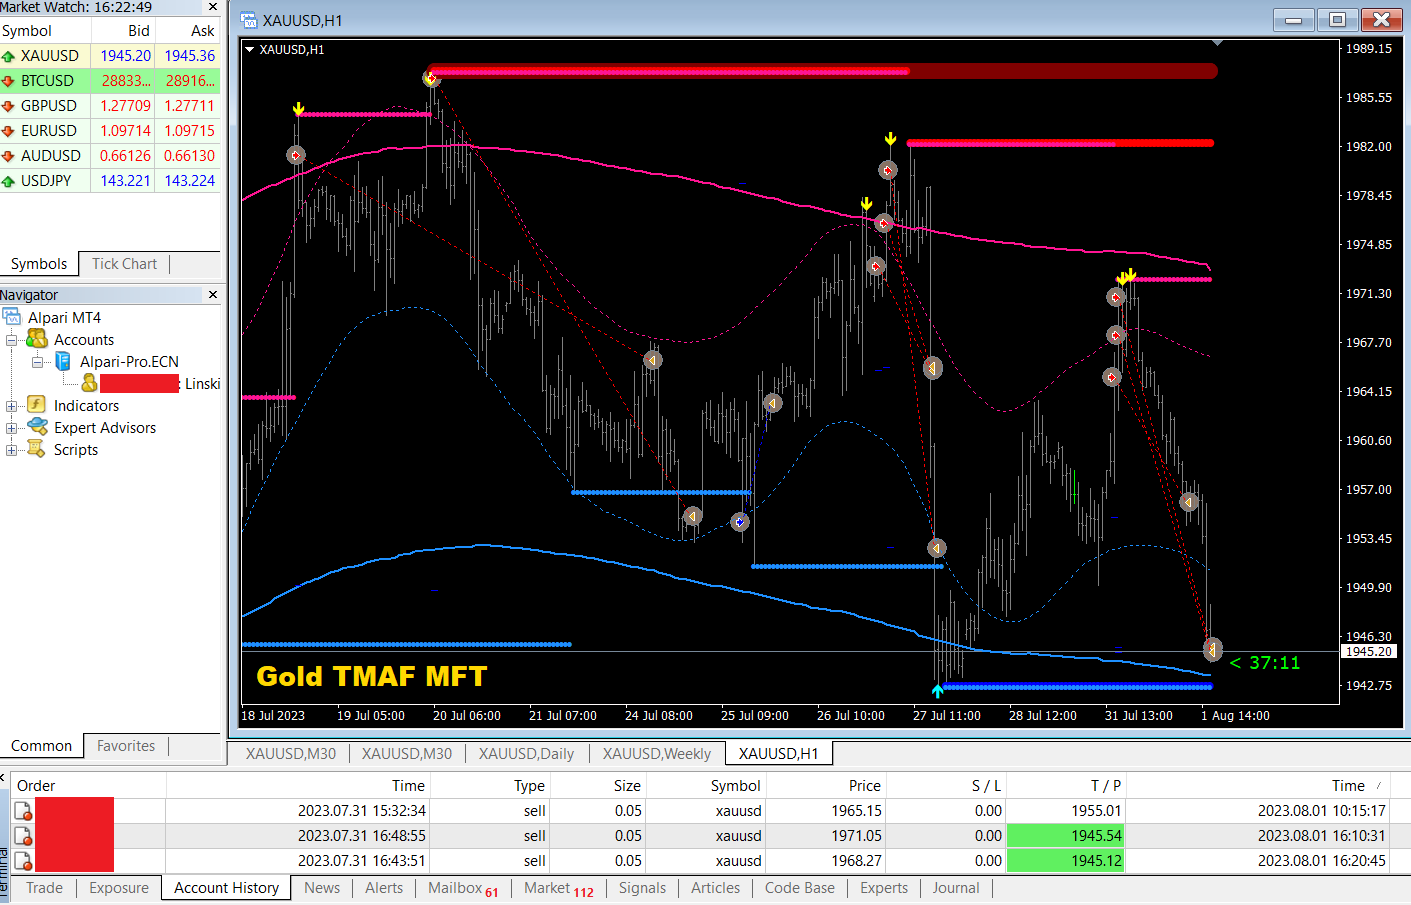
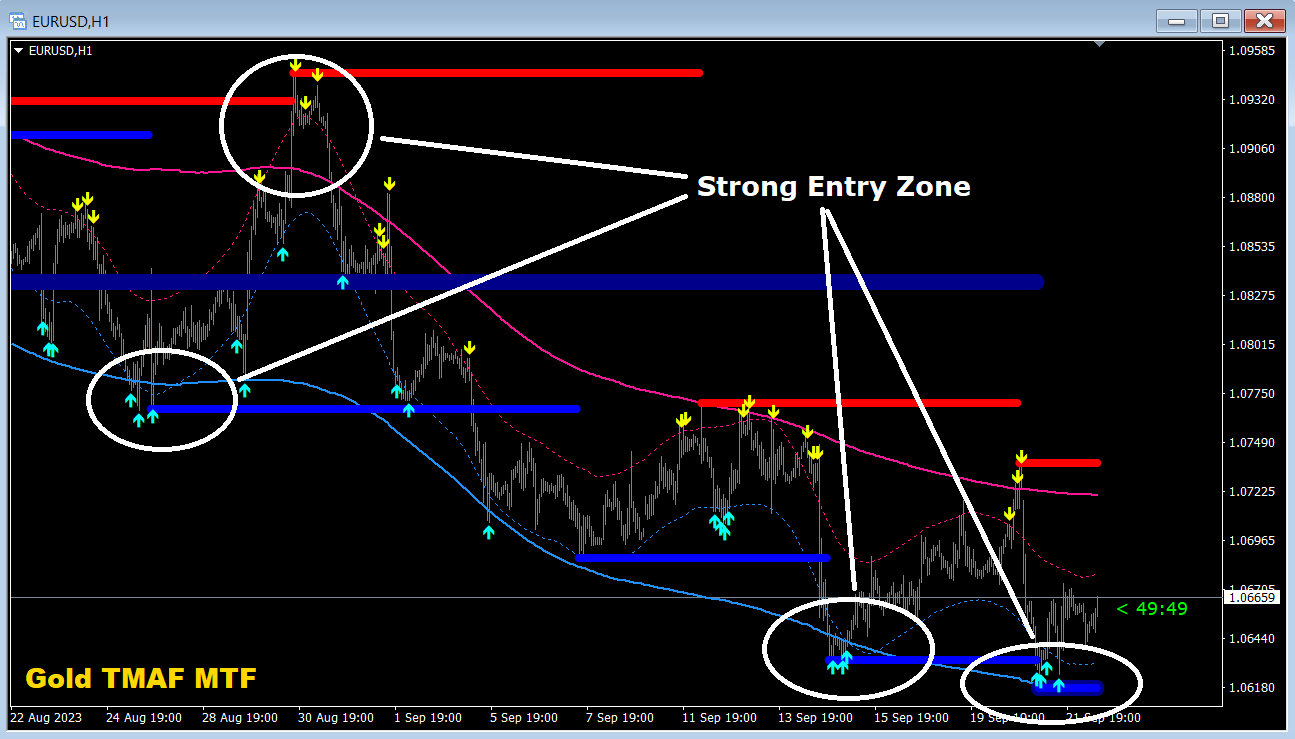
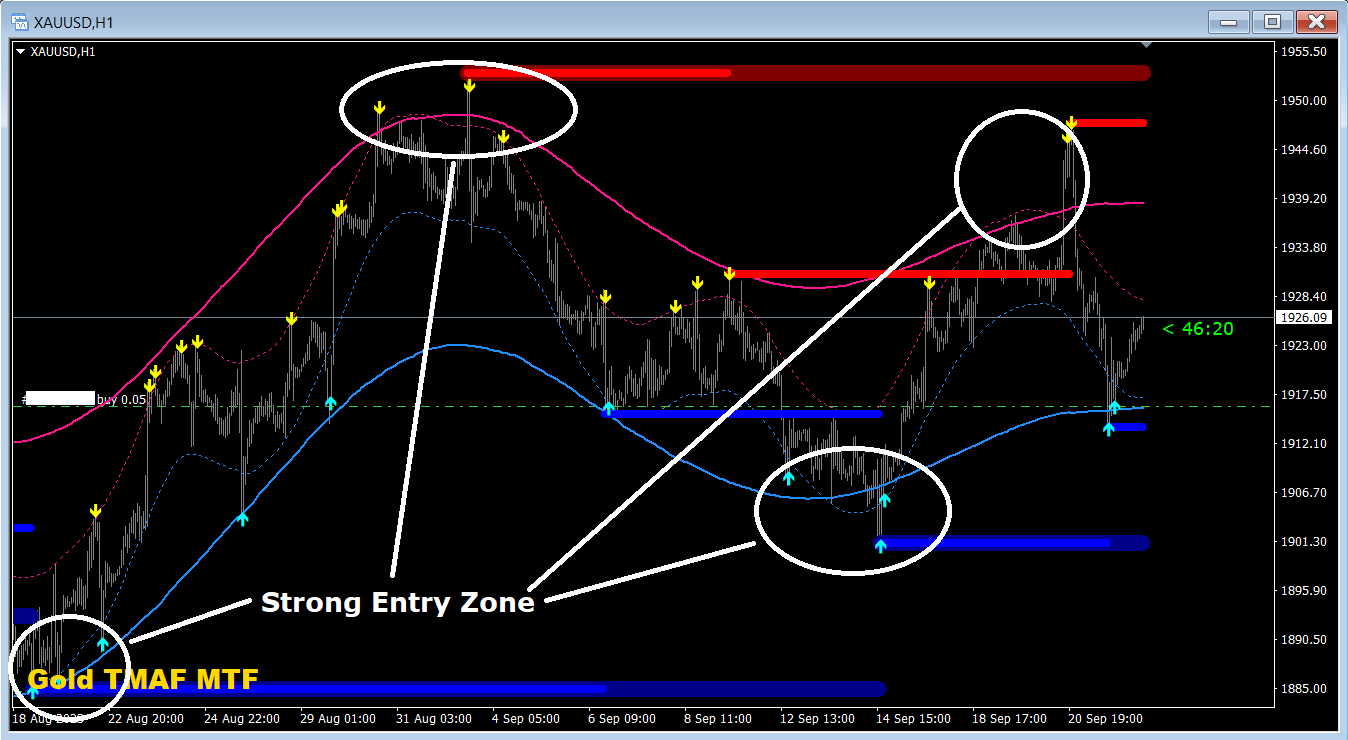
- 売りの場合 = TMA2の赤い上限がTMA1の赤い上限の上にある場合 + 上記の赤いフラクタル指標 + 同じ方向に黄色のSRシグナル矢印。
- 買いの場合 = TMA2の青い下限線がTMA1の青い下限線より下にある場合 + 下からの青いフラクタル指標 + 同じ方向の水色のSRシグナル矢印。
このインディケータの利点
1. このインディケータは、高精度のシグナルを生成します。
2. 確定した矢印シグナルは再描画されませんが、フラクタルシグナルは半周期再描画されます。
3. どのブローカーのMetaTrader 4取引プラットフォームでも取引できます。
4. あらゆる資産(通貨、金属、暗号通貨、株式、指数など)を取引できます。
5. M30-H1タイムフレーム(中期取引)で取引するのがよい。
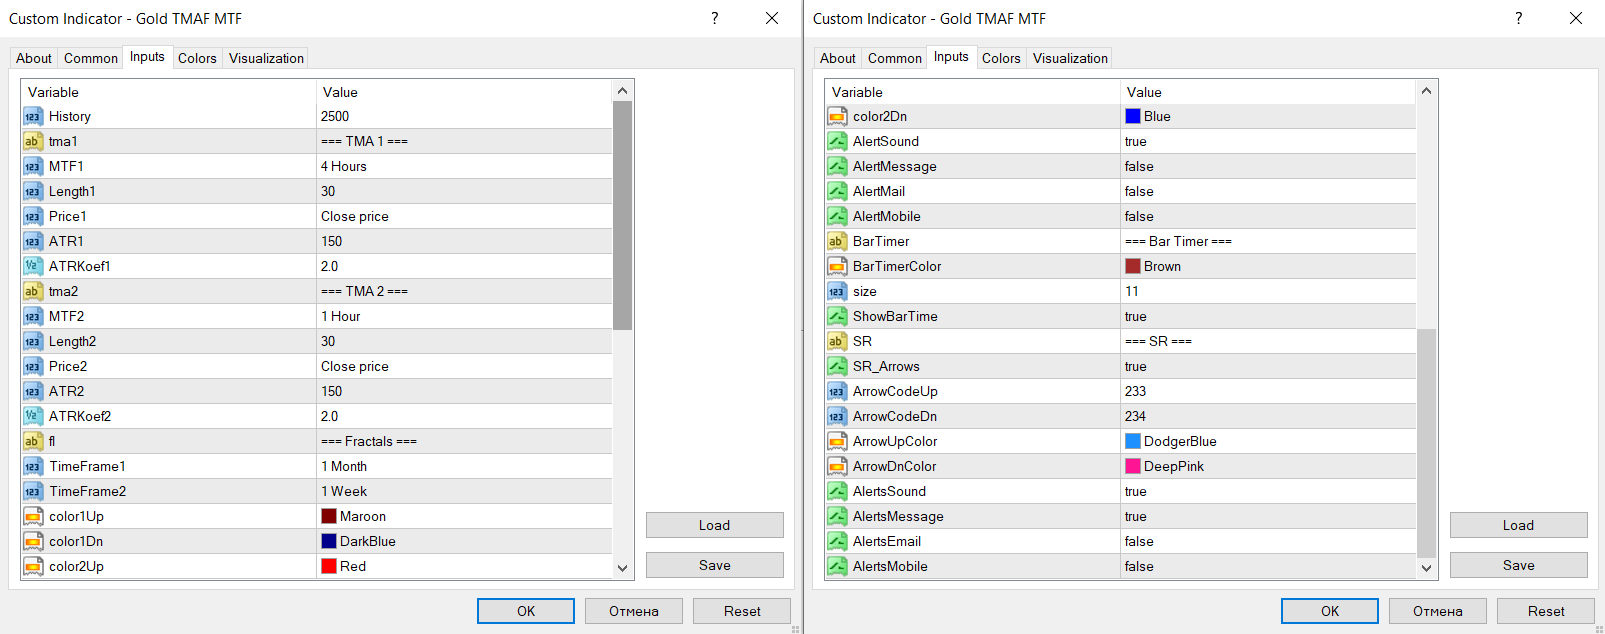
6. 各トレーダーがインディケータを自分用に簡単にカスタマイズできるよう、インディケータ設定で個々のパラメータ(TF、色など)を変更できます。
7. このインディケータは、トレーディングシステムの優れたメイン機能として、また独立したトレーディングシステムとして使用することができます。
注:取引の入力精度と収益性は、トレーダーのスキルにのみ依存します。いかなるインディケータも、トレーダーのアシスタ ントに過ぎず、行動を導くものではありません。
皆様のトレードの幸運と安定した利益をお祈りいたします!


great work