スピーディに自動売買ロボットを注文する方法を見る
注文を投稿するまたは受注する前にルールをご覧ください。
MQL5およびMQL4で自動売買ロボットを注文する方法
ロボットを注文するにはサンプル要件仕様をご覧ください
カテゴリでの新規注文:
仕事が完了した
実行時間2 日
依頼者からのフィードバック
He is excellent!
指定
Hi,
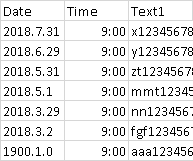
I have a Csv file that have date and time, and 2 text column as below. Separated by comma (,)
See the file attached.
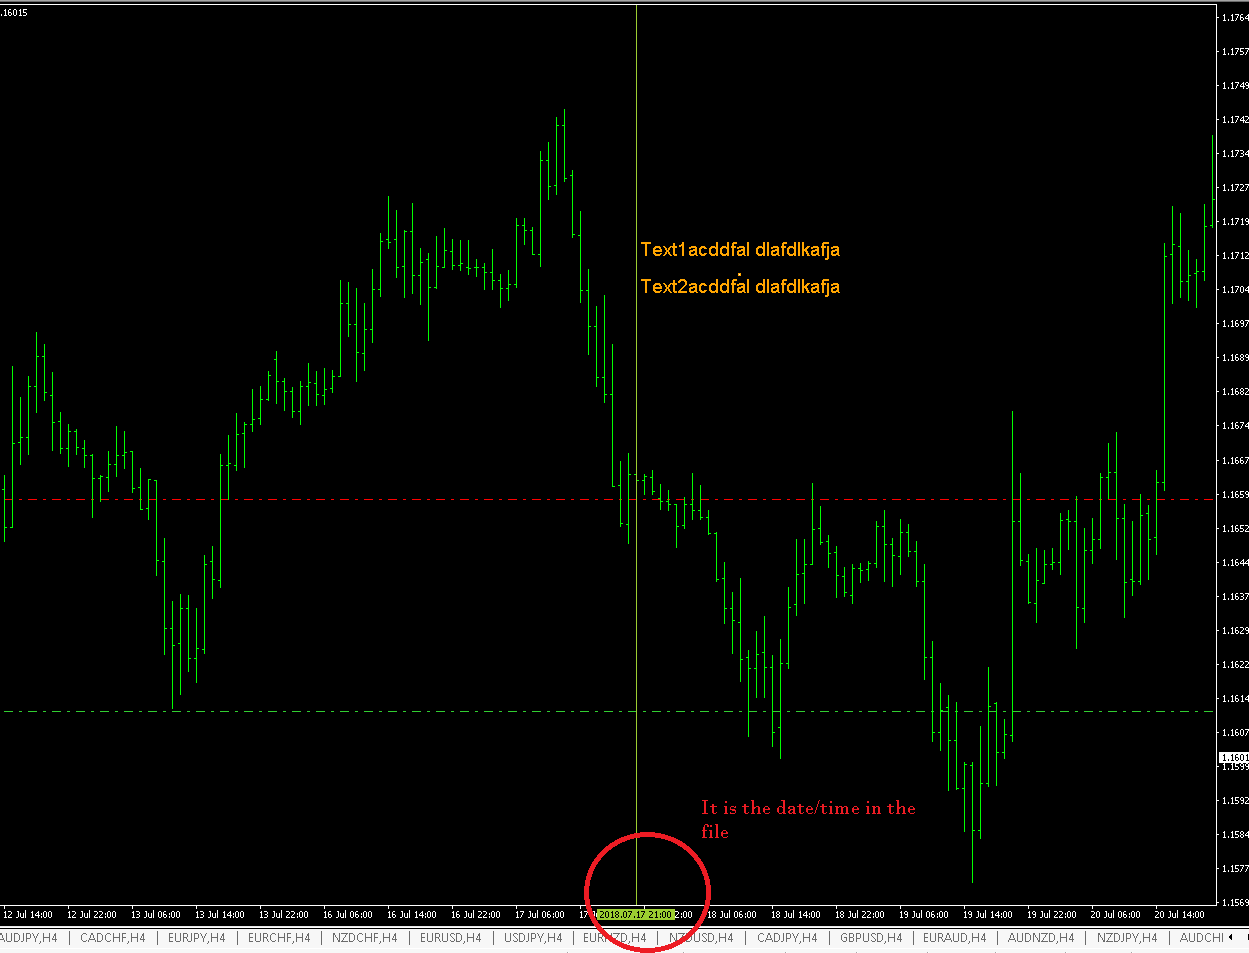
I want you to import and draw on chart the 2 text in 2 lines.
the 2 line start on the date/time provided in the file.
==========
Also, I have another file with only 1 text column. And I want you to create the same thing as above but just with 1 text box.
Basically, just modify your code and tell it to draw 1 box.
=========
There must be a option for me to change the color, font side of the text.
Thank you.
SCFX
| Date | Time | Text1 | Text2 |
| 2018.7.31 | 9:00 | aa23456789123456789 | aa23456789123456789 |
| 2018.6.29 | 9:00 | bb123456789123456789 | bb123456789123456789 |
応答済み
1
評価
プロジェクト
127
41%
仲裁
3
33%
/
67%
期限切れ
0
暇
2
評価
プロジェクト
1410
67%
仲裁
123
32%
/
41%
期限切れ
218
15%
暇
パブリッシュした人: 1 code
プロジェクト情報
予算
30+ USD
締め切り
最低 1 最高 2 日