MULTI-TIMEFRAME EMAs ALERT INDICATOR + TRADE EA

仕事が完了した

実行時間7 日
開発者からのフィードバック
Nice customer! Very good communication!!! Work again for other jobs!
依頼者からのフィードバック
VERY RECOMMENDED: LET'S HIRE HIM! Heprovided the EA of my dreams. He is very professional, patient, experienced in developing, honest and understanding person. In other words he's my HERO!

指定

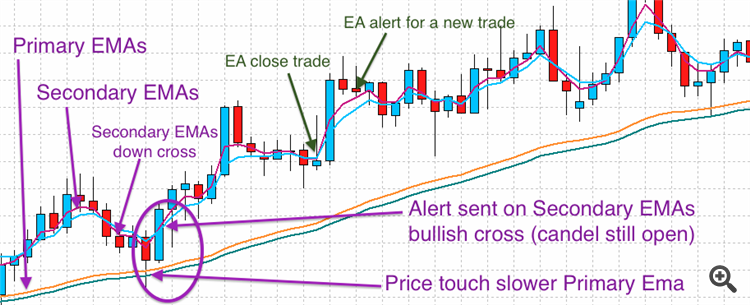
The indicator will place 4 EMAs and buy / sell arrows on the loaded chart.
It will analyze multi timeframe and symbols at the same time and send a (popup, sound, email and/or push) alert when an entry signal happens.
 
The indicator has to monitor multiple sets of symbols+timeframe based on current symbols ATR vs SPREAD. Let me explain.
Let’s assume that i want to scan 10 symbol, 20 symbol, any number of symbol. I set the symbols to scan in the symbol setting. For example:
USDCHF,GPBUSD,USDCAD,GBPCHF,GPBCAD,CADCHF,EURGBP,EURAUD,AUDCAD,GBPNZD,EURUSD,EURCHF,EURCAD,AUDJPY,NZDCAD,USDJPY,EURJPY,CHFJPY,CADJPY,NZDJPY,AUDUSD,GBPJPY,NZDUSD,AUDCHF,NZDCHF,AUDNZD,EURNZD,GBPAUD

For each setted symbol:

  • if [current spread]*100/ATR is < than a value (for example 5%) then the Indicator scans the symbol in all timeframes from 5 minutes to 1 month.
  • if [current spread]*100/ATR is > than a value (for example 10%) but < than another value (for example 10%) then the Indicator scans the symbol in all timeframes from 30 minutes to 1 month.
  • if [current spread]*100/ATR is > than a value (for example 15%) then the Indicator scans the symbol in all timeframes from 4 hours to 1 month.


SIGNAL RULES FOR BUY ALERT (Sell is at the contrary):

1st condition: Secondary EMAs are above the Primary EMAs
2nd condition: Primary EMAs are in bullish cross
3rd condition: Primary EMAs are spaced of a number of points (for example 10 points)
(4th OPTIONAL condition: ADX level is higher than a certain value)

1st event: Secondary EMAs down cross (bearish cross)
2nd event: price touch the Slower Primary EMA
3rd event: Secondary EMAs up cross (bullish cross)

When 3rd event takes place, then send immediately an alert (do not wait for the candle closing). Send 1 single alert x candle.

emas


Then I will also need a similar manual trading EA trade panel that let me easy manage trades from the chart:

  • Click button to set an horizontal graphic SL line (place the broker SL at that level when trade starts or, if freeze price has not been reached, place the broker SL at the minimum distance and leave this SL graphic line in the same place - this line will work as a SL-)
  • Caluclate lots based on a setter account risk % and SL pips distance from candle open price.
  • Open the trade when the next candle opens (same conditions and events above to determine if buy or sell)
  • Optional TP graphic line
  • Close the trade when secondary EMAs cross back at the end of the candle
  • Send an alert when a candle closes and Secondary EMAs cross back again ready to start a new trade
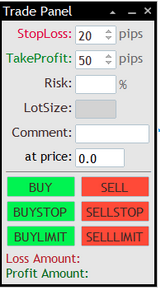
trade panel


ファイル:

応答済み

1
開発者 1
評価
(206)
プロジェクト
332
35%
仲裁
64
13% / 56%
期限切れ
87
26%
2
開発者 2
評価
(414)
プロジェクト
670
33%
仲裁
60
17% / 32%
期限切れ
113
17%
仕事中
3
開発者 3
評価
(58)
プロジェクト
77
44%
仲裁
12
8% / 50%
期限切れ
12
16%
4
開発者 4
評価
(213)
プロジェクト
246
45%
仲裁
42
10% / 57%
期限切れ
5
2%
5
開発者 5
評価
(130)
プロジェクト
184
32%
仲裁
16
31% / 63%
期限切れ
27
15%
パブリッシュした人: 1 code
類似した注文
Hello, I need a custom MT4/MT5 indicator that looks exactly like the screenshot I will provide (attached). The indicator should include: Candlestick chart Volume numbers displayed on each candle Multiple moving averages (colored lines) Automatic Support & Resistance levels Buy/Sell arrows (signals) Market direction in percentage (UP/DOWN %) Requirements: Must work on MT4 Source code must be clean and well-commented
Momo 30+ USD
Je suis disponible tous les jours à partir de 19h à 8h. Attach up to 32 files maximum 16 Mb per upload (.zip .txt .log .mqh .ex5 .mq5 .mq4 .mqproj .ex4 .mt5 .set .tpl .cl .py .sqlite .csv .ini .ipynb .onnx .gif .png .jpg .jpeg .mp4 .webm
Precision Shift EA 100 - 500 USD
Use the Daily (D1) chart as the higher timeframe reference. On the H1 timeframe, monitor for a sweep of the previous day’s high or low. A sweep means that price takes liquidity above or below the previous day’s level and then shifts back inside. After a sweep on H1, drop to the M5 timeframe. On M5, wait for a Change of State in Delivery / Market Structure Shift (CHOCH/BOS) to confirm entry. If the sweep occurs above
Sharper trading bot 30 - 200 USD
I have a $200,000 trading account challenge. I need the bot to work on trading view so it has to be a pine script I think. I’m going to attach a photo of the requirements for the account
📌 Forex EA Bot Requirement Document 1. General Information Trading Platform: MetaTrader 5 (MT5) / MetaTrader 4 (MT4) Trading Instruments: (e.g., GBP/JPY, XAU/USD, BTC/USD) Timeframes to Trade: (e.g., 15M, 1H, 4H, Daily) Trading Style: (Scalping, Swing trading, Intraday, Position trading) 2. Entry Rules Define the indicators/strategies for entry (e.g., Moving Averages, MACD, RSI, Order Blocks, Supply & Demand)
Hello, I want to make candles on the same chart as the one in the picture so that the trend is very clear and I know the upward or downward trend in a filtered way and with the same filter of the clear chart in front of you in the picture This is not an indicator, but a chart like Japanese candlesticks, Renko, etc. I want this chart as shown in the picture in front of you. It is the best chart I want because it shows
Sharp scalping 30 - 100 USD
I have $1 million account that I need a scalping box for with a 90% win rate I attached a photo of the daily draw down and the max draw down of the account because it is a prop firm challenge. I need it in Pine script for trading view. Thanks
$50 - $150 80+ USD
I need someone who can create a scalping trading bot for me. With a 1 - 5 minutes timeframe entry. A good robot that automatically opens a trade and close in profit
*Indicator Combination:* 1. *ZigZag*: To identify significant price movements and trend lines. 2. *Donchian Channels*: To plot trend lines based on highs and lows over a specified period. *Strategy Logic:* 1. *Trend Line Break*: A trend line break occurs when price closes above/below the trend line. 2. *Confirmation*: Additional confirmation can come from other indicators (e.g., RSI, MACD) or price action (e.g
Trading bot 100+ USD
Hello great developer I need a trading bot that can: Auto-detect and buy new tokens on the Surge tab of Axiom Pro within milliseconds Work with TradingView alerts (webhook integration) Allow settings for buy amount, slippage, and risk controls Optional: auto-sell (TP/SL) Please only apply if you have experience building crypto trading bots and can deliver a fast, reliable solution.Please

プロジェクト情報

予算
50+ USD
VAT(付加価値税) (22%): 11 USD
合計: 61 USD
開発者用
45 USD