スピーディに自動売買ロボットを注文する方法を見る
注文を投稿するまたは受注する前にルールをご覧ください。
MQL5およびMQL4で自動売買ロボットを注文する方法
ロボットを注文するにはサンプル要件仕様をご覧ください
カテゴリでの新規注文:
指定
Hi,
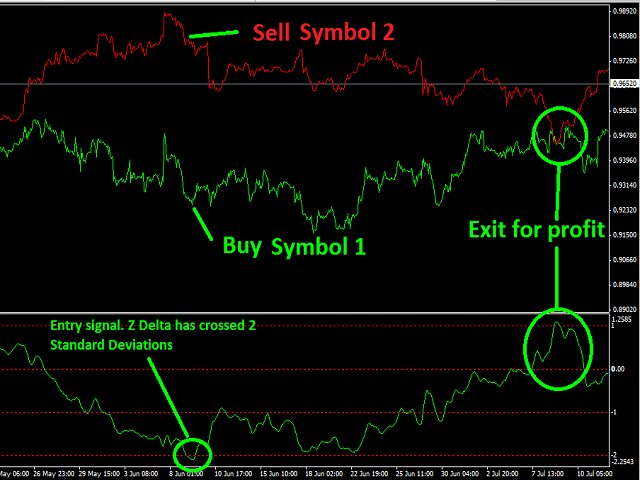
The indicator plots two pairs on the screen and then calculates the standard deviations of the spread difference of the two pairs.
Basically I have a very simple strategy When "Standard Deviation" is at +-2, sell high priced instrument and buy low priced instrument and exit at the trade at when Standard Deviation reverts to mean.
should be ok to work on any time frame... also the EA should be able to be backtested before going live.
I am small trader willing to start to make an extra income from the new found subject of forex trading and I am very hard time financially, very tight condition so please give me affordable pricing.
I'm attaching the picture here as an example.
I'm attaching the picture here as an example.
応答済み
1
評価
プロジェクト
867
48%
仲裁
29
38%
/
17%
期限切れ
63
7%
仕事中
2
評価
プロジェクト
218
50%
仲裁
6
17%
/
67%
期限切れ
11
5%
暇
3
評価
プロジェクト
117
67%
仲裁
16
25%
/
13%
期限切れ
12
10%
暇
パブリッシュした人: 2 codes
プロジェクト情報
予算
20 USD
締め切り
最低 1 最高 5 日