仕事が完了した
指定
Requirement:
This is a simple indicator that draws horizontal lines on the chart.
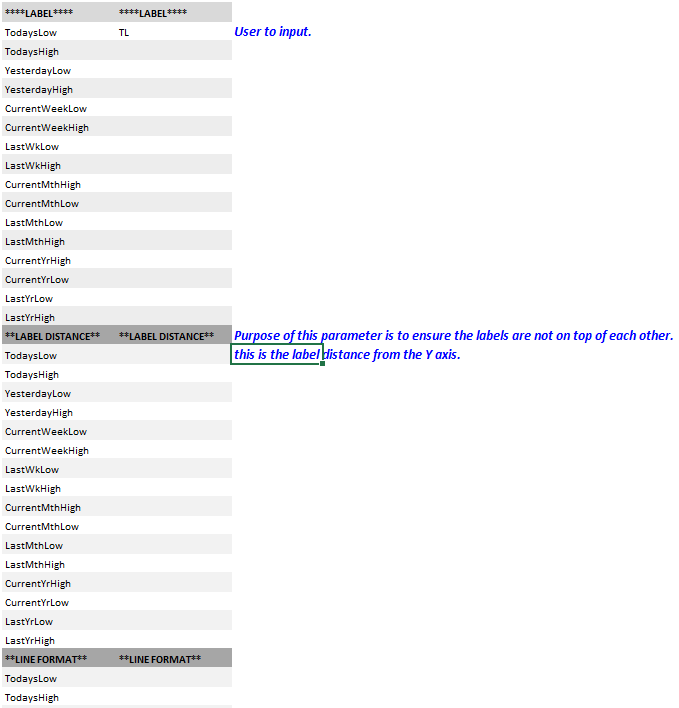
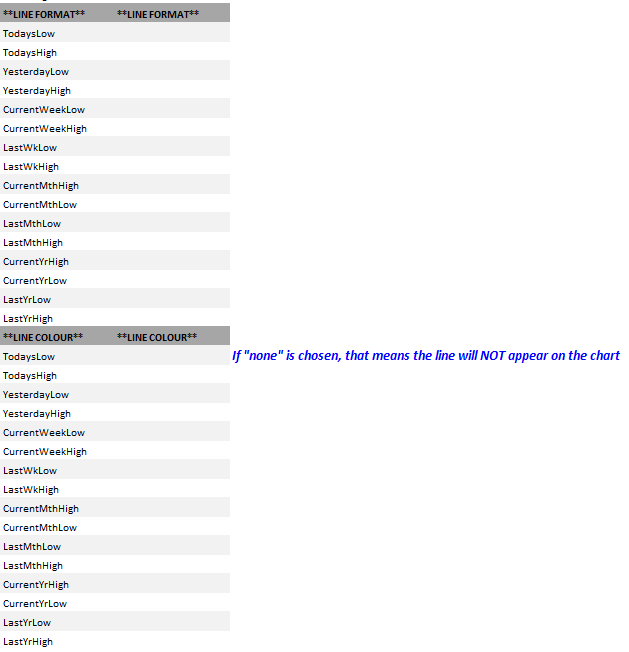
Horizontal lines are for:
1.Todays High
2.Todays Low
3. Yday High
4. Yday Low
5. Current Week High
6. Current Week Low
7. Previous Week High
8. Previous Week Low
9. Current Month High
10. Current Month Low
11. Previous Month High
12. Previous Month Low
13. Current Year High
14. Current Year Low.
15. Previous year High
16. Previous Year Low
Users give a name to each line and the name should appear on top of the horizontal line close to the y axis where the price is.
Labels cannot fall on top of each other. Please also add the following fields:
**FONT FORMAT**
Font
FontSize
Font colours will be the same as the line colours.
Please see attached parameters. I have broken it into 2 pages because it will be too small if I show you in one page.