 すべての注文
 ルール
仕事が完了した
実行時間5 日

開発者からのフィードバック
Thank you
指定
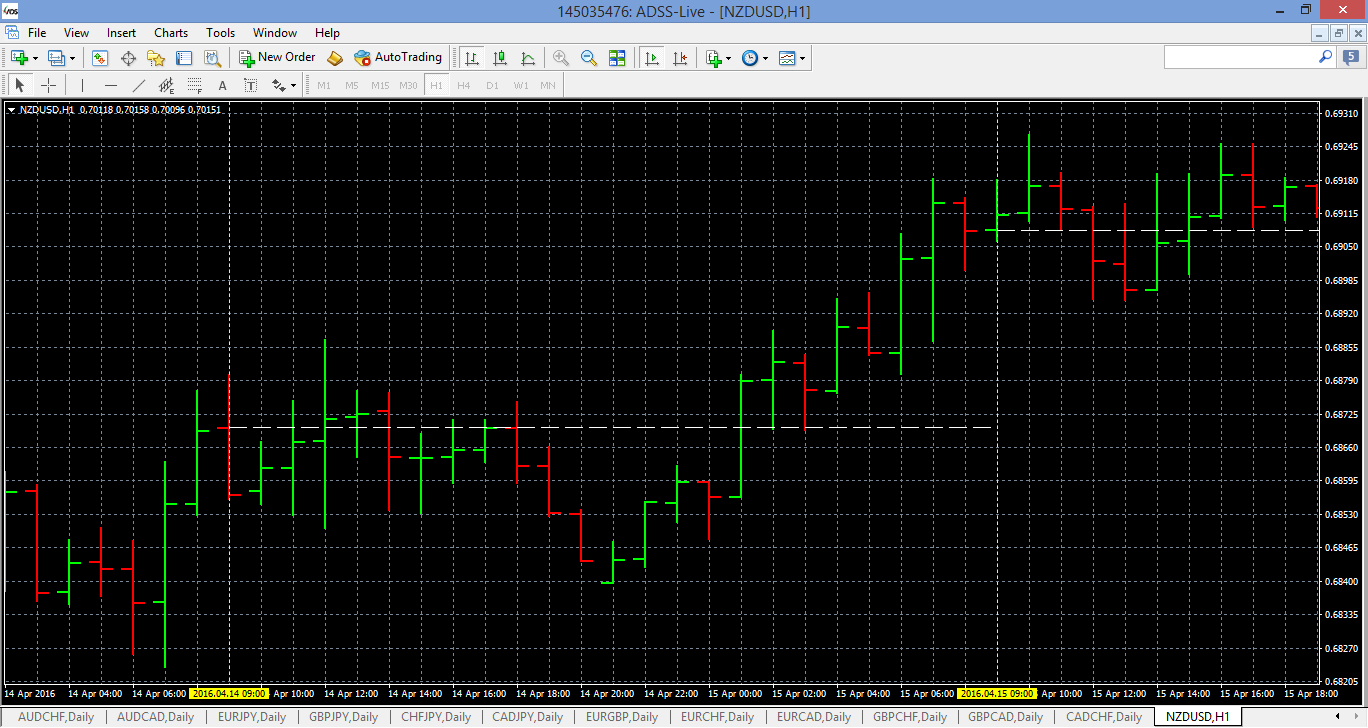
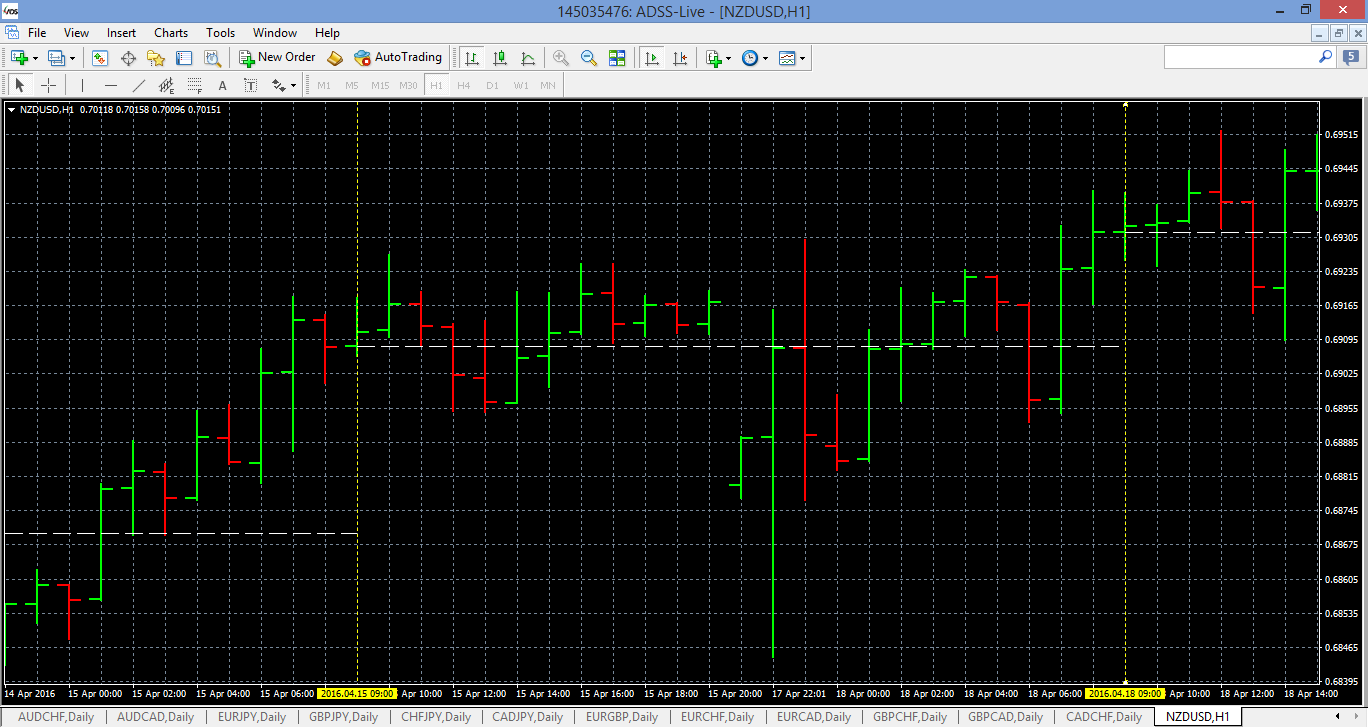
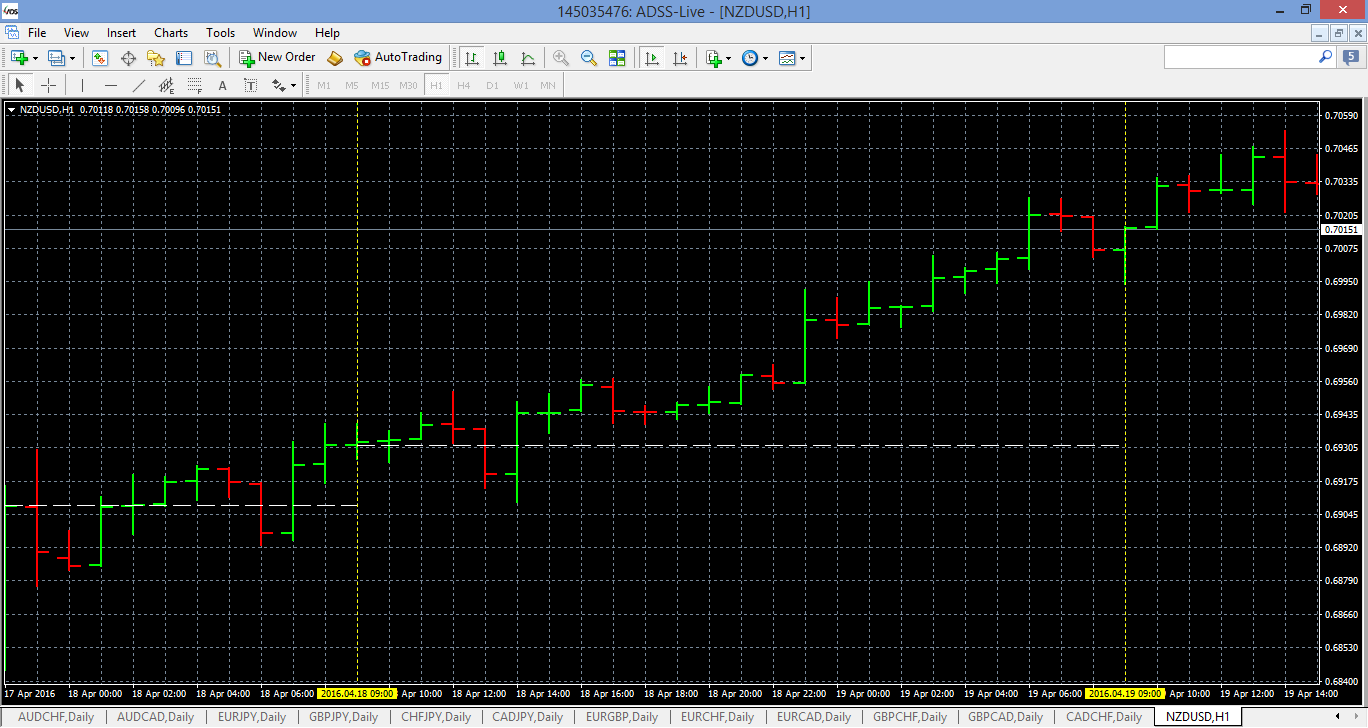
script will work offline for a currency pair to draw Vertical lines (yellow dotted) for a range of dates
at a specific time and a horizontal trend line (white dashed) at the open price of the designated time
Date range and specified time to be given as inputs
Attached is an example of what the output will look like
at a specific time and a horizontal trend line (white dashed) at the open price of the designated time
Date range and specified time to be given as inputs
Attached is an example of what the output will look like
応答済み
1
評価
プロジェクト
342
42%
仲裁
118
12%
/
73%
期限切れ
104
30%
暇
パブリッシュした人: 4 codes
2
評価
プロジェクト
396
28%
仲裁
70
19%
/
49%
期限切れ
121
31%
暇
プロジェクト情報
予算
10 - 15 USD
締め切り
最低 1 最高 2 日