I have a script which takes 'before' and 'after' photos of charts.
It does this by recreating a chart, moving to a particular time, then saving an image.
Then recreating more of the chart, and saving another image. So a before and after picture, Image A, and Image B (which is A + future action).
The start date, interval and 'rolling window' (i.e. how much time to skip) can be altered.
All of this functions with the following limitations which I would like to be fixed:
(1) Sometimes (around once every 3-4 loops) it produces a 'black' chart for some images.
(2) Because of some irritating scaling / anchoring feature of MT5, it does not 'anchor' the most recent candle on the 'before' chart to the centre of the chart image. What this means is that if the 'after' image is going to end up much higher up, it tends to anchor either the first or last candle in the 'before' image very low down.
This defeats the object of the taking of the images, as I want to practice 'what happens next' scenarios without any clues.
ONLY bid on this job if (A) it makes total sense to you what I wrote above; (B) you know there actually is a solution to the issue.
Unfortunately, I will AUTOMATICALLY REJECT bids which are (i) 'a business card for services' or (ii) zero communication bids.
To summarise, I need a fix for the issue of failing to re-create the charts / move back to the correct point in history sometimes.
And I'd like for the 'A' image and the 'B' image to anchor the ENDTIME of A to the centre of each chart image.
Here is an example from the script output:
IMAGE A:
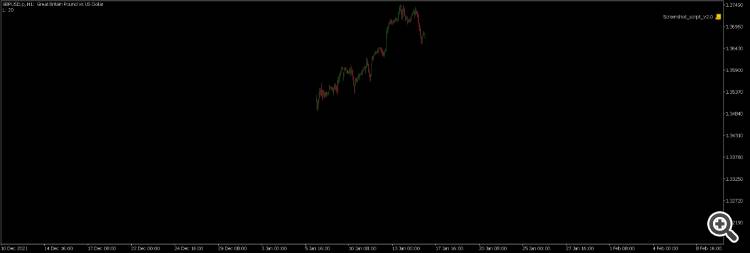
IMAGE B:
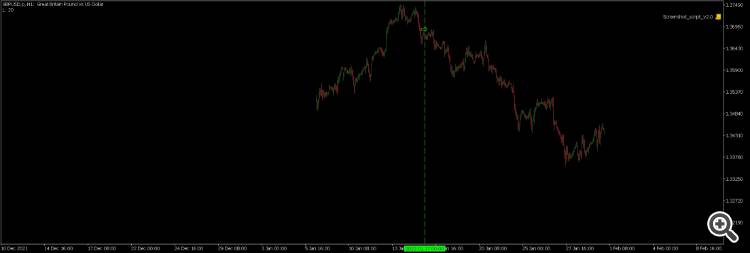
This is fine, but as you can see, the last candle in image A is anchored somewhere near the top (probably because the beginning is anchored at the centre), that means it is obvious from A that B will be downward. I want to anchor to the centre based on the LAST candle in image A (known as endtime1 in the script).
I'd also like some way of scaling the outputs so that in most cases, the chart is scaled to fit on the screen.
類似した注文
max amount grid step for magic number do keep deleting .only when it is in negative floating .but when it is profit allow to go over the max and replays to grid step
Apply with a screen of your work . Symbol Specific Logic . Live Chart Optimization Check the Core logic . [back tests as well] Change points to pips . Create buffer for the zone
I will pay 3000+ USD (negotiable) for an EA for existing MT5 that generates a minimum of 15-20% or higher a month consistently (provide source code after final deal) Looking for a highly profitable EA Please send demo version directly subject (Buying profitable EA Budget up to $ 3000 USD), past results and optimal settings so I can test, if it performs in a strategy tester i will also need option to forward test it
Hello, I need an already developed EA similar to the one trading XAUUSD, with consistent entries and good risk management. Before we proceed, I would like to verify its performance. Please provide a live or demo account login along with the investor (read-only) password so I can monitor the trading results. I am looking for stable performance, controlled drawdown, and consistent profit on gold (XAUUSD). Once I
The strategy records the highest and lowest prices within a specified duration (default 15 minutes) after the New York market opens, forming the opening range. Post-Formation Breakout: When the price breaks above or below the opening range after its formation, it may indicate the direction of the day’s price movement. Trend Confirmation: The strategy uses two EMAs (default 20-period and 50-period) as trend filters to
Tengo una estrategia basada en divergencia para el oro sobre todo en tf m1 Basado en divergencia con stoch .. confirmando la entrada con ciertos parameteos de entrada Es mejor conversarlo para dar mejor los detalles Cuando entrar, porque o todas las divergencias se debe tomar para entrar en compras o ventas He adjuntado un ejemplo La confrmacion más exacta es el cruce de esos parámetros de stoch edebajo de level de
BUY ALERT 1. Supertrend turns Bullish 2. On this candle , or during the last time Supertrend was Bearish, price was < or = MA1 3. On this candle , or during the last time Supertrend was Bearish , BBStops is Bearish 4. STEP MA1 and STEP MA 2 are both Bullish SELL ALERT 1. Supertrend turns Bearish 2. On this candle , or during the last time Supertrend was Bullish, price was
You need to create an EA that executes buy and sell based on the signals of an rsi divergence indicator in trading view. The indicator is not in MT5 and must be added separately. pine script availabel
I WANT A TRADING ROBOT WITH GOLD STRATEGY THAT COULD TAKE ME TO 1MILLION$ TODAY,PLEASE KINDLY GENERATE THE BOT, DEBUGG COMPILE AND THEN GIVE ME WHEN EVER YOU ARE READY, ILL BE WAITING THANK YOU

