Fixing Fib levels and trendlines

指定

I am seeking assistance with an MT5 indicator that I am currently using. The indicator is a multi-timeframe (MTF) zigzag with Fibonacci levels. When I load the indicator multiple times on the same chart—using both current and different higher timeframes (HTF)—the trendlines and Fibonacci levels do not always display as expected.

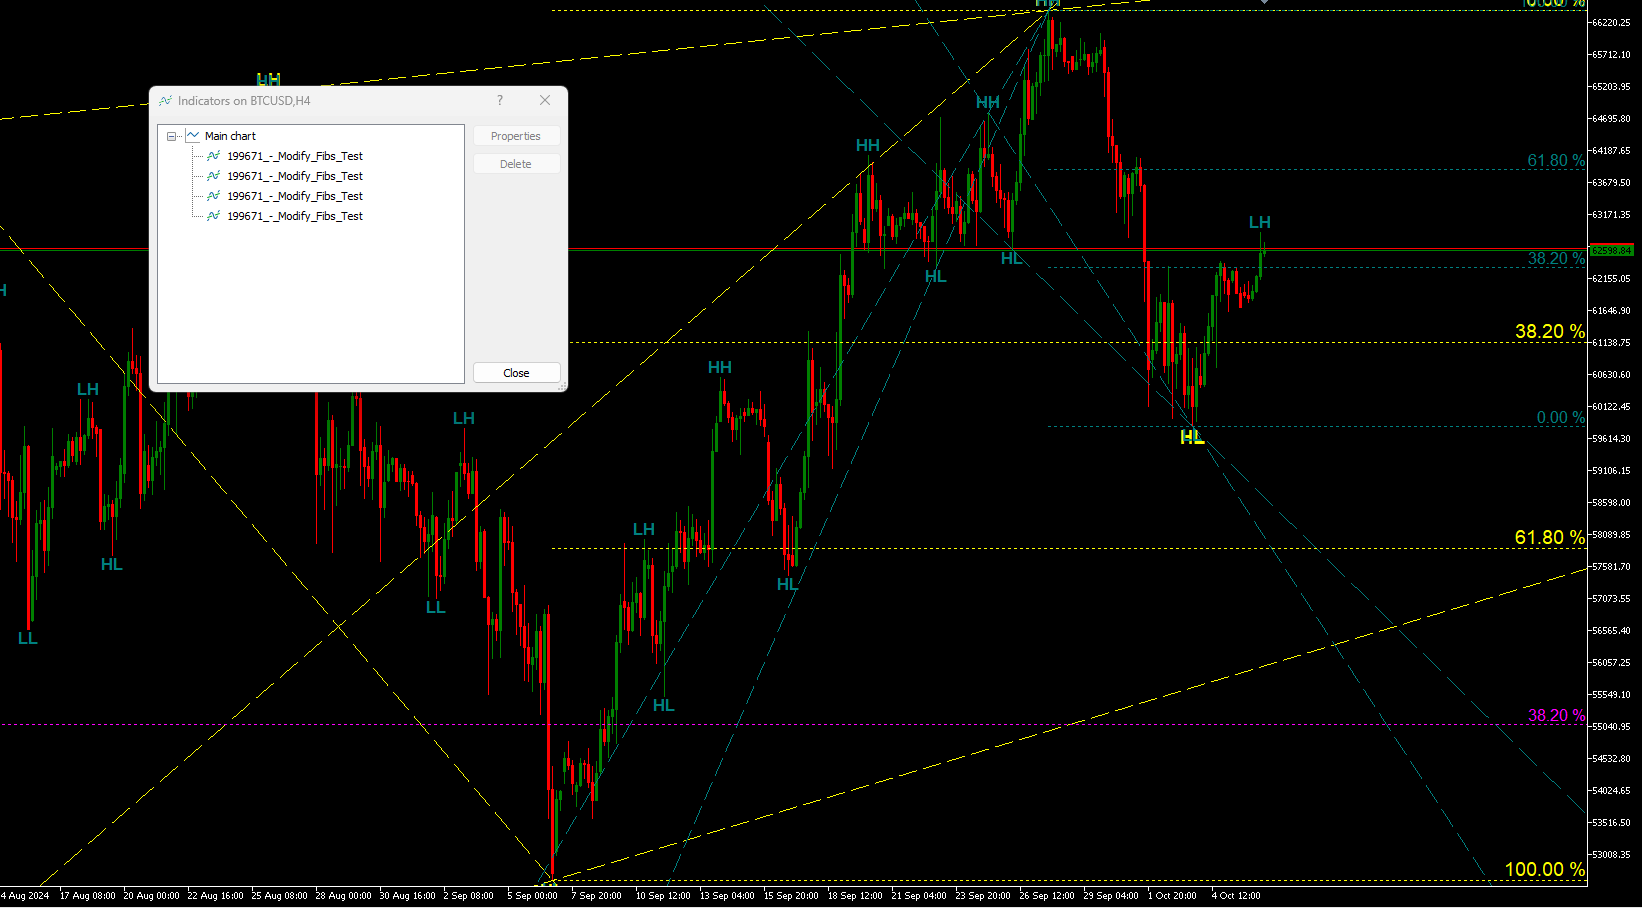
To test the indicator, I have a set file configured with settings for four instances of the indicator, each with a different colour scheme (I will share the set file for your convenience). When I load the set file on the H4 timeframe, I expect to see four distinct sets of Fibonacci levels and trendlines. Similarly, on the D1 timeframe, I expect three sets, as the lower timeframe is overshadowed by the higher one. On the W1 timeframe, there should be two sets, and on the MN1 timeframe, only one set should be visible.

In certain cases, where the zigzag points are closely located, the indicator works as intended. However, this is not consistent. I have added some debug code to troubleshoot the issue. From what I can observe, the indicator recalculates multiple times. Although it seems to calculate correctly at first, subsequent recalculations cause the zigzag pivots to reset to zero. The indicator appears to be performing unnecessary calculations for zigzag points that are irrelevant, which could potentially be excluded. The focus should only be on enough calculations to draw the Fibonacci levels and trendlines for the four timeframes.

Its important to test it on multiple currency pairs as on some duse to zig zag point it might work and then on others not. I need it to work on all pair at all times. This is a requirement.

Here’s how the indicator should ideally function:


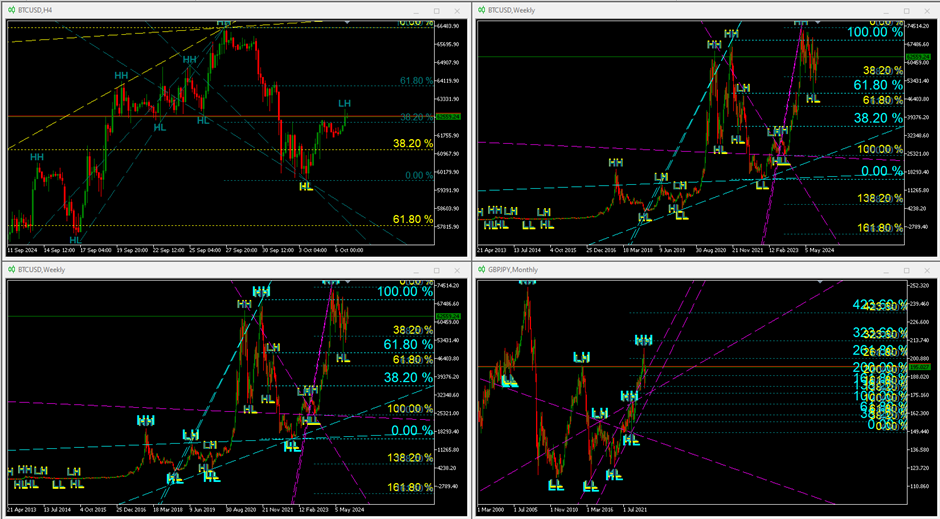
  • H4 timeframe: Four sets of Fibonacci levels and trendlines (In the sample clearly just two)
  • D1 timeframe: Three sets of Fibonacci levels and trendlines
  • W1 timeframe: Two sets of Fibonacci levels and trendlines
  • MN1 timeframe: One set of Fibonacci levels and trendlines

I believe all objects have unique IDs, but it would be helpful if you could verify that the uniqueness is maintained throughout the code. The indicator currently contains approximately 2,200 lines of code. I do not want to lose any of the existing inputs, features, or outputs, as it works for me in its current state—particularly the zigzag functionality, which is exactly as I had requested. However, I would appreciate your help in resolving the aforementioned issues.

I wish for it to work flaulessly please


応答済み

1
開発者 1
評価
(536)
プロジェクト
812
62%
仲裁
33
27% / 45%
期限切れ
23
3%
パブリッシュした人: 1 code
2
開発者 2
評価
(265)
プロジェクト
280
55%
仲裁
0
期限切れ
5
2%
3
開発者 3
評価
(74)
プロジェクト
84
64%
仲裁
5
100% / 0%
期限切れ
9
11%
4
開発者 4
評価
(271)
プロジェクト
553
50%
仲裁
57
40% / 37%
期限切れ
227
41%
仕事中
5
開発者 5
評価
(43)
プロジェクト
62
23%
仲裁
8
25% / 38%
期限切れ
10
16%
仕事中
6
開発者 6
評価
(4)
プロジェクト
3
0%
仲裁
3
33% / 67%
期限切れ
1
33%
7
開発者 7
評価
(1)
プロジェクト
2
0%
仲裁
2
50% / 50%
期限切れ
0
8
開発者 8
評価
(558)
プロジェクト
645
33%
仲裁
41
41% / 46%
期限切れ
11
2%
多忙
類似した注文
Eu preciso disso. A linha central do TMA (17,5,1.5) será a principal referência. Outra linha de média móvel (AVG) de 3 períodos decrescentes 2. As ordens serão as seguintes: abaixo, somente compra de TMA; acima, somente venda de TMA. O sinal de entrada será o seguinte: se o preço estiver acima da Média Móvel Tarifária (TMA), será apenas para venda; quando o preço se mantiver abaixo da Média Móvel Tarifária (AVG)
I am looking for non-repainting indicator to run in all sessions for scalping gold , happy to discuss if you have developed such indicators which can show profit and stop loss levels
Hello! I want to buy two indicators: A Support and Resistence Indicator and a Trendline Indicator. Support and Resistence Indicators needs to automatically draws Support and Resistance lines based on High and Low Candle in every time-frame (If possible time-frame needs to be in inputs and choose by me what time-frame i want indicator to draw lines) Trendline Indicator needs to automatically draws Trendline Channels
I already have a fully developed MT5 Expert Advisor with all required prop firm features, including: Risk management Daily loss & max drawdown limits Spread & slippage filters News filter Trade management system The EA structure is complete. 👉 What I need is a professional developer to replace ONLY the entry logic with a high-quality, rule-based trading strategy. 🚨 STRICT REQUIREMENT (READ CAREFULLY): I am NOT
I need an experienced developer to carry out an indicator and trading robot using the following; moving averages risk ( take profit and stop loss) and maximum drawdown limits heiken ashi confirmation. trendline breakout if possible The developer will test this on a demo account that I will provide before conclusion as I don’t want anyone to waste my time trying to use chartgpt trial and error. If you can do the
Hi, Before ordering, I want to verify the quality of your ICT/SMC logic. Do you have an existing indicator or strategy (your own work) that I can test on TradingView? If yes, please provide: 1. A demo (invite-only script or video) 2. Proof it is NON-repainting (explained clearly) 3. Live or replay demonstration (not static screenshots) Specifically I want to see: * Clean swing structure (no consecutive highs/lows) *
Project Overview ​I am looking for a high-level Algorithmic Trader / Developer to build a sophisticated, fully automated scalping system for the Nasdaq-100 Future (NQ) . The system must integrate institutional order flow logic with market structure analysis. ​The core logic must be written in Python , acting as a central hub that bridges ATAS (as the primary data source for Order Flow) and MetaTrader 5 (as the
Società di investimento con attività tra Sanremo e Monaco ricerca un giovane collaboratore con esperienza nell’utilizzo avanzato di MetaTrader 5. Si richiede la conoscenza della lingua ITALIANA e INGLESE. Si richiede una chiamata conoscitiva. Il collaboratore si occuperà di: • eseguire backtest di strategie di trading su MT5 • effettuare ottimizzazioni parametri tramite Strategy Tester • analizzare risultati e
#property indicator_chart_window #property indicator_buffers 2 #property indicator_plots 2 #property indicator_type1 DRAW_ARROW #property indicator_color1 Blue #property indicator_label1 "Buy Signal" #property indicator_type2 DRAW_ARROW #property indicator_color2 Red #property indicator_label2 "Sell Signal" double BuyBuffer[]; double SellBuffer[]; input int MA_Period = 50; input int RSI_Period = 14; int maHandle;
Need Python developer to use MetaApi.cloud Python API (ready SDK) to build a real-time equity curve chart. Project is simple and details will be shared privately. Only apply if you have strong Python experience

プロジェクト情報

予算
100 - 120 USD
締め切り
最高 3 日