Hello Coding Wizards.
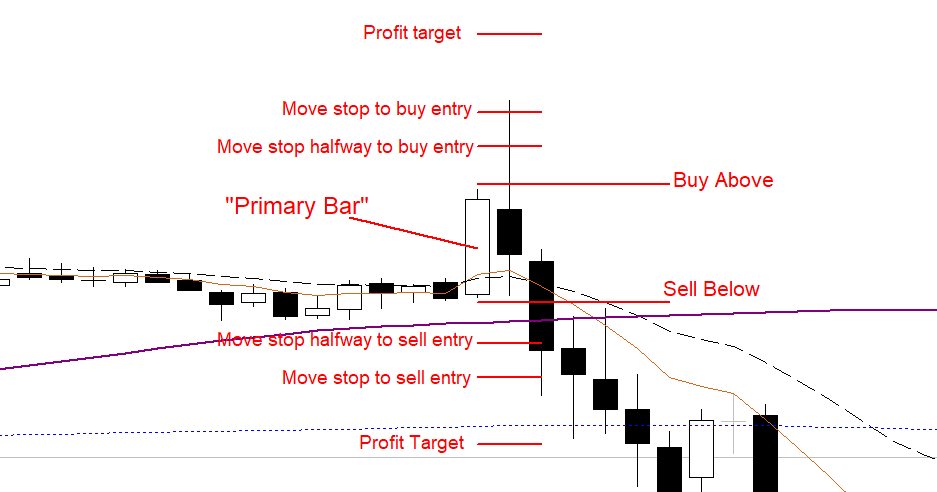
I need an EA that places pending buy above / sell below orders on a specific bar as it closes. Stop loss orders for both pending orders are on opposite ends of the bar. It needs to have fast execution speed with functions as follows;
Position size based on X % risk of account balance.
Works on whatever chart the EA is active on.
Identification of "Primary Bar" based on server time entered manually.
Optional addition of X number of prior bars in H/L range calculation (0-9).
Addition of X points to allow for spread/buffer beyond primary bar high/ low.
Optional ''One cancels other order'' (OCO) function, deleting other pending order when one is triggered.
Optional Cancel all pending orders after X number of bars (0-9).
Optional Set profit target in X points.
Optional Move stop to half initial range/dollar risk when X points in profit.
Optional Move stop to original entry level when X points in profit.
See attached for concept diagram.
類似した注文
Sierra Chart Alerts to MT5 via Webhook (Alert Manager File Version) Objective: Create a Custom Study (ACSIL / C++) that monitors alerts from the Alert Manager file and forwards any valid alert directly to MT5 via an HTTP POST (Webhook) in JSON format. Additional Note: The study should allow adding any modifications in the future and provide clear insights into the alert points in Sierra Chart. 1. Data Flow Diagram
I am looking for an experienced MQL4/MQL5 developer to build a custom MT4 indicator from scratch or cracking my ex4 file that i provide to you. I already have an existing indicator (EX4) which produces highly accurate buy/sell signals. I want a similar indicator developed based on its observable behavior and signal structure. my existing indicator is pc id protected so you have to do PC ID security bypass and source
The Relative Strength Index (RSI) is a technical momentum indicator measuring the speed and change of price movements, scaled from 0 to 100 to identify overbought (>70) or oversold (<30) conditions. Developed by J. Welles Wilder Jr., it helps traders spot potential trend reversals or corrections.Imagine a stock, XYZ, is trending upwards.Overbought Signal: The price increases sharply, and the RSI rises to 75. This