Top Bottom Finder

仕事が完了した

実行時間2 日
依頼者からのフィードバック
very good effort and delivery was fast! well recommended up and coming developer to go to
開発者からのフィードバック
The most professional and experienced communication member i have met.

指定

Looking to develop an indicator that plots line for every distinct high/lows. Upon successfully plotting, the lines shall be drawn and extended until encountering a new candle in the future. 2 scenarios can happen here:

a) the line meets a candle that engulfs through the line, in this case the line shall stop there.

b) the line meets and get "wicked" by another distinct high/low and in this case, the line shall stop there as well. For highs, rename and display name of the line as (ChartTimeframe + " Topped"). the name shall be display above the line. For lows, rename as (ChartTimeframe + " Bottomed"). The name shall be displayed below the lines. NOTE: only display the names for this scenario. Do not show name when it meets another candle.

Finally, a line delete function that deletes all the lines except for scenario B.

The attached indicator contains ALL The source code for all the function above, so it is merely a copy/paste + some very simple structuring of the code. 


This indicator, upon attached to a chart, can be activated by pressing "Q", and clicking onto any area of the chart. What it does is, from the place you clicked, the period is derived and the lines shall be drawn 200 candles to the left. What i would be expecting is using the same source code, use "Q" as drawing lines and use "W" as deletion unnecessary lines(scenario A). Feel free to play around with the indicator. Source code shall be provided for selected programmer. 


Image A showing example of what would happen when "Q" is pressed and clicked onto a chart

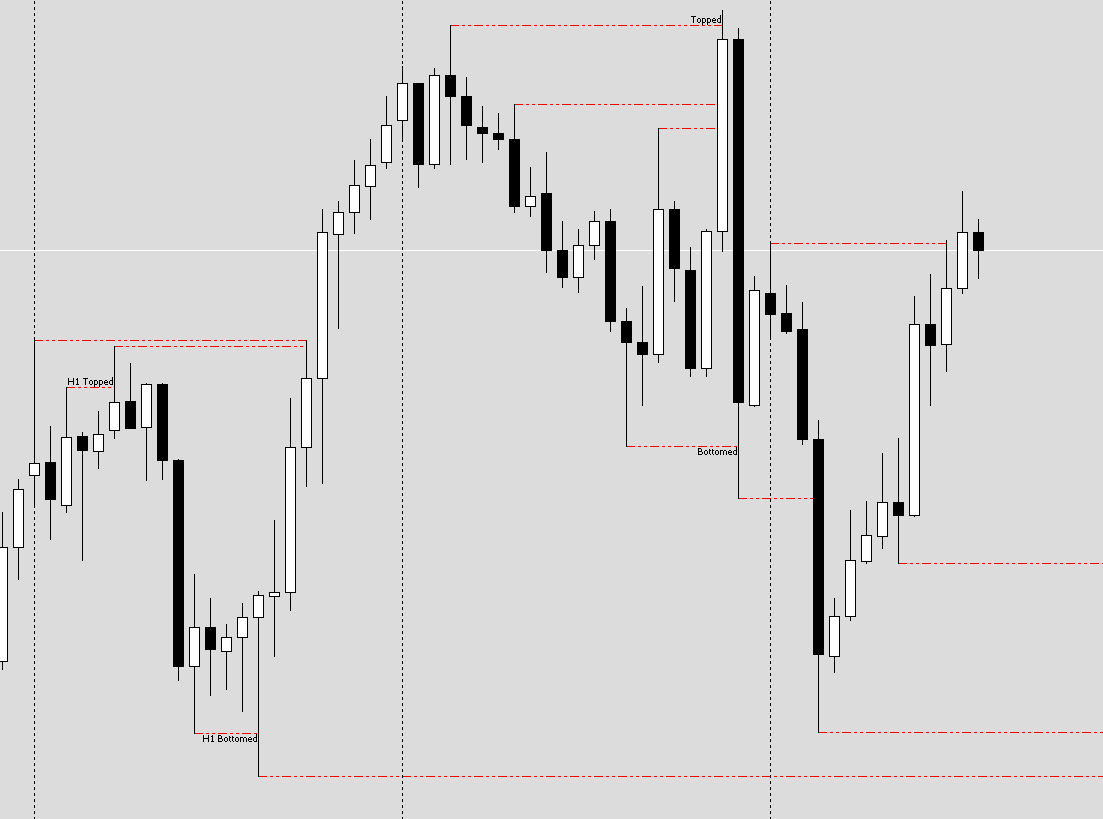
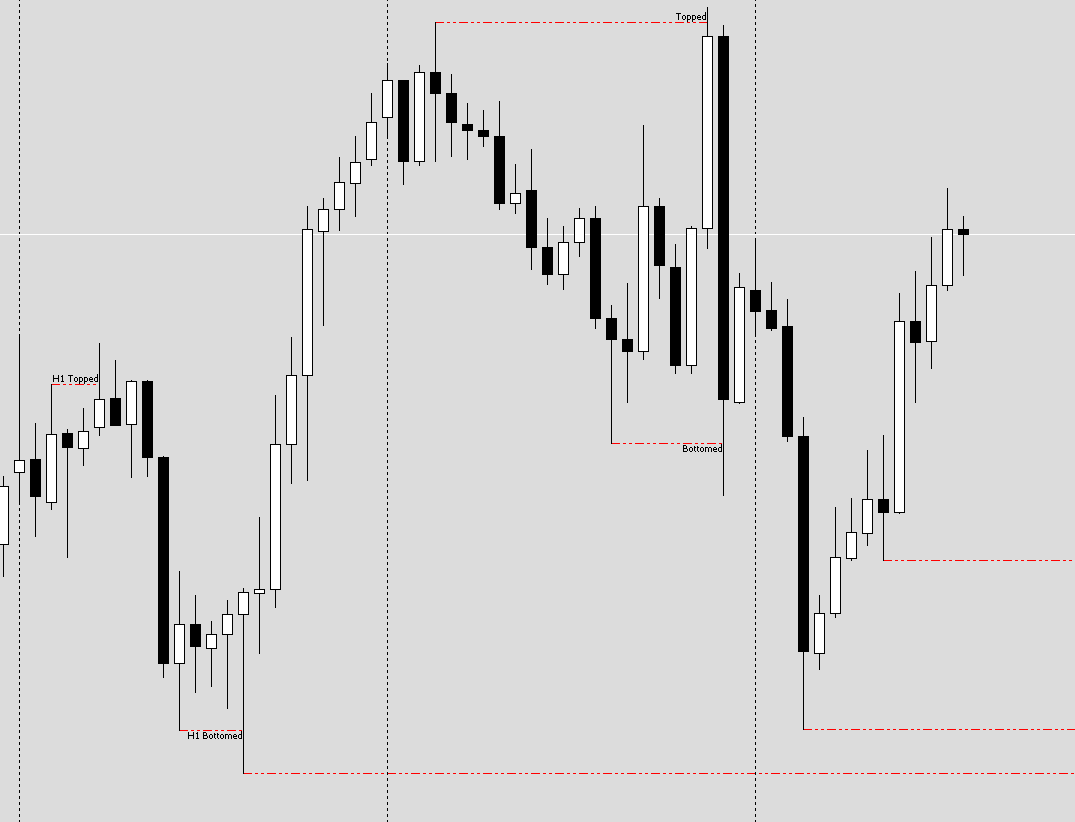
Image B showing what it should looked like upon pressing "W" and clicked onto the chart. Do note that lines that have yet to encounter any candles in the future shall remain extended.


As emphasized, source code is provided upon being selected. But pls download and play around the indicator to have a feel on it. The current indicator does not have the "encountering" a candle logic yet. But the checks for distinct high/low wicking another distinct high/low is in place already. The code for pressing a keystroke and clicking on chart is also made available for you to use

ファイル:

EX5
TBFinder.ex5
13.6 Kb

応答済み

1
開発者 1
評価
(13)
プロジェクト
18
11%
仲裁
6
33% / 67%
期限切れ
1
6%
パブリッシュした人: 1 code
2
開発者 2
評価
プロジェクト
0
0%
仲裁
0
期限切れ
0
類似した注文
#property indicator_chart_window #property indicator_buffers 2 #property indicator_plots 2 #property indicator_type1 DRAW_ARROW #property indicator_color1 Blue #property indicator_label1 "Buy Signal" #property indicator_type2 DRAW_ARROW #property indicator_color2 Red #property indicator_label2 "Sell Signal" double BuyBuffer[]; double SellBuffer[]; input int MA_Period = 50; input int RSI_Period = 14; int maHandle;
Need Python developer to use MetaApi.cloud Python API (ready SDK) to build a real-time equity curve chart. Project is simple and details will be shared privately. Only apply if you have strong Python experience
A robot 30+ USD
Code pour créer un robot //+------------------------------------------------------------------+ #include <Trade/Trade.mqh> CTrade trade; // SYMBOLS string symbols[3] = {"Volatility 10 Index","Volatility 25 Index","Volatility 75 Index"}; string bestSymbol = ""; // VARIABLES double startBalance; int tradeCount = 0; int lossStreak = 0; bool tradingStopped = false; bool profitMode = false; datetime lastDay; // PARAMÈTRES
I need someone to recreate this indicator for mt5 for $60 it has to be non repaint ,I've been trying to code this indicator so if someone can do it my contact is , sebokomorobi6@gmail.com ,or 073 923 0151 you can contact the number on Whatsapp no calls allowed
Hi Im working with a Crypto trading company and we want to branch out with our indicator, i'm researching the bot automation and need some hands on board. i i want to hear your opinion about the indicator that i would like you to build. in the PDF i explain the whole indicator and how it need to look like. happy to hear form you
I want someone to hold a session for me and explain in details on how to implement them in. I would really appreciate your guidance on how to properly set up GoCharting and get access to CME futures data
When the super trend changes from buy to sell and crosses the fast moving average and the 200 moving average is above the price, send email notification and/or sms (text) to sell . When the super trend change from sell to buy and crosses the fast moving average and the 200 moving average is below the price, send email notification and /or sms (text) to buy. Please note that there are two moving averages(fast and
Hola comunidad, Estoy buscando un desarrollador que tenga el archivo de instalación de MetaTrader 4 build 1443 o que pueda ayudarme a volver a esa versión. Tengo un robot (EA) que funcionaba perfectamente en build 1443, pero mi plataforma se actualizó automáticamente a build 1470 y ahora el robot ya no funciona correctamente. Necesito alguien que: • Tenga el instalador de MT4 build 1443, o • Sepa cómo reinstalar esa
have the Beatrix Inventor Expert Advisor (EA) that was profitable in the past but has been losing money recently. I need an experienced EA developer/optimizer to study the trade history (especially Stop Loss hits, drawdown periods, SL/TP behavior, win/loss ratio, etc.) and recommend + implement specific tweaks so it becomes consistently profitable again. Your job: 1. Deep analysis of why the EA is no longer
حلل لي اصل مالي ) اكتب هنا مثلا XAU EUR USD USD اريد تحليلا تعليما و ليس توصية مالية ۱- نوع التحليل المطلوب : ( فني / اساسي / سلوك سعري ) ٢ - المدي الزمني : ( قصير / متوسط / طويل ) M15 / H1 / H4 / ) اذكر الفريمات المطلوبه + (D1 ما اريد استخراجه من التحليل : الاتجاه العام اقوي مستويات دعم و مقاومة رقمية سيناريو صعود و سيناريو هبوط مع شروط كل سيناريو ( IF / THEN ) اين يصبح السيناريو لاغيا مناطق دخول و خروج تعليمية (

プロジェクト情報

予算
30+ USD