スピーディに自動売買ロボットを注文する方法を見る
注文を投稿するまたは受注する前にルールをご覧ください。
MQL5およびMQL4で自動売買ロボットを注文する方法
ロボットを注文するにはサンプル要件仕様をご覧ください
カテゴリでの新規注文:
30 - 1000 USD
100+ USD
30+ USD
30+ USD
30+ USD
30+ USD
仕事が完了した
実行時間6 日
依頼者からのフィードバック
Great developer, he was able to work diligently with my request. I will use his services again. Thanks
開発者からのフィードバック
Nice client recommended to work with A+++
指定
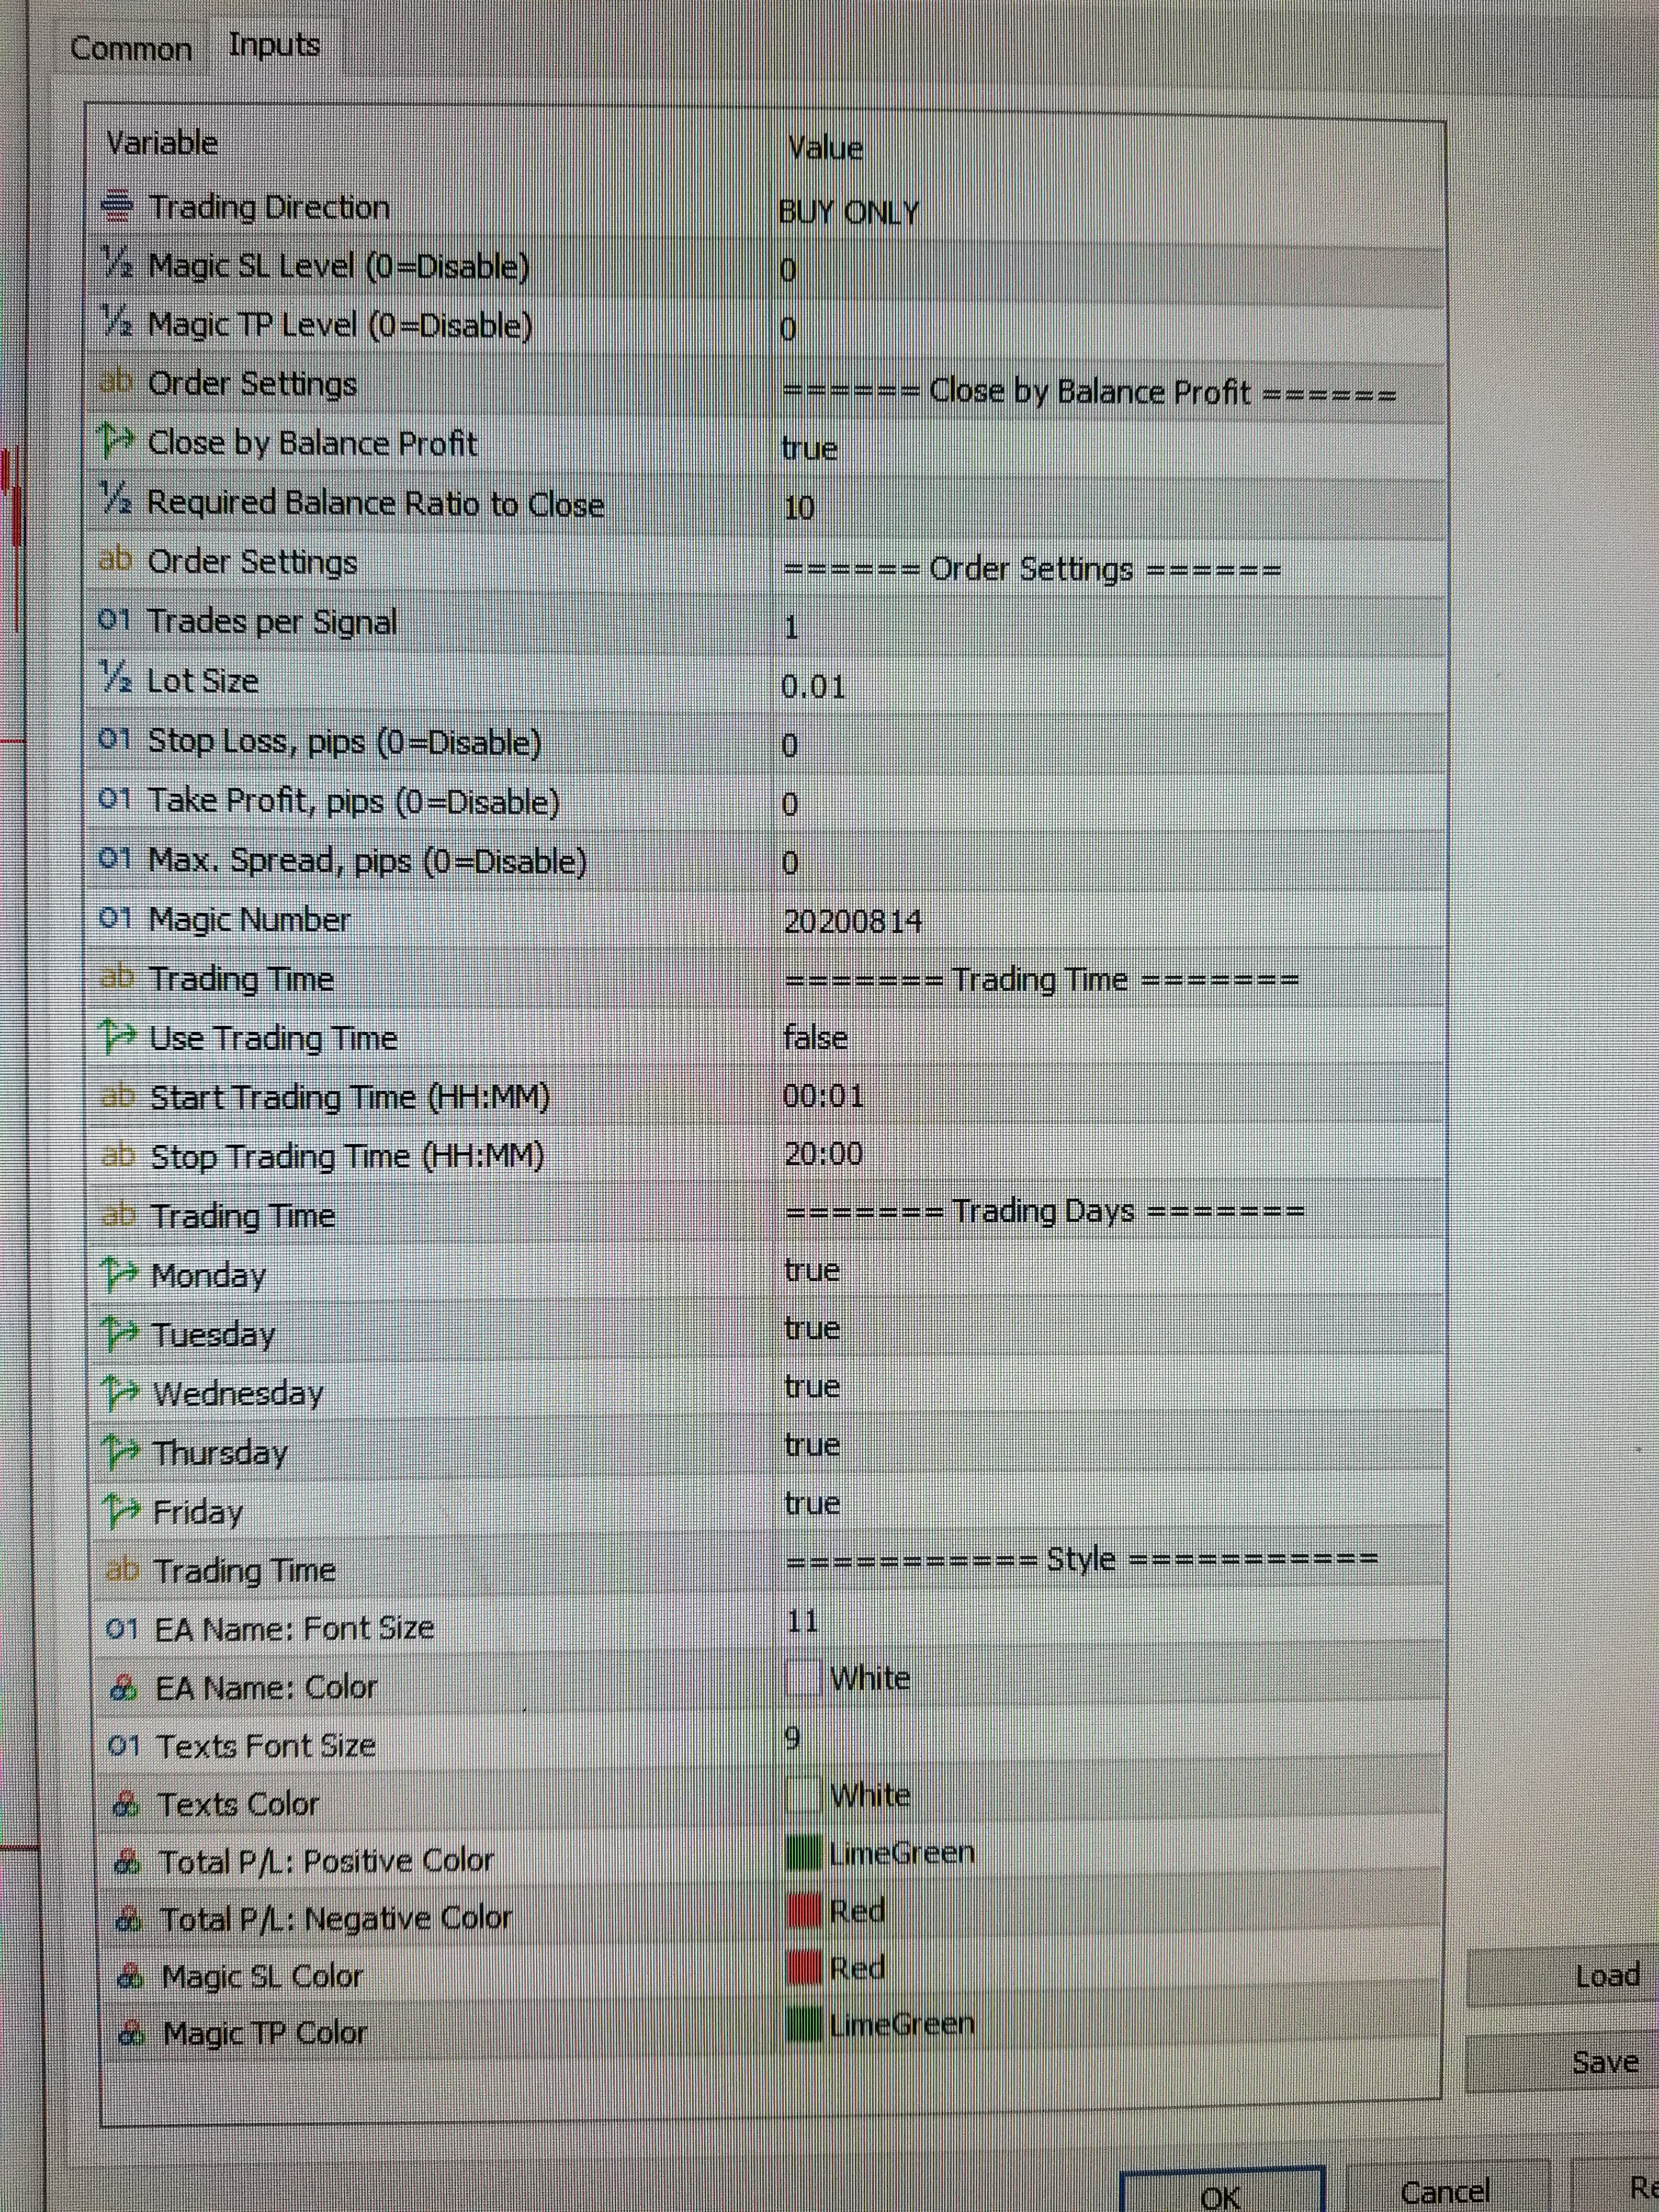
Hello, Looking for an EA trading robot that is based on candle stick open and close. The EA parameters will include the choice of choosing BUY or SELL, for example, If I chose buy signal on the EA parameter and also chose the number of trades to open, the robot will only open trades once the bull candle is closed on the buy signal I chose from the EA parameter, and will only continue to open buy at every subsequent closed Bull candle, and ignore sell/ bear candle, not to open. for example, if I chose buy, the robot will only open buy candle after a bull candle is closed, and continue to only open buy trade only after each bull candle is closed, it will not open bear/sell candle in that direction because I only chose buy signal from the parameter at the start of the robot. The reverse will be the case if I chose SELL signal from the parameter at the start of trading the robot, it will only open sell/bear candle once the bearish candle is closed, and continue opening sell candle for each closed bearish candle. It will not open Bull candle in this direction because I chose sell signal from the parameter at the beginning of trading the EA.
The robot will include TP, SL, Maximum spread filter, Time and Date filter, Global SL and TP level that close all trades if the global TP or SL is reached. The robot should also show or display overall gain/loss counter on the charts. See the attached file for the parameters required, yo can add or modify as you deem fit, this is just a guide
The robot will include TP, SL, Maximum spread filter, Time and Date filter, Global SL and TP level that close all trades if the global TP or SL is reached. The robot should also show or display overall gain/loss counter on the charts. See the attached file for the parameters required, yo can add or modify as you deem fit, this is just a guide
応答済み
1
評価
プロジェクト
66
12%
仲裁
12
58%
/
42%
期限切れ
1
2%
暇
2
評価
プロジェクト
218
30%
仲裁
4
50%
/
25%
期限切れ
5
2%
暇
パブリッシュした人: 1 code
3
評価
プロジェクト
202
48%
仲裁
5
20%
/
60%
期限切れ
2
1%
暇
4
評価
プロジェクト
1461
72%
仲裁
122
29%
/
48%
期限切れ
356
24%
仕事中
パブリッシュした人: 3 articles
5
評価
プロジェクト
0
0%
仲裁
2
0%
/
100%
期限切れ
0
暇
6
評価
プロジェクト
6
17%
仲裁
3
0%
/
100%
期限切れ
0
暇
7
評価
プロジェクト
552
53%
仲裁
13
69%
/
15%
期限切れ
3
1%
暇
8
評価
プロジェクト
3407
68%
仲裁
77
48%
/
14%
期限切れ
342
10%
暇
パブリッシュした人: 1 code
9
評価
プロジェクト
91
25%
仲裁
26
19%
/
54%
期限切れ
25
27%
暇
10
評価
プロジェクト
2937
63%
仲裁
124
44%
/
26%
期限切れ
429
15%
暇
類似した注文
Need an already built EA with proven track record
30 - 1000 USD
Hello I need to purchase the source code of an already built profitable mt5 EA with proven track recordIf you have something similar and you are open to selling the source code please apply to this post Please note I am not looking for a dev to build the product from scratch , but need something that is already built and have at least one year worth of track record
I need an Expert Advisor for MT5 on XAUUSD 1min timeframe using SMC concepts. STRATEGY RULES: SELL: 1. Identify previous day High/Low as liquidity 2. Entry only during London-NY session: 15:00-19:00 GMT+3 or broker clock. 3. If price sweeps previous day High and closes back below it 4. Check for bearish 1min FVG below sweep candle 5. Wait for BOS - lower low 6. Entry: Sell/buy at 50% of the FVG 7. SL: 10 pips above
Code An Loss Rate 90-100% MT5 EA , that can blow a 100 USD account a day ,with fixed TP of 3000 points and SL of 3000 For better Rate Calculations get an strategy that can lead to so
Shooter razor
30+ USD
Makes it takes trades by it self buy and sell, it must use the higher signals, also when I press stop it must not pick any trades I want it to take trades automatically when I press start also close by it self
8 cap prop firm passing
30 - 3000 USD
I am looking for an experienced MQL4/MQL5 HFT developer to build or optimize a High-Frequency Trading (HFT) Expert Advisor that can successfully pass proprietary trading firm challenges and perform consistently under live trading conditions with brokers such as 8cap or BlackBull Markets . The developer should have proven experience with HFT execution, ultra-low-latency trading, broker execution, slippage, spreads
I need a professional MT5 Expert Advisor (MQL5) for XAU/USD (Gold) only. Requirements: - Symbol: XAU/USD only - Timeframe: H1 trend, M5 entry - Smart Money Concept (SMC) - Liquidity Sweep - Break of Structure (BOS) - Order Block Retest - Confirmation Candle (Engulfing or Pin Bar) - ATR-based Stop Loss - Risk:Reward = 1:3 (adjustable) - Auto Lot (1% risk) - Break Even - Trailing Stop - Maximum 2 trades per day - One
MT4/MT5 HFT EA Live Trading
40 - 10000 USD
I have a High-Frequency Trading (HFT) Expert Advisor for both MT4 and MT5 designed primarily for US30 (Dow Jones Index) . The EA performs consistently and profitably on demo accounts, but when I run it on an IC Markets Raw or Standard live account, it starts generating losses under what appear to be the same trading conditions. At this time, I cannot provide the source code (.mq4/.mq5). I can only provide the
I need an Expert Advisor for MT5 on XAUUSD 1min timeframe using SMC concepts. STRATEGY RULES: SELL: 1. Identify previous day High/Low as liquidity 2. Entry only during London-NY session: 15:00-19:00 GMT+3 3. If price sweeps previous day High and closes back below it 4. Check for bearish 1min FVG below sweep candle 5. Wait for BOS - lower low 6. Entry: Sell at 50% of the FVG 7. SL: 10 pips above sweep wick 8. TP: 2R
Hello looking for someone to convert an indicator from tradingview to Thinkorswim I have attached the codes from trading view Also, I like make it trigger (alert) a one-time alert when the trend changes, and can also create a custom watchlist column that flags symbols currently in a new trend so you can scan multiple stocks easily. And like the watchlist to show only fresh trend changes or the current trend direction
Fundamental News Trading Strategy
50 - 200 USD
I want to build a fundamental news trading bot that trade off economic news data, as we know every economic news data released always have effect on the asset associated with it, so this bot will take a trade instantly based on the news data released either to buy or sell, it will come with good money management and also SL and TP target based on price and pips value
プロジェクト情報
予算
50 - 100 USD