 すべての注文
 ルール
ルール
スピーディに自動売買ロボットを注文する方法を見る
注文を投稿するまたは受注する前にルールをご覧ください。
MQL5およびMQL4で自動売買ロボットを注文する方法
ロボットを注文するにはサンプル要件仕様をご覧ください
カテゴリでの新規注文:
30 - 200 USD
指定
Hi
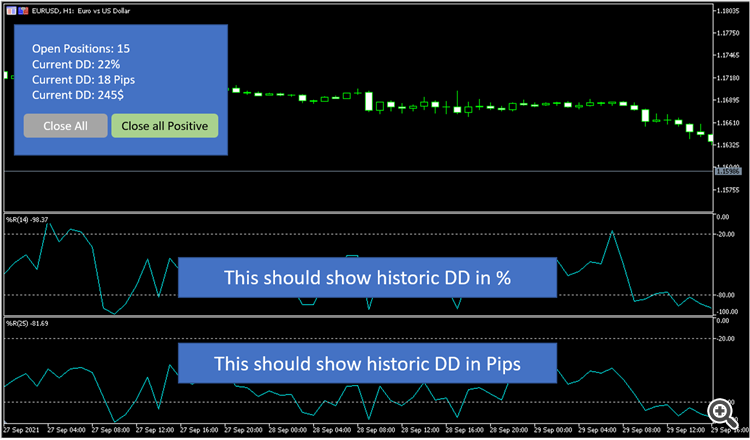
I'd like to have an indicaor (or EA or whatever is necessary) which shows me the the current DD in %, Pips and $ on the left side of a chart plus 3 lines showing the same data based on history (depending on the selected timeframe). Also I'd like to have 2 buttons planed on the chart
1st button: close all open trades
2nd button: close all open trades in the positive (whereas the commission and swap have to be considered)
Thanks
Daniel
応答済み
1
評価
プロジェクト
1735
49%
仲裁
55
67%
/
16%
期限切れ
38
2%
暇
2
評価
プロジェクト
521
47%
仲裁
30
10%
/
47%
期限切れ
139
27%
暇
3
評価
プロジェクト
554
53%
仲裁
13
69%
/
15%
期限切れ
3
1%
暇
4
評価
プロジェクト
1813
61%
仲裁
14
64%
/
7%
期限切れ
84
5%
暇
5
評価
プロジェクト
1127
43%
仲裁
47
49%
/
23%
期限切れ
84
7%
暇
6
評価
プロジェクト
725
34%
仲裁
35
71%
/
9%
期限切れ
23
3%
暇
7
評価
プロジェクト
91
13%
仲裁
34
26%
/
59%
期限切れ
37
41%
暇
プロジェクト情報
予算
30 - 100 USD