すべての注文
 ルール
ルール
仕事が完了した

指定
Dear coders,
we need a Hull Moving Average Indicator (HMA) in MQL5.
The following buffers with certain outputs are needed:
- A trend change - marked by the HMA - needs to be detectable by an output/ buffer of the required indicator.
For instance a switch from a positive slope to a negative slope of the HMA is marked with a "-1" as output.
A switch from a negative slope to a positive slope of the HMA is marked with a "+1" as output. - An uptrend - marked by the HMA - is marked with "+1"
- A downtrend - marked by the HMA - is marked with "-1"
An alternative would be:
- For instance a switch from a positive slope to a negative slope of the HMA is marked by buffer 1.
A switch from a negative slope to a positive slope of the HMA is marked by buffer 2.
- An uptrend - marked by the HMA - is marked by buffer 3.
- A downtrend - marked by the HMA - is marked by buffer 4.
Introduction to the idea behind the HMA
The Hull Moving Average (HMA) attempts to minimize the lag of a traditional moving average while retaining the smoothness of the moving average line. The HMA can be interpreted in a similar way to traditional moving averages, but it responds more quickly. Like other moving averages, it can be used to confirm a trend or spot a change in the trend.
Calculation of the HMA
The formula for the Hull Moving Average uses two different weighted moving averages (WMAs) of price, plus a third WMA to smooth the raw moving average. There are three parts to the calculation. In the formulas listed below, “n” indicates the number of periods specified by the chartist.
First, calculate two WMAs: one with the specified number of periods and one with half the specified number of periods.
WMA1 = WMA(n/2) of price
WMA2 = WMA(n) of price
Second, calculate the raw (non-smoothed) Hull Moving Average.
Raw HMA = (2 * WMA1) - WMA2
Third, smooth the raw HMA with another WMA, this one with the square root of the specified number of periods.
HMA = WMA(sqrt(n)) of Raw HMA
Of course, when you divide a whole number by two or calculate its square root, you don't always end up with a whole number as a result. In that case, we round the result to the nearest whole number, so we can use that as the number of periods when calculating weighted moving averages.
For example, when calculating an 11-day HMA, we end up with non-whole numbers for two of our WMAs. For calculating the n/2 WMA, 11/2 is 5.5, so we would round that up to 6 for the WMA calculation. For the sqrt(n) WMA, the square root of 11 is 3.317, so we would round that down to 3 for the number of WMA periods in the final smoothing calculation.
You can find an exemplary HMA in MQL4 down below (CAUTIOUS: This MQL4 version does not have a buffer, which marks a trend change. BUT we need that in the MQL5 version). However, there you see how the HMA is calculated:
#property indicator_chart_window
#property indicator_buffers 2
#property indicator_color1 Lime
#property indicator_color2 Red
//---- input parameters
extern int       period=15;
extern int       method=3;
extern int       price=0;
//---- buffers
double Uptrend[];
double Dntrend[];
double ExtMapBuffer[];
//+------------------------------------------------------------------+
//| Custom indicator initialization function                         |
//+------------------------------------------------------------------+
int init()
  {
   IndicatorBuffers(3);
   SetIndexBuffer(0, Uptrend);
   //ArraySetAsSeries(Uptrend, true);
   SetIndexBuffer(1, Dntrend);
   //ArraySetAsSeries(Dntrend, true);
   SetIndexBuffer(2, ExtMapBuffer);
   ArraySetAsSeries(ExtMapBuffer, true);
//----
   SetIndexStyle(0,DRAW_LINE,STYLE_SOLID,2);
   SetIndexStyle(1,DRAW_LINE,STYLE_SOLID,2);
//----
   IndicatorShortName("Signal Line("+period+")");
   return(0);
  }
//+------------------------------------------------------------------+
//| Custor indicator deinitialization function                       |
//+------------------------------------------------------------------+
int deinit()
  {
   return(0);
  }
//+------------------------------------------------------------------+
//|                                                                  |
//+------------------------------------------------------------------+
double WMA(int x, int p)
  {
   return(iMA(NULL, 0, p, 0, method, price, x));
  }
//+------------------------------------------------------------------+
//| Custom indicator iteration function                              |
//+------------------------------------------------------------------+
int start()
  {
   int counted_bars=IndicatorCounted();
   if(counted_bars < 0)
      return(-1);
//----
   int x=0;
   int p=MathSqrt(period);
   int e=Bars - counted_bars + period + 1;
//----
   double vect[], trend[];
//----
   if(e > Bars)
      e=Bars;
//----
   ArrayResize(vect, e);
   ArraySetAsSeries(vect, true);
   ArrayResize(trend, e);
   ArraySetAsSeries(trend, true);
//----
   for(x=0; x < e; x++)
     {
      vect[x]=2*WMA(x, period/2) - WMA(x, period);
      }
   for(x=0; x < e-period; x++)
//----
      ExtMapBuffer[x]=iMAOnArray(vect, 0, p, 0, method, x);
   for(x=e-period; x>=0; x--)
     {
      trend[x]=trend[x+1];
      if (ExtMapBuffer[x]> ExtMapBuffer[x+1]) trend[x] =1;
      if (ExtMapBuffer[x]< ExtMapBuffer[x+1]) trend[x] =-1;
      if (trend[x]>0)
        {
         Uptrend[x]=ExtMapBuffer[x];
         if (trend[x+1]<0) Uptrend[x+1]=ExtMapBuffer[x+1];
         Dntrend[x]=EMPTY_VALUE;
        }
      else
         if (trend[x]<0)
           {
            Dntrend[x]=ExtMapBuffer[x];
            if (trend[x+1]>0) Dntrend[x+1]=ExtMapBuffer[x+1];
            Uptrend[x]=EMPTY_VALUE;
           }
      }
   return(0);
  }
//+------------------------------------------------------------------+
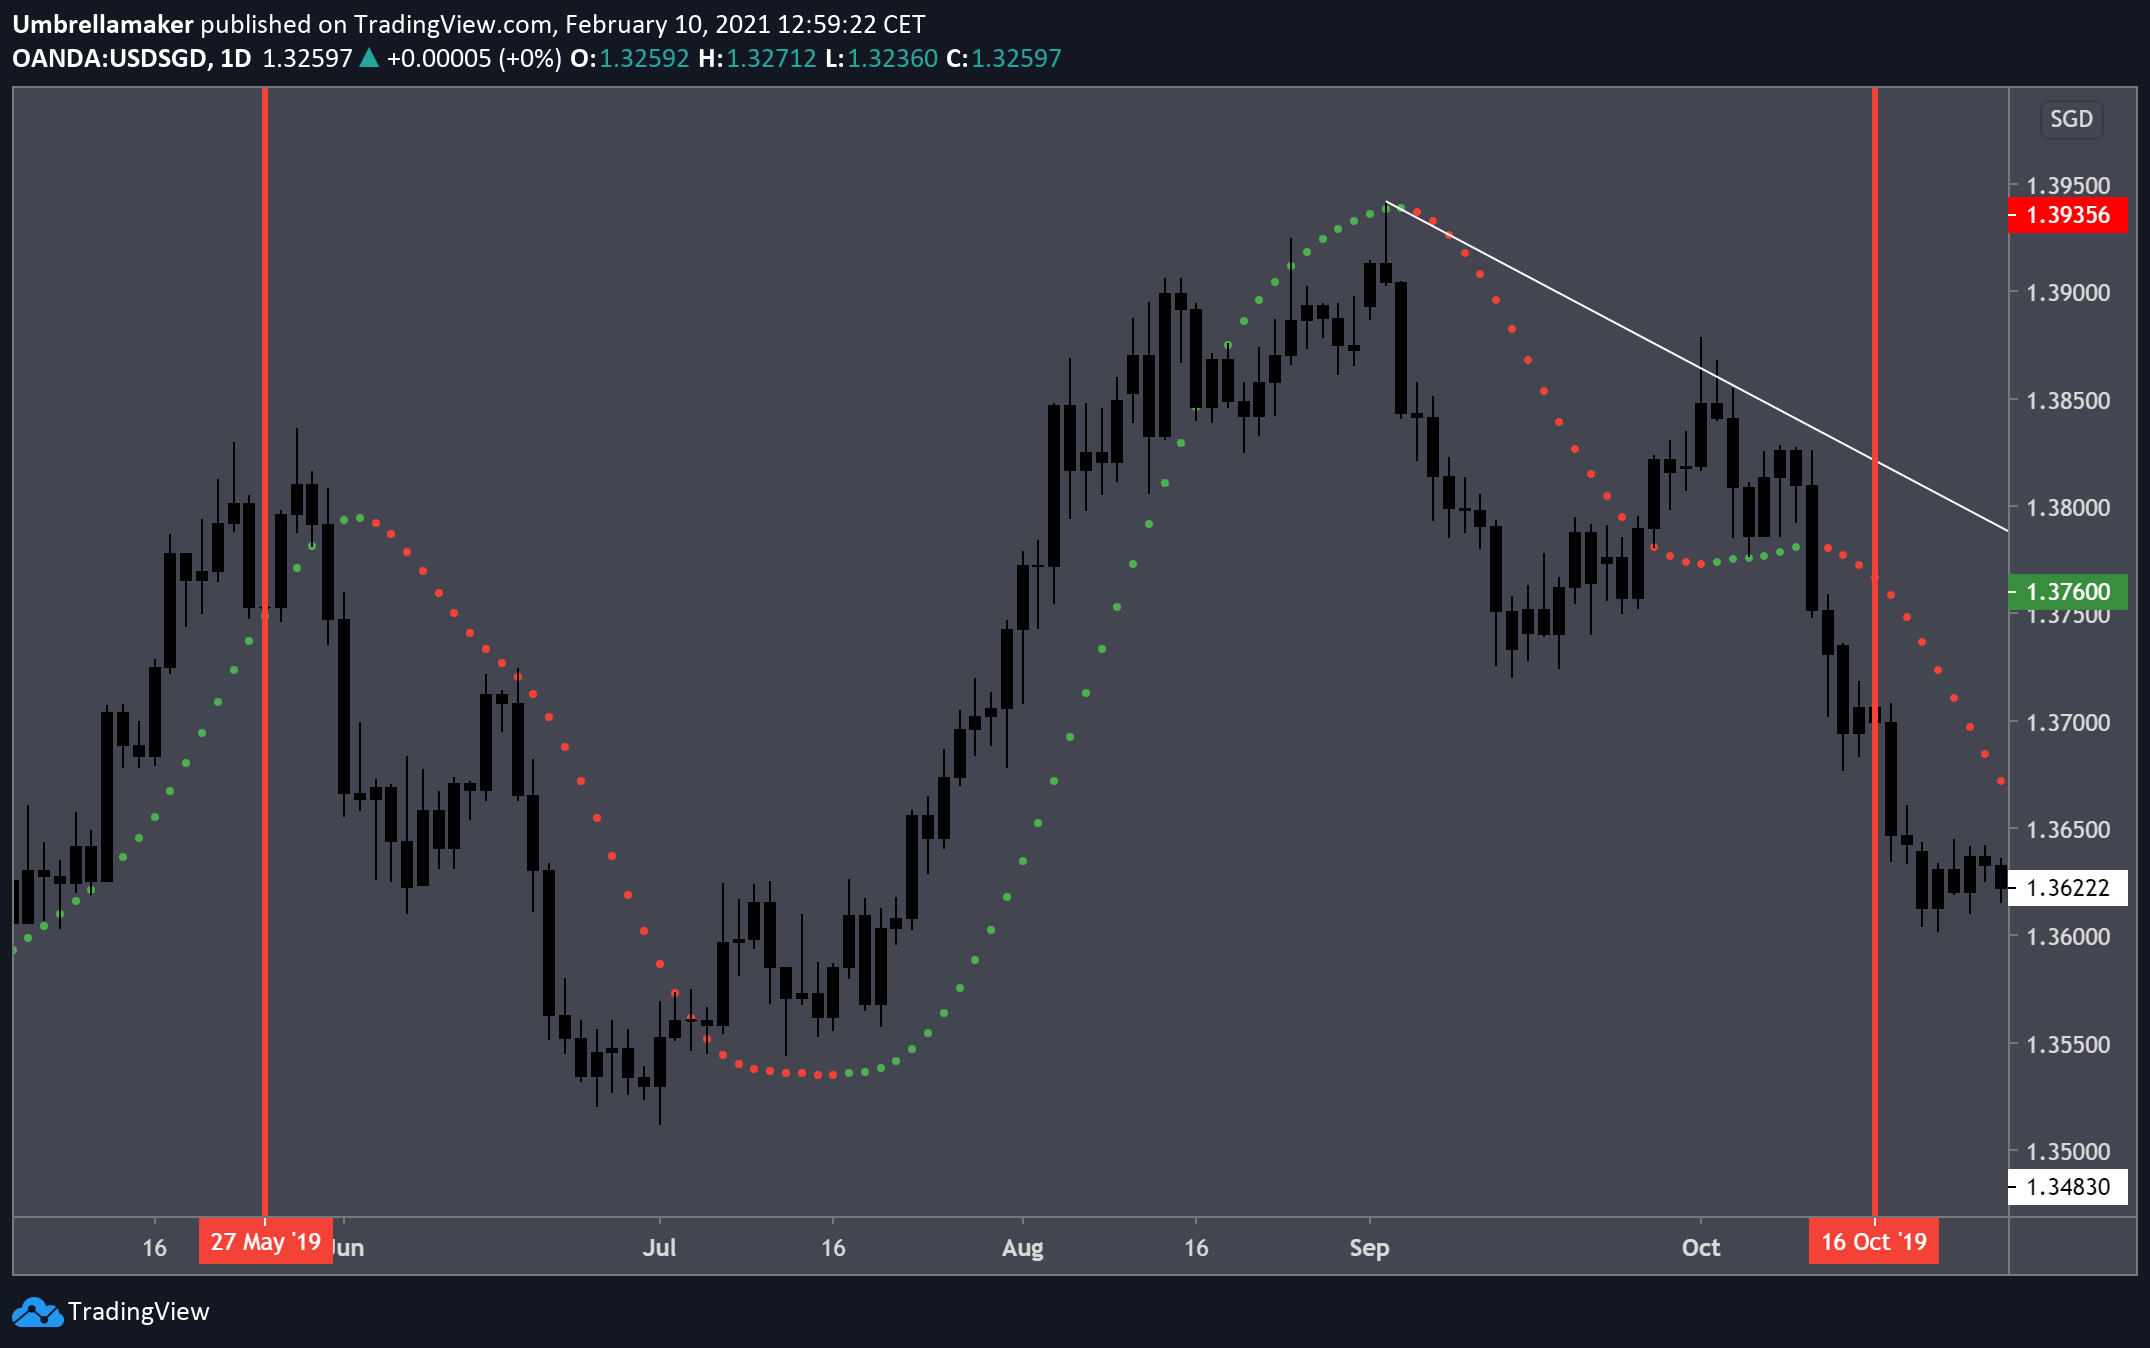
This screenshot shows the HMA with a inputPeriod of 50. The aimed indicator should look like this at the end and mark those switches from green to red/ red to green.
Please let me know if anything remains unclear!