指定
Boa Tarde !
O projeto é no minimo desafiador em ser realizado , e eu não tenho conhecimento de será possivel via metatrader .
Eu tenho um fornecedor chamado Cedro que me provém os dados da B3 que vem como exemplo abaixo :
| 09/06/2020 | 14:49:45.548655 | V | VALE3 | A | 144936 | 54.56 | 13 | 8 | 200 | 363090 | 0 | A |
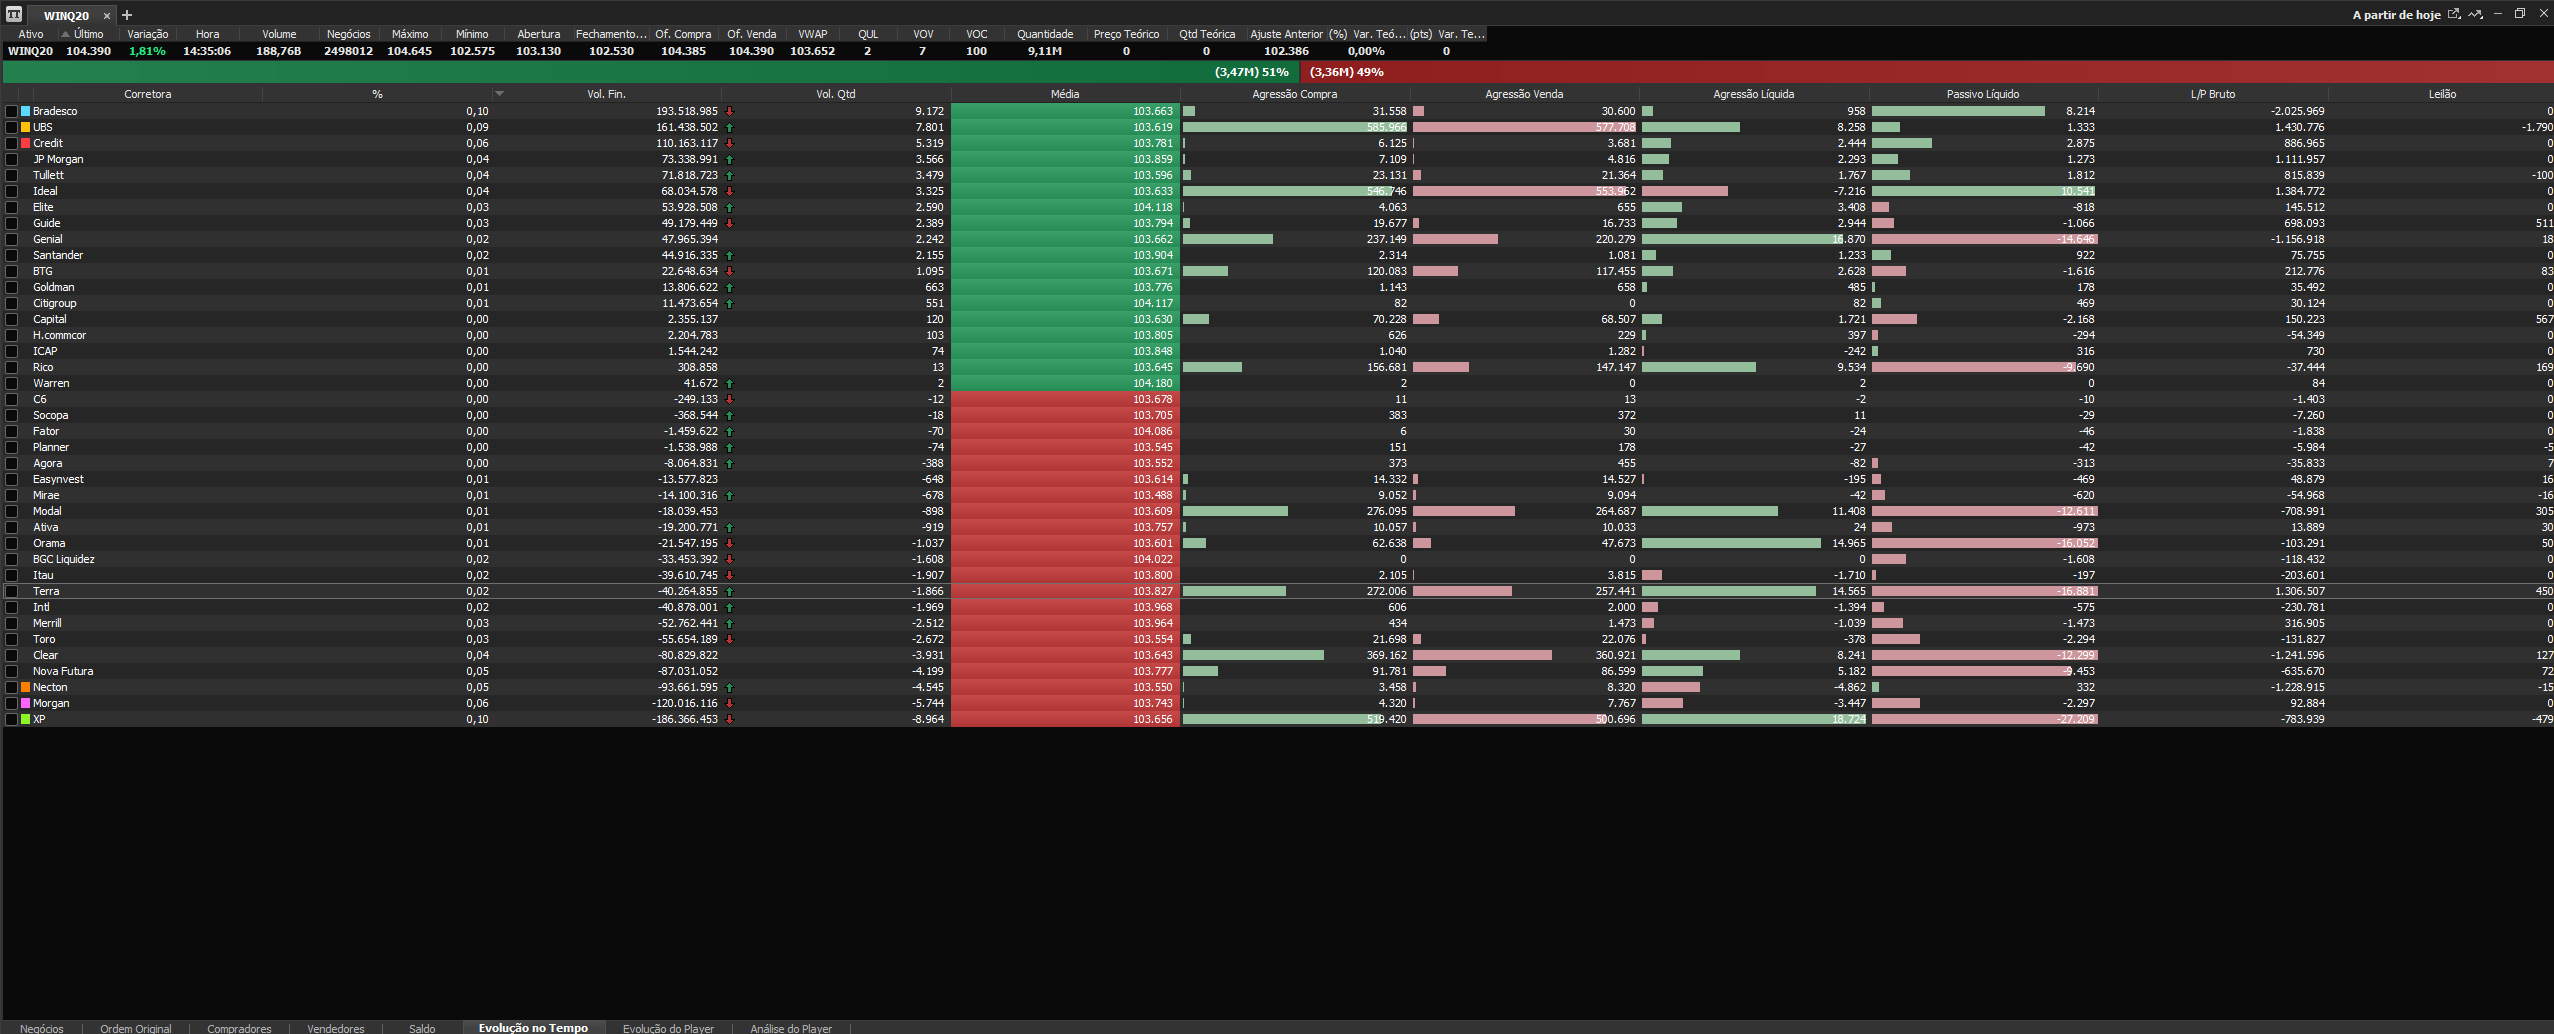
teria que fazer uma conexão desse market data que vem via telnet e conectar com o Meta e se criaria esse grid da foto em anexo alimentado por esse market data
cada coluna é um calculo matematico e eu já tenho a formula de vários deles e mais alguns que seriam implementados .
Esse grid serveria tanto par ao visual tanto como se eu pudesse criar um EA futuro baseado nos dados desse grid .
Desde já grato aguardo contato dos interessados .
応答済み
1
評価
プロジェクト
205
26%
仲裁
12
25%
/
58%
期限切れ
39
19%
暇
2
評価
プロジェクト
17
59%
仲裁
2
0%
/
100%
期限切れ
2
12%
暇
3
評価
プロジェクト
5
0%
仲裁
3
0%
/
100%
期限切れ
3
60%
暇
プロジェクト情報
予算
30 - 150 USD
締め切り
最低 1 最高 5 日