Create buttons to open positions and move stops and fill a graphical table

指定

Hi, 

the job is in the title. 

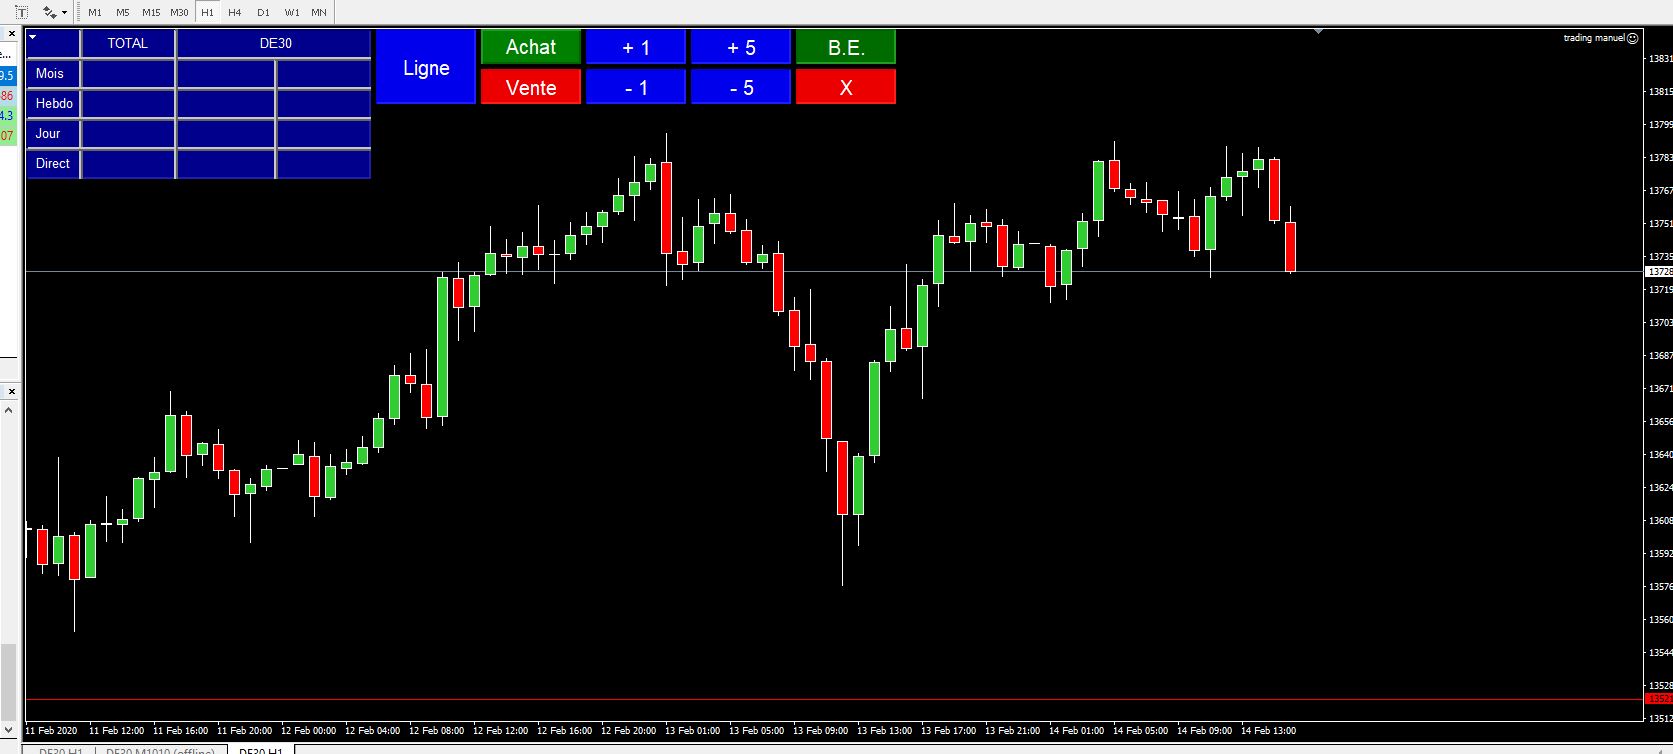
please see the attached file before reading.

1 - In the first column, we have the margin percentages for all symbols, whether monthly, weekly, or daily with one digit : 17.2 % = 100 * ( Account balance / (Account balance - won/loss this month, week or day ) ) -1

2 - In the second column number of points (indices) or pips (pairs) won/loss monthly, weekly and daily for the current symbol on the chart.

3 - in the third column, like in the first column but only for the current symbol on the chart.

4 - in the last line, named "Direct", we have  the Risk / Reward of the current opened trade , the number of points/pips running, and the margin percentage . All for the current trade.

    Risk/Reward= OrderProfit / (     Abs ( OrderOpenPrice-Order virtual stoploss) + spread + commission )

For all these values, a red color if negative, green if positive, and white if = 0 

i wrote "virtual stop loss" because i often use stoploss below the STOP LEVEL, so please forget OrderStoploss() and use a virtual stop loss where position will close if Bid > or < "virtual stop loss".


i need a red line on the bottom of the chart, like on the capture. this red line will be abble to move by dragg and drop, to vsualize a stoploss.

So : 2 ways to buy / sell 

      * by choosing a stop loss level with the red line and clicking on the "Ligne" button. if the stop is below, it will buy, above it will sell, and virtual stop loss = red line level.

       on orders, red line will disapear, replaced by a stop loss drawn like stairs when we 'll move stop loss with buttons.

    * by clicking on "Achat" button or "Vente" button. in those cases, virtual stop loss will be placed up or under the hihgest/lowest of the last passed 3 candles + security. Same drawings for the stop loss, following candles.  Security is a double input in order to avoid double top/bottom.


in all cases, when on position, red line disapears, and appears again when OrdersTotal=0

"+1" "-1" "+5" & "-5" buttons are for increasing or decreasing the stop loss in points ( indices ) or pips ( pairs ).

"B.E." : Break even including spread

"X" : closing current position


last thing : 3 inputs

* double : security

* int : margin of the account balance used in % 

*double : Risk in % = % of Account balance depending on margin used, stop distance for each trade


for the number of lots : Math min ( input Risk(%) , available free margin )


ファイル:

JPG
Capture.JPG
115.7 Kb

応答済み

1
開発者 1
評価
(442)
プロジェクト
570
37%
仲裁
106
39% / 33%
期限切れ
17
3%
2
開発者 2
評価
(365)
プロジェクト
507
40%
仲裁
159
17% / 74%
期限切れ
99
20%
取り込み中
3
開発者 3
評価
(499)
プロジェクト
743
56%
仲裁
47
32% / 30%
期限切れ
119
16%
仕事中
パブリッシュした人: 1 code
類似した注文
I am looking for an experienced MQL5 developer to convert a complex TradingView Pine Script (will provide the script from tradingview) into a fully automated MT5 Expert Advisor -bot. The TradingView script includes: Market Structure (BOS, CHoCH, Swing BOS) Strong / Weak High & Low Equilibrium (Premium / Discount zones) Volumetric Order Blocks Fair Value Gaps (FVG / VI / OG) Accumulation & Distribution zones Equal
// Add this to your EA after ExportState() function void SendToBase44(const string state, const string dir, double entry, double sl, double tp) { string url = " https://preview-sandbox--ee0a32a725b788974de435e8cef40b7a.base44.app/api/functions/receiveEAState "; string headers = "Content-Type: application/json\r\n"; string json = "{" "\"symbol\":\""+_Symbol+"\","
1.Sinyal Perdagangan : Sinyal beli: garis MACD utama memotong garis sinyal ke atas (macd_current>signal_current && macd_previous<signal_previous). Sinyal jual: garis MACD utama memotong garis sinyal ke bawah (macd_current<signal_current && macd_previous>signal_previous). Gambar di bawah menunjukkan kasus beli dan jual. 2. Posisi ditutup pada sinyal yang berlawanan: Posisi beli ditutup pada sinyal jual, dan posisi
Olá, preciso de um programador para montar um indicador com base na sobrevenda do estocastico, volume macd, para uma estrategia de reversão e falso rompimento com regioes de OB validos minimas e maximas de H1, H4, D1 e canais para confluencias, quero que seja didatico visualmente e com cores, sons de alertas e algum sinal de call ou put como setas indicando reversões e falsos rompimentos e continuidade
Subject: Experienced MQL5 Developer | High-Quality Execution & Error Handling "Hello, I am interested in developing your trading system. I specialize in building robust MQL5 Expert Advisors that are not only logically sound but also technically optimized for the MT5 platform. Why work with me? Error-Free Execution: I have deep experience in handling common MT5 execution errors such as Invalid Volume, Not Enough
Hi, I have a specific set of rules and a strategy to execute a trade. I'm looking for a developer to assist me in developing an MQL5 EA based on my strategies

プロジェクト情報

予算
50+ USD
締め切り
最低 1 最高 2 日