スピーディに自動売買ロボットを注文する方法を見る
注文を投稿するまたは受注する前にルールをご覧ください。
MQL5およびMQL4で自動売買ロボットを注文する方法
ロボットを注文するにはサンプル要件仕様をご覧ください
カテゴリでの新規注文:
30 - 40 USD
30 - 80 USD
40+ USD
200 - 500 USD
指定
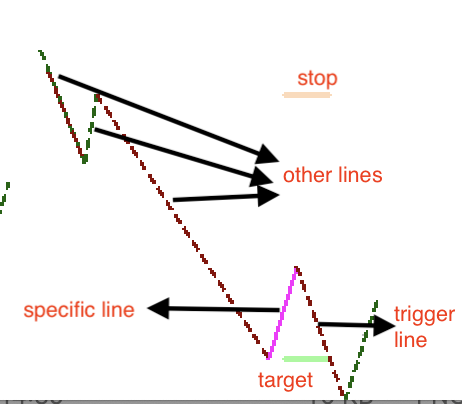
As the tile says i need an indicator that can read data (lines with a specific color) and some additional data and store this to a txt file.
The indicator should be able to find a set of two horizontal lines (target & stop) with a specific color.
Once those are found the indicator should find another line with a specific color code as well and of this line the name should be grabbed on which should be searched for so called other lines and also for the trigger line. I did attach a picture.
The indicator should have two modes (active and history) and also store some additional data.
If you are interested in this job or have any question up to this point pls contact me for further details.
Thank you!
応答済み
1
評価
プロジェクト
570
37%
仲裁
106
39%
/
33%
期限切れ
17
3%
暇
2
評価
プロジェクト
8
0%
仲裁
0
期限切れ
3
38%
暇
3
評価
プロジェクト
59
14%
仲裁
31
26%
/
52%
期限切れ
34
58%
暇
4
評価
プロジェクト
1065
50%
仲裁
39
28%
/
41%
期限切れ
49
5%
暇
パブリッシュした人: 1 article, 8 codes
5
評価
プロジェクト
334
55%
仲裁
14
36%
/
29%
期限切れ
1
0%
暇
6
評価
プロジェクト
86
57%
仲裁
25
0%
/
84%
期限切れ
19
22%
暇
類似した注文
The Advisor should stop trading if the spread exceeds a selected value. Source code is unavailable. Decompilation may be necessary or any other suggested working solution may be acceptable. Testing should be thorough with proven demonstrable results
Convert Time Range Breakout Indicator to Strategy (Pine Script) I have an existing Time Range Breakout indicator on TradingView. I need a developer to convert it into a fully functional strategy with proper trade execution logic. Strategy Logic: Time Range: Define a specific time range (e.g., 03:00 – 04:30) During this time, the indicator marks the High and Low range Entry Conditions Buy when price touches the range
Hello, I’m looking for an experienced MQL4 developer to build a custom MT4 Expert Advisor based on a Koncorde-style indicator strategy. Here are the main requirements: 🔹 General Overview The EA must be a master EA , running on a single chart and managing multiple currency pairs simultaneously No need to attach EA to each chart Must support a configurable list of symbols 🔹 Indicator Requirement Develop a custom
Looking for special EMA cross EA
30+ USD
I want to find a Developer to perform this work and settle payments in this Application. I undertake not to communicate with Applicants anywhere else except this Application, including third-party
Hi guys I’m looking for a coder who’s experienced in one script. The candidate must be familiar with fractals and self similarity. If you can’t code self similarity, please don’t bother contacting me ( respectfully). I just don’t want us to waste each others time. My budget is 100$. If that’s too low for you please, don’t contact me. Only contact me if you can code self similarity and can accept 100$. I will provide
I hope to acquire a profitable and existing expert advisor (EA) from the gold market, with complete source code, to add to our client portfolio. you can WECHAT: Faca7898 Please note EA when adding friends. It should be clarified that this does not require you to formulate or design new strategies. If you already have a verified, consistent, and production-ready EA, I am willing to purchase it immediately and engage
Core Requirements: Platform: MetaTrader 5 (MT5). Symbol: XAUUSD (Gold). Timeframes: M1 and M5 (user selectable). Trading Style: Scalping with controlled risk (not aggressive or high-risk strategies) -> adjustable, even better. Execution: Fast execution, optimized for gold market conditions. Frequence = adjustable, but there should be 10-20 trades per day. Strategy Logic: Use a reliable and conservative strategy
MT4 TMA Reference
30+ USD
Eu preciso disso. A linha central do TMA (17,5,1.5) será a principal referência. Outra linha de média móvel (AVG) de 3 períodos decrescentes 2. As ordens serão as seguintes: abaixo, somente compra de TMA; acima, somente venda de TMA. O sinal de entrada será o seguinte: se o preço estiver acima da Média Móvel Tarifária (TMA), será apenas para venda; quando o preço se mantiver abaixo da Média Móvel Tarifária (AVG)
Non-repainting Indicator for scalping Gold / Xauusd
30 - 200 USD
I am looking for non-repainting indicator to run in all sessions for scalping gold , happy to discuss if you have developed such indicators which can show profit and stop loss levels
Hello! I want to buy two indicators: A Support and Resistence Indicator and a Trendline Indicator. Support and Resistence Indicators needs to automatically draws Support and Resistance lines based on High and Low Candle in every time-frame (If possible time-frame needs to be in inputs and choose by me what time-frame i want indicator to draw lines) Trendline Indicator needs to automatically draws Trendline Channels
プロジェクト情報
予算
30+ USD