仕事が完了した
指定
Hello,
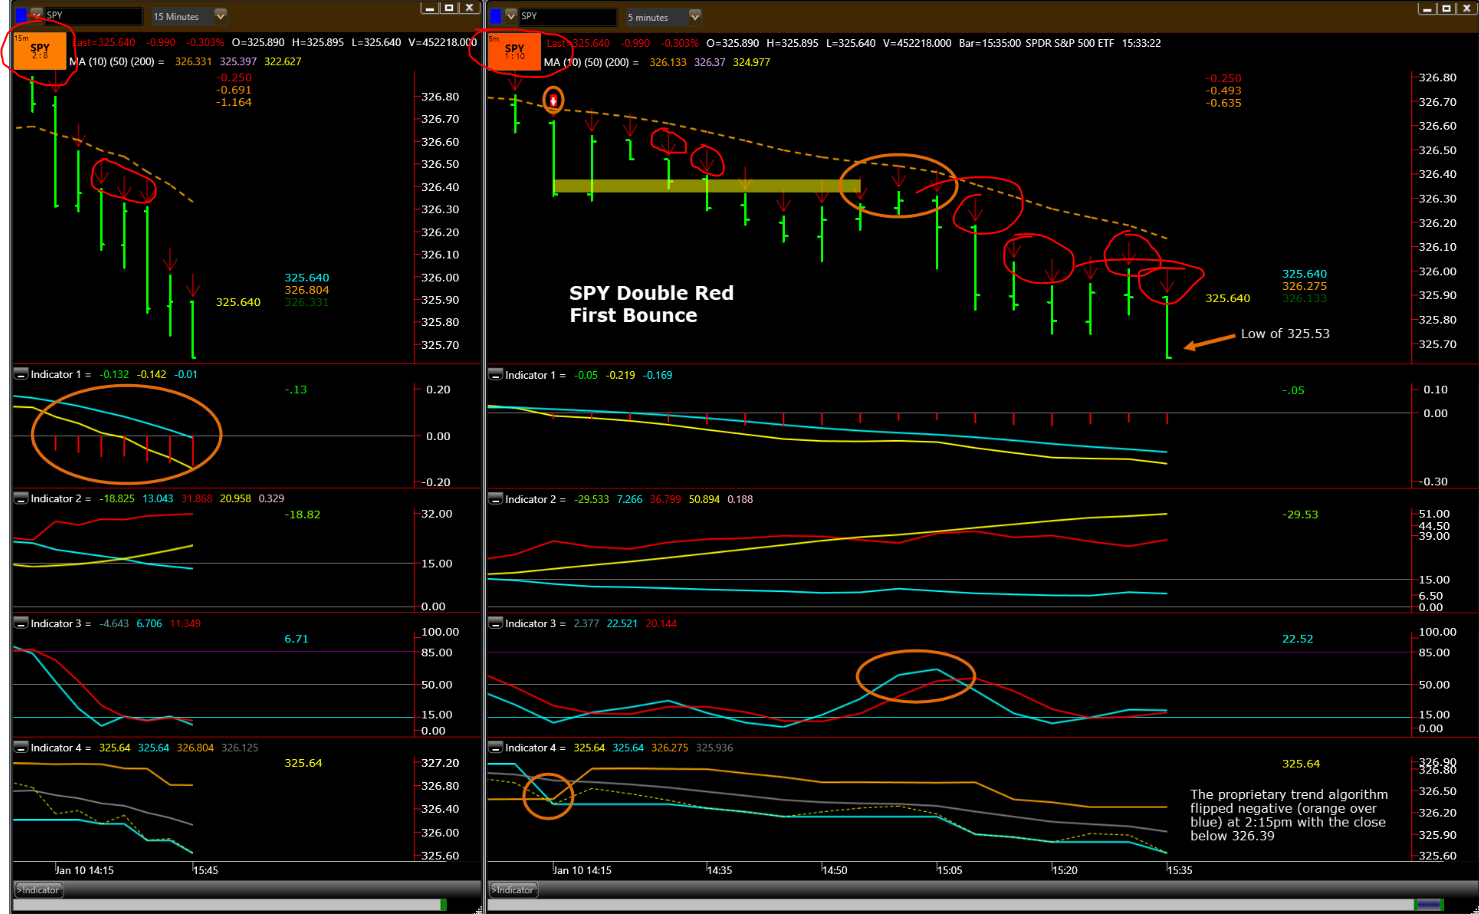
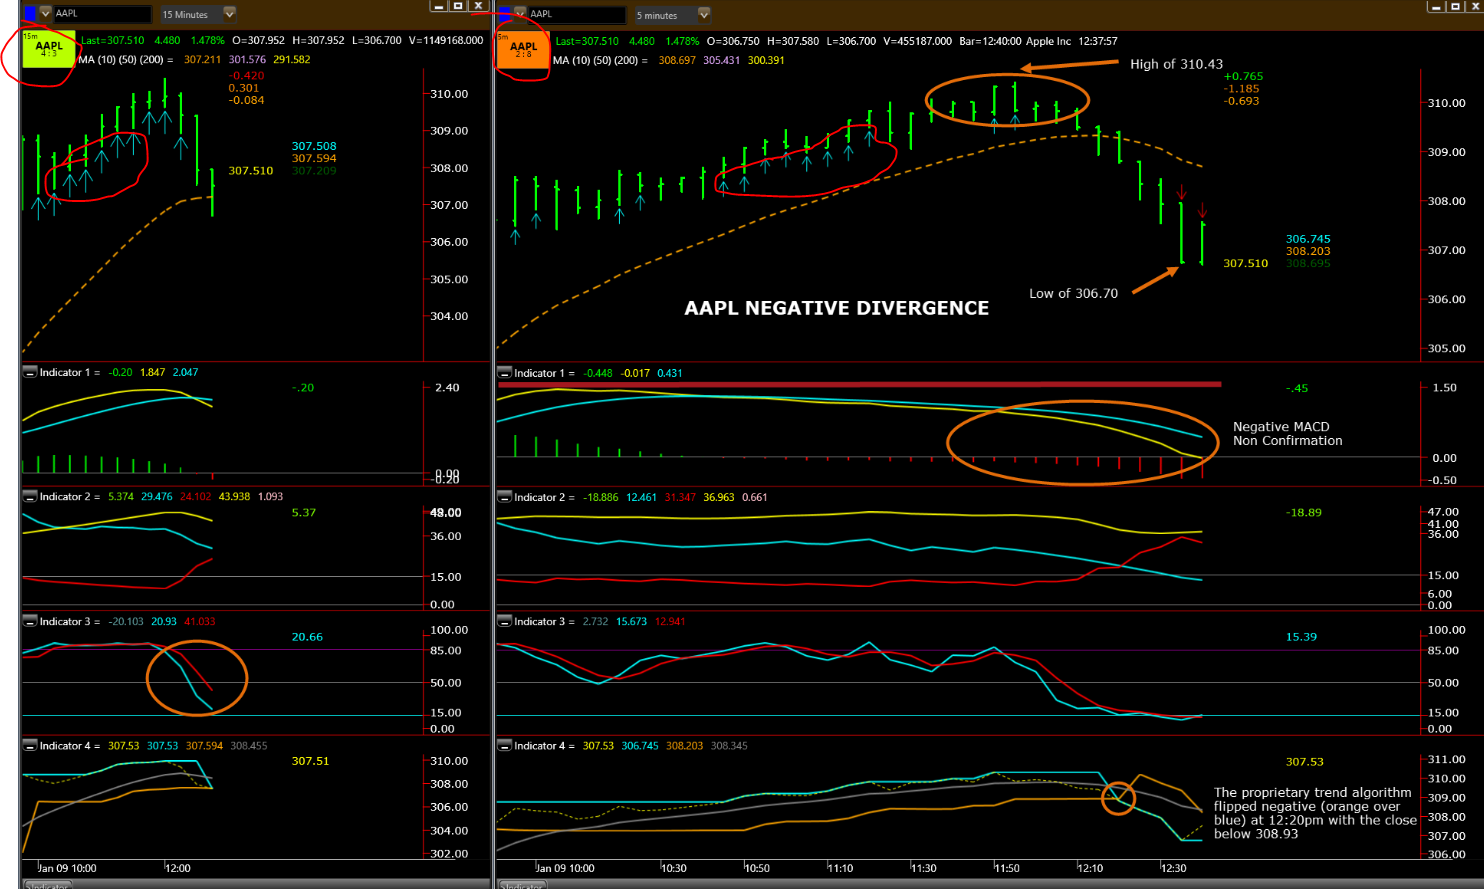
I saw the algorithm of Stephan Kalayjian and I really like the idea on how he optimizes
his algorithm with numbers and arrows that represents which way the trend is going to. I will include Figure 1 and Figure 2 as examples of what I
am looking to program on Mt4(those are from his algo).
Note: Please ignore the orange circles (those were made by Mr. Kalayjian) and
pay attention to the red circles (made
by me)
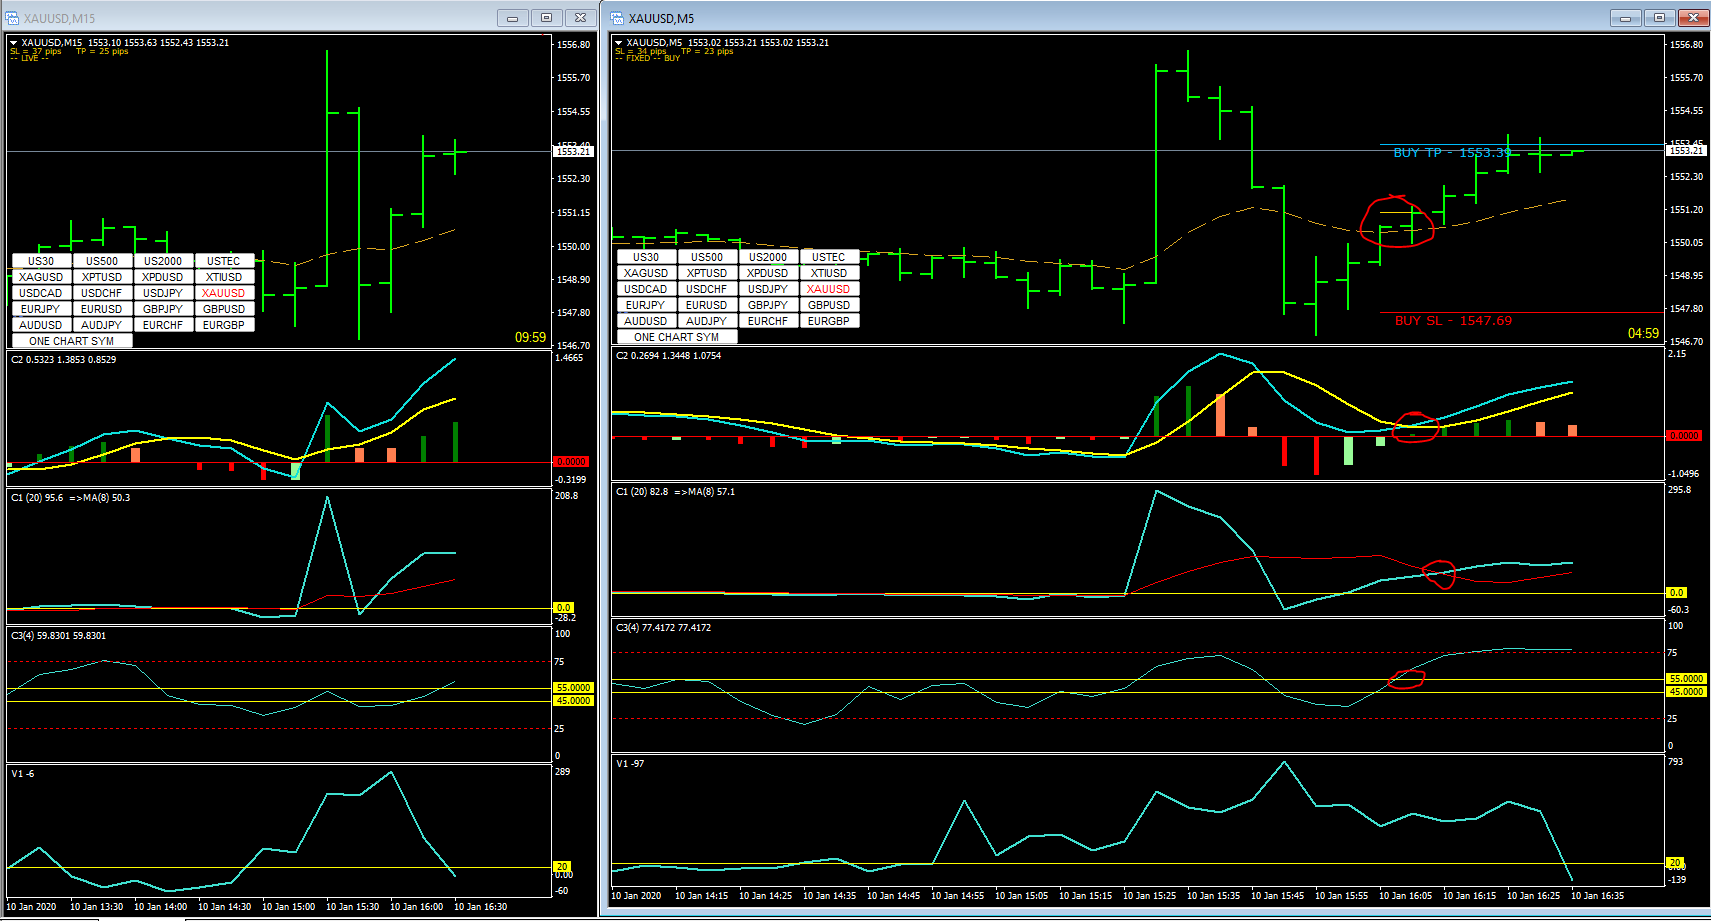
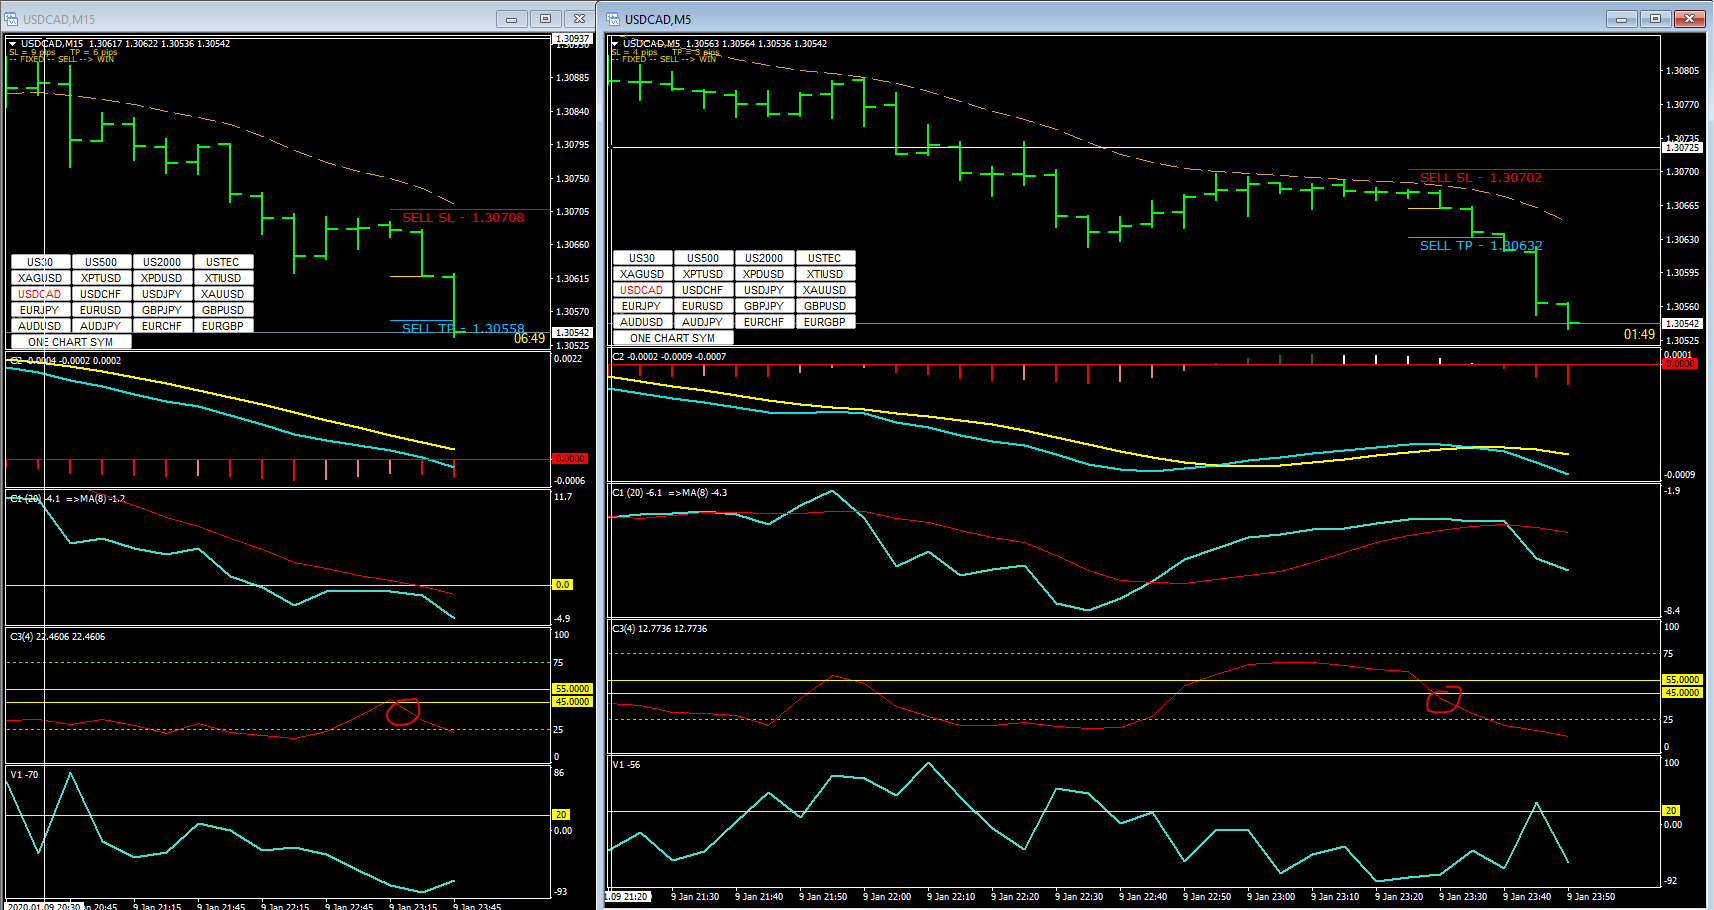
I
am looking to replicate that with different indicators. I can provide the indicators(privately) that I am showing on the Figure 3 and
figure 4.
The rules I am trying to set for the numbers(the numbers in the left upper corner) are:
[Left
side of the box: Bearish trend : Right Side of the Box: Bullish trend]
*1st indicator: Baseline(interpolated line that you can see where the bars are)
1 bearish value if the price is below
the baseline : 1 bullish value if the value is above the baseline
*2nd indicator: C1
1 bearish value if the two lines are below the zero axis and yellow is over blue : 1 bullish value if the two lines
are above the zero axis and blue is over yellow
-second condition:
0.5 bearish value if the two lines are below the zero axis and blue is over yellow : 0.5 bullish value if
the two lines are above the zero axis and yellow is over blue
*3rd indicator: C2
1 bearish value if the two lines are below the zero axis and red is over blue : 1 bullish value if the two lines are
above the zero axis and blue is over red
-second condition:
0.5 bearish value if the two lines are below the zero axis and blue is over red : 0.5 bullish value if the
two lines are above the zero axis and red is over blue
4th indicator: C3
1 Bearish value if the line is below 45 : 1 Bullish value if the line is above 55
The rules I am trying to set for the arrows:
I would like to be able to manually change it, but a good start would
be:
Display downtrend arrow(red arrow pointing down above the price bar) if the bearish box value is 3.5 or
higher : Display uptrend arrow(blue arrow pointing up bellow the price bar) if the bullish box value is 3.5 or
higher