|
9+ anni
esperienza
|
128
prodotti
|
55
versioni demo
|
|
0
lavori
|
0
segnali
|
0
iscritti
|
Ciao!
Sono un ingegnere del software con molti anni di esperienza nello sviluppo, dotato di un mio sistema di trading unico e di una vasta esperienza nel trading con EA. Le valute principali sono EUR/USD, GBP/USD, USD/JPY, AUD/USD, USD/CAD, l'oro e il cross valutario EUR/NZD.
Il nostro obiettivo è fornire un servizio accessibile e di qualità, consentendo ai partecipanti al mercato, ai trader e agli analisti di disporre degli strumenti necessari per prendere decisioni di trading informate e tempestive.
Ora applicheremo una strategia di teoria dei giochi sul futuro di ciascuna valuta anziché su un grafico dei prezzi storico. Questo è un livello superiore. La teoria dei giochi di mercato dinamico è una funzionalità speciale dell'indicatore Advanced Currency Health Bars che non puoi trovare in nessun altro misuratore di valuta! Questa è una funzione davvero unica. Le barre di salute della strategia di teoria dei giochi di mercato dinamico si basano sull'intera attività di mercato (tutte le 35 coppie).
Questo EA può correggere il tasso di perdita futuro attraverso il mio algoritmo matematico.
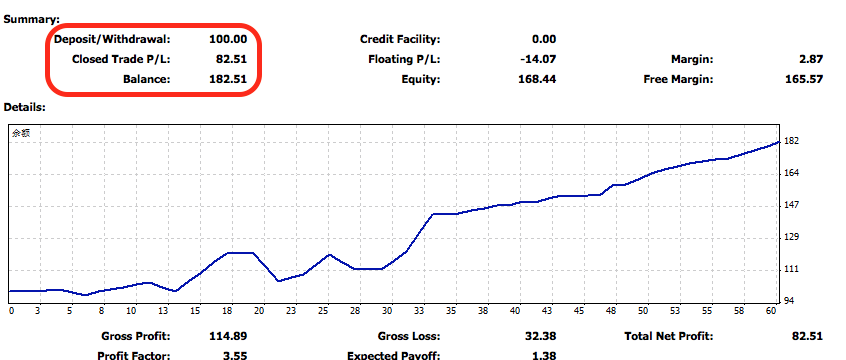
L'EA viene eseguito per identificare i trend, effettuando il trading principale delle prime otto valute costituite da valute dirette o incrociate, fino a dieci o più al giorno, con un prelievo massimo del 20%, utilizzando l'algoritmo Martingale, con un reddito mensile del 10% - 20%. Qualsiasi broker può seguire, ed è consigliabile utilizzare un conto ECN per ridurre lo slippage. State certi che con ogni singola operazione, credo che vi innamorerete del sistema di trading. Grazie!
I prodotti di trading DYJ sono specializzati nello sviluppo di software multivaluta innovativo nel campo del trading per le proprie esigenze, nonché per l'implementazione degli obiettivi dei clienti aziendali. I prodotti di trading a marchio DYJ sono progettati per transazioni basate su più valute in tutti i timeframe; nessuna opportunità di ingresso viene persa, con monitoraggio da M1 a MN. Affinché i trader non perdano alcuna opportunità di guadagnare denaro, la strategia rileva automaticamente la comparsa di questi segnali di uscita dalle posizioni, proteggendo i vostri profitti in ogni momento o riducendo al minimo le vostre perdite.
Ulteriori informazioni possono essere trovate qui: https://www.mql5.com/en/users/cdymql4/seller
Gentili utenti, tutti i nostri prodotti a pagamento sono disponibili per l'acquisto e il noleggio.
Nuovi prodotti in primo piano:
DYJ Hedging ODE Beta EA: https://www.mql5.com/zh/market/product/192446?source=Site+Market+My+Products+Page
DYJ Ode Spectra EA: https://www.mql5.com/zh/market/product/185841?source=Site+Market+My+Products+Page
DYJ BetaLogicDynamicsEA: https://www.mql5.com/zh/market/product/184829?source=Site+Market+My+Products+Page
StrongCurrency MT4: https://www.mql5.com/en/market/product/23311, o https://www.mql5.com/zh/market/product/23311
StrongCurrency MT5: https://www.mql5.com/en/market/product/24025, o https://www.mql5.com/zh/market/product/24025
PowerSignal MT4: https://www.mql5.com/en/market/product/24448#description, o https://www.mql5.com/zh/market/product/24448#description
PowerSignal MT5: https://www.mql5.com/en/market/product/24915, o https://www.mql5.com/zh/market/product/24915
SoarSignal MT4: https://www.mql5.com/en/market/product/22459#description, o https://www.mql5.com/en/market/product/22459#description
SoarSignal MT5: https://www.mql5.com/en/market/product/24638, o https://www.mql5.com/zh/market/product/24638
DYJ TwoMACrossAlarm MT4: https://www.mql5.com/en/market/product/25213, o DYJ TwoMACrossAlarm
QuickClose MT4: https://www.mql5.com/en/market/product/22425#description, o https://www.mql5.com/zh/market/product/22425#description
DYJ RiseTrading MT4: https://www.mql5.com/en/market/product/25237
Sono un ingegnere del software con molti anni di esperienza nello sviluppo, dotato di un mio sistema di trading unico e di una vasta esperienza nel trading con EA. Le valute principali sono EUR/USD, GBP/USD, USD/JPY, AUD/USD, USD/CAD, l'oro e il cross valutario EUR/NZD.
Il nostro obiettivo è fornire un servizio accessibile e di qualità, consentendo ai partecipanti al mercato, ai trader e agli analisti di disporre degli strumenti necessari per prendere decisioni di trading informate e tempestive.
Ora applicheremo una strategia di teoria dei giochi sul futuro di ciascuna valuta anziché su un grafico dei prezzi storico. Questo è un livello superiore. La teoria dei giochi di mercato dinamico è una funzionalità speciale dell'indicatore Advanced Currency Health Bars che non puoi trovare in nessun altro misuratore di valuta! Questa è una funzione davvero unica. Le barre di salute della strategia di teoria dei giochi di mercato dinamico si basano sull'intera attività di mercato (tutte le 35 coppie).
Questo EA può correggere il tasso di perdita futuro attraverso il mio algoritmo matematico.
L'EA viene eseguito per identificare i trend, effettuando il trading principale delle prime otto valute costituite da valute dirette o incrociate, fino a dieci o più al giorno, con un prelievo massimo del 20%, utilizzando l'algoritmo Martingale, con un reddito mensile del 10% - 20%. Qualsiasi broker può seguire, ed è consigliabile utilizzare un conto ECN per ridurre lo slippage. State certi che con ogni singola operazione, credo che vi innamorerete del sistema di trading. Grazie!
I prodotti di trading DYJ sono specializzati nello sviluppo di software multivaluta innovativo nel campo del trading per le proprie esigenze, nonché per l'implementazione degli obiettivi dei clienti aziendali. I prodotti di trading a marchio DYJ sono progettati per transazioni basate su più valute in tutti i timeframe; nessuna opportunità di ingresso viene persa, con monitoraggio da M1 a MN. Affinché i trader non perdano alcuna opportunità di guadagnare denaro, la strategia rileva automaticamente la comparsa di questi segnali di uscita dalle posizioni, proteggendo i vostri profitti in ogni momento o riducendo al minimo le vostre perdite.
Ulteriori informazioni possono essere trovate qui: https://www.mql5.com/en/users/cdymql4/seller
Gentili utenti, tutti i nostri prodotti a pagamento sono disponibili per l'acquisto e il noleggio.
Nuovi prodotti in primo piano:
DYJ Hedging ODE Beta EA: https://www.mql5.com/zh/market/product/192446?source=Site+Market+My+Products+Page
DYJ Ode Spectra EA: https://www.mql5.com/zh/market/product/185841?source=Site+Market+My+Products+Page
DYJ BetaLogicDynamicsEA: https://www.mql5.com/zh/market/product/184829?source=Site+Market+My+Products+Page
StrongCurrency MT4: https://www.mql5.com/en/market/product/23311, o https://www.mql5.com/zh/market/product/23311
StrongCurrency MT5: https://www.mql5.com/en/market/product/24025, o https://www.mql5.com/zh/market/product/24025
PowerSignal MT4: https://www.mql5.com/en/market/product/24448#description, o https://www.mql5.com/zh/market/product/24448#description
PowerSignal MT5: https://www.mql5.com/en/market/product/24915, o https://www.mql5.com/zh/market/product/24915
SoarSignal MT4: https://www.mql5.com/en/market/product/22459#description, o https://www.mql5.com/en/market/product/22459#description
SoarSignal MT5: https://www.mql5.com/en/market/product/24638, o https://www.mql5.com/zh/market/product/24638
DYJ TwoMACrossAlarm MT4: https://www.mql5.com/en/market/product/25213, o DYJ TwoMACrossAlarm
QuickClose MT4: https://www.mql5.com/en/market/product/22425#description, o https://www.mql5.com/zh/market/product/22425#description
DYJ RiseTrading MT4: https://www.mql5.com/en/market/product/25237