Correlation Quotient Indicator
- Indicatori
- Versione: 1.0

Short summary (for the one-line field): Shows when two related instruments stop moving together, as a clean statistical Z-score. Fisher-transformed correlation, quotient Z-score, relative ATR and lead/lag phase, with an on-chart panel. Free.
The idea behind it
Many traders believe they are diversified when they are not. Several currency pairs that all share the same quote currency, two ETFs holding the same stocks, gold and silver: each looks like a separate market, but a single driver moves them together. When that shared driver is strong, the relationship between the instruments is stable. When it breaks down, even briefly, the break is information.
The Correlation Quotient Indicator grew from a simple question:
If two quantities are correlated, what does their quotient tell us about each of them?
Divide one price by the other and the common drivers cancel out, leaving only what is specific to each instrument. Measure how that relationship behaves, and how unusual its current state is, and you can see decoupling as it forms. That idea is the foundation of pairs trading, and this indicator brings it to your chart in a readable form.
What it shows
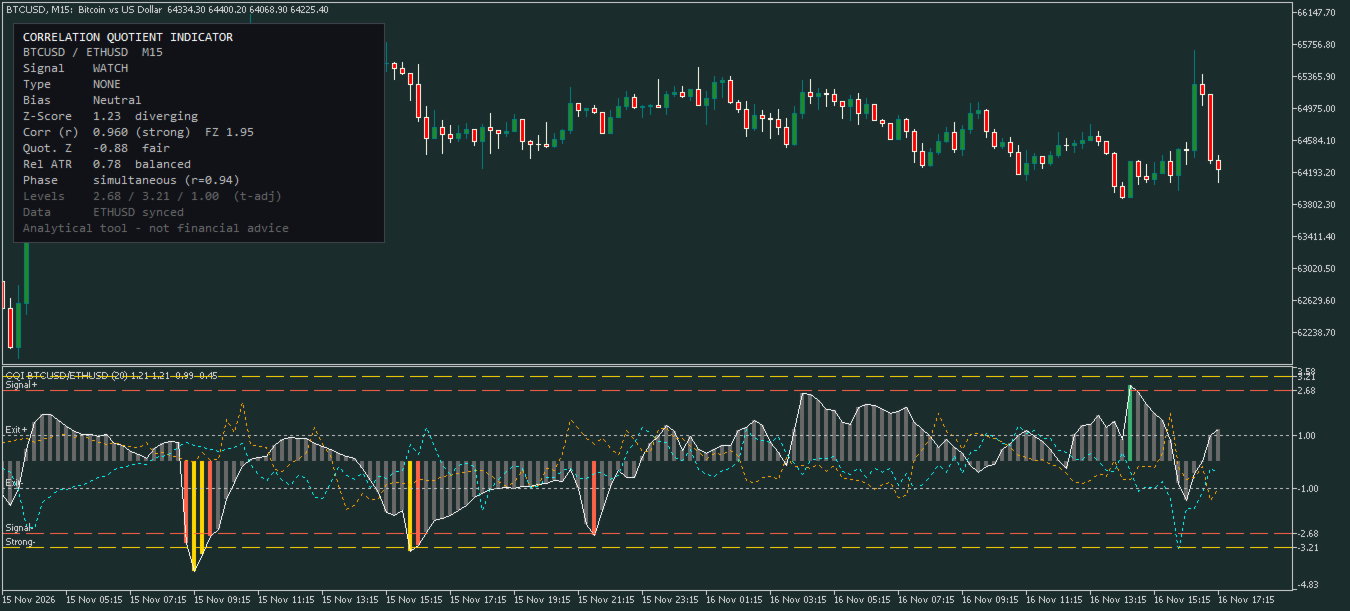
The indicator runs in a separate window and compares the chart symbol with a second symbol of your choice.
| Element | What it tells you |
|---|---|
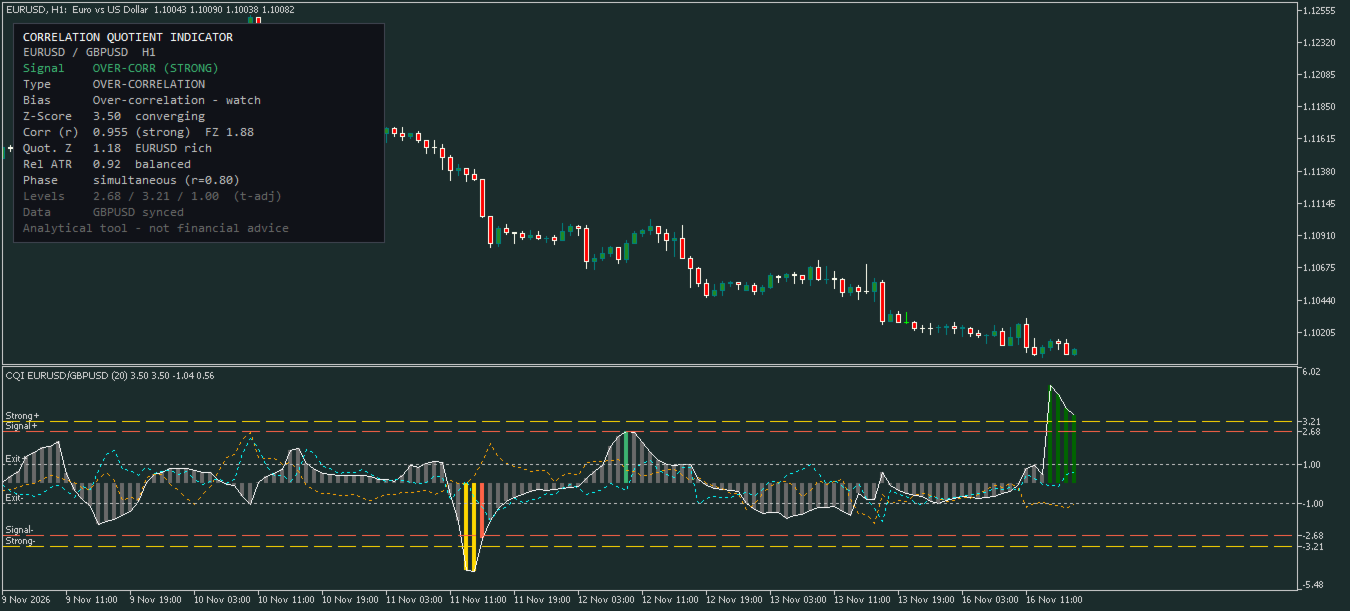
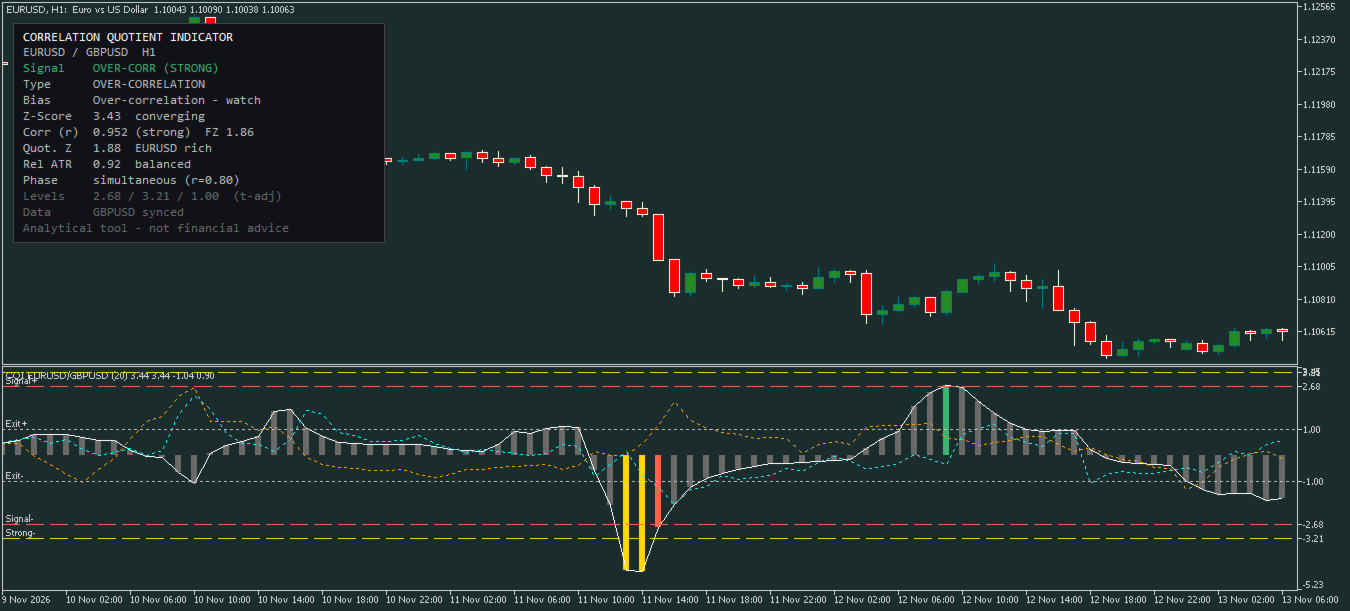
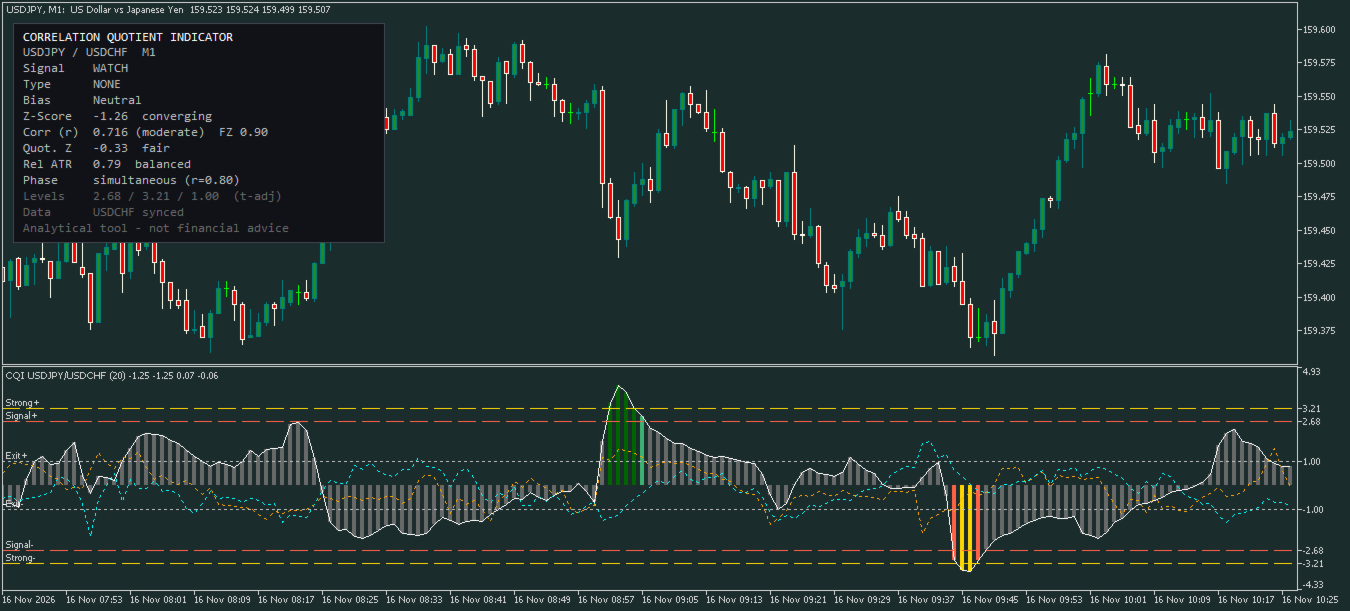
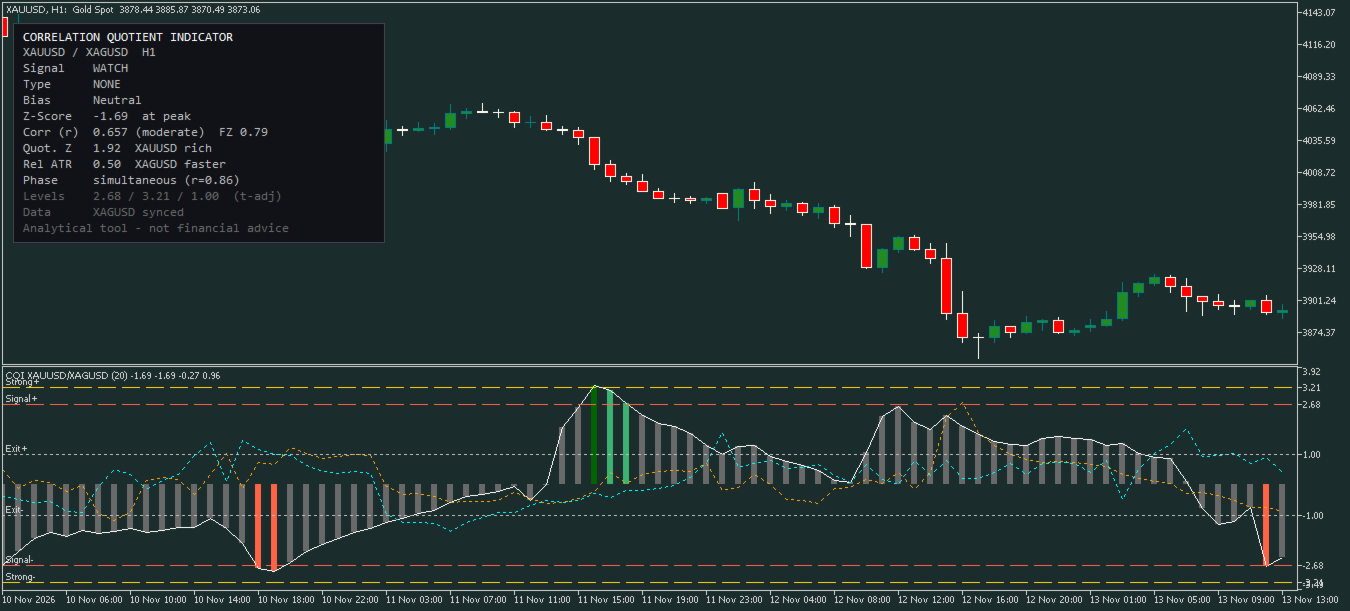
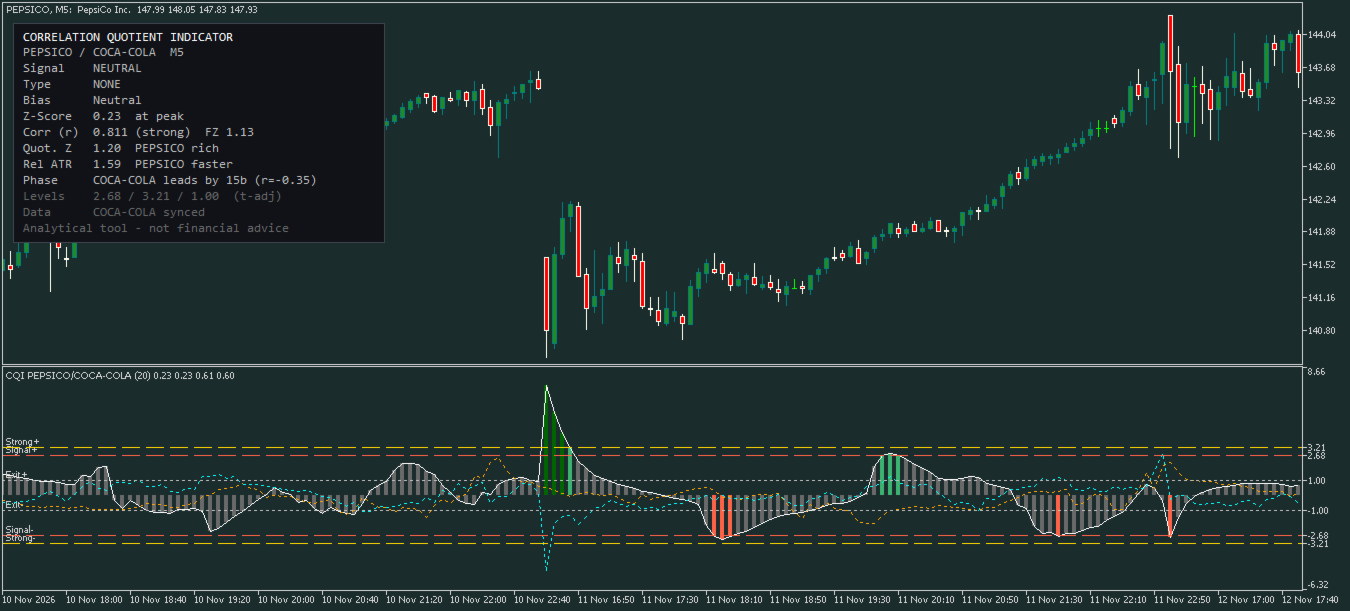
| Z-Score histogram | How unusual today's correlation is compared with its own recent history. Colour-coded: grey (normal), red (signal), gold (strong), green (over-correlated). |
| Z-Score line | Smoothed Z-score for cleaner reading. |
| Quotient Z (cyan, dotted) | Z-score of ln(Price1 / Price2). Positive means the chart symbol is rich relative to its partner, negative means cheap. |
| Relative ATR (orange, dotted) | Which instrument is moving faster, in volatility terms comparable across instruments. |
| Info panel | Signal state, decoupling type, reversion bias, Z-score and its direction of change, correlation, quotient Z, relative ATR, lead/lag phase and data status. |
Reference levels sit at the signal, strong and normalised thresholds, all adjustable.
How it works
- Returns, not prices. Both instruments are converted to log (or percent) returns, so different price scales and pip sizes never distort the result.
- Rolling Pearson correlation over a window you choose (default 20 bars).
- Fisher Z-transform. Correlation is bounded between -1 and +1, which makes plain Z-scores misleading near the edges. The Fisher transform removes that distortion.
- Z-score against history (default 200 bars), then light EMA smoothing.
- Small-window adjustment. For short windows, thresholds are widened slightly using a t-distribution factor to reduce false signals.
- Time-aligned data. The second symbol is matched to your chart bar by bar on time, never by position, so broker gaps and different holiday schedules do not corrupt the calculation.
- Lead/lag phase scan. Tests lags in both directions with identical sample sizes and reports which instrument tends to move first.
Nothing is repainted on closed bars. Alerts, if enabled, are evaluated on closed bars only.
How to read it
- Z below the Signal level (default -2.5): correlation is unusually weak. The pair is decoupling.
- Z below the Strong level (default -3.0): very unusual decoupling. Statistically rare, but also the condition in which relationships can be breaking for good, so treat it with extra care.
- Z rising back above the Exit level (default -1.0): the relationship is normalising.
- Z above the Signal level: unusually tight correlation (over-correlation).
- Quotient Z and the panel's Bias line indicate which instrument has run ahead of the other. The suggested mean-reversion bias is a hypothesis to test, not an instruction.
Using it
Stand-alone (chart analysis)
- Attach it to a chart. If Symbol 2 is left empty, a sensible partner is chosen automatically (for example EURUSD with GBPUSD, AUDUSD with NZDUSD, XAUUSD with XAGUSD), and broker prefixes and suffixes are respected.
- Leave Relationship direction on Auto, or set it manually: Same for positively related pairs, Inverse for negatively related ones (for example EURUSD with USDCHF).
- Watch the histogram and the panel. Use it as context for your own analysis, for example confirming that two positions are not secretly the same bet, spotting when a usually tight pair has drifted apart, or checking which of two related instruments has moved further.
As part of an automated system (Expert Advisors)
The indicator exposes plain buffers, so any EA or script can read it with iCustom :
| Buffer | Content |
|---|---|
| 0 | Z-score histogram |
| 1 | Histogram colour index |
| 2 | Smoothed Z-score line |
| 3 | Relative ATR (Z, scaled) |
| 4 | Quotient Z (scaled) |
Read buffer 2 on the last closed bar (shift 1) and ignore EMPTY_VALUE . Typical uses include a correlation filter for trading systems, a basket-risk check that reduces exposure when assumed-independent positions are in fact moving as one, or a trigger input for a pair-reversion model.
// Example: read the smoothed Z-score from an EA // Verify the exact name under Navigator > Market after installing. int h = iCustom(_Symbol, _Period, "Market\\Correlation Quotient Indicator", "GBPUSD", 0, 20, 200, 3, true, 10000, 2.5, 3.0, 1.0, true, true, true, 14, 0.5, true, 15, false); // ... through ShowPanel=false double z[]; if(CopyBuffer(h, 2, 1, 1, z) == 1 && z[0] != EMPTY_VALUE) { // z[0] is the smoothed Z-score of the last closed bar }
Set Show info panel to false when using the indicator from an EA. Buffer scaling for plots 3 and 4 follows the Overlay scale input (default 0.5).
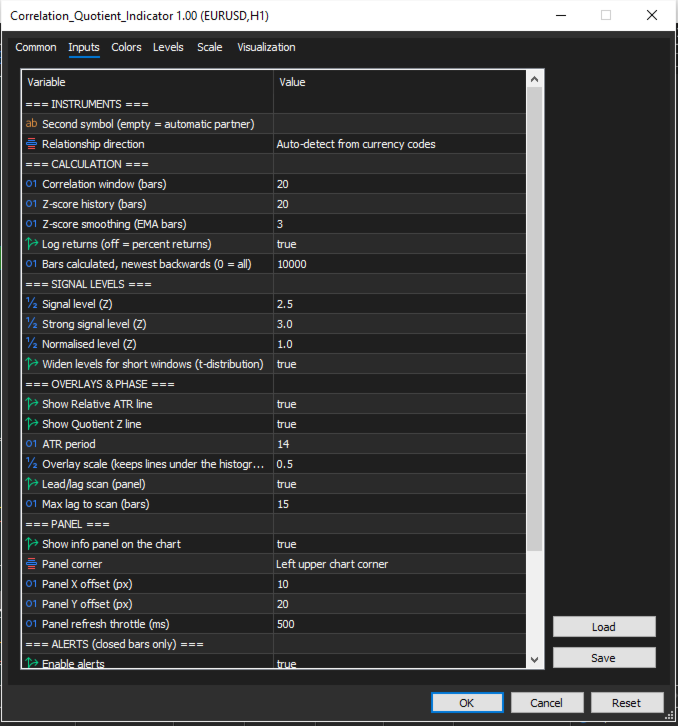
Inputs
Instruments: Symbol 2 (empty = automatic), Relationship direction. Calculation: Correlation window, Z-score history, smoothing, log or percent returns, bars calculated (newest backwards). Signal levels: Signal, Strong and Normalised levels, small-window adjustment. Overlays and phase: relative ATR, quotient Z, ATR period, overlay scale, lead/lag scan and maximum lag. Panel: show or hide, corner, offsets, refresh throttle. Alerts (closed bars): popup, push notification, email. Off by default. Diagnostics: optional log of recalculations and timing.
Good to know
- Correlation is not cointegration. A decoupling can revert, drift, or mark a lasting change in the relationship. This tool measures and displays; the judgement is yours.
- Statistical thresholds describe how unusual a reading is, not what will happen next. Markets can stay decoupled longer than expected.
- Illiquid second symbols or sessions with no data produce gaps, and the panel shows when the partner data is stale.
- Results depend on timeframe, window and the pair itself. Test on a demo account and in the Strategy Tester before relying on any setup.
- This is an analytical tool. It does not provide financial advice, and past behaviour of a statistical relationship does not guarantee future behaviour. Trading involves risk.
Updates and what's next
This is version 1.00. Updates are delivered through your MetaTrader terminal, so keep an eye on the update notices and the version history on this page to stay on the latest release. We intend to keep refining the indicator based on your feedback, and to release further tools built on the same correlation-and-quotient approach. Following our seller profile on MQL5 is the easiest way to hear about new versions and new products as they appear. Plans and timing may change.
A note from us
The Correlation Quotient Indicator is free because we would like it to be used, questioned and improved. Correlation-based thinking is standard practice in institutional trading, yet it is still rarely seen on retail charts, and we would love to see what you do with it on your pairs and timeframes.
If you try it, please tell us how it went: which markets, which settings, what was clear and what was not. Bug reports, ideas and honest ratings all help, and they directly shape the next versions. If it earns a place on your chart, a rating or review helps other traders discover it.
Thank you for trying it.
Stay up to date
This indicator will keep improving, and we are building further tools around the same ideas. To hear about new versions and new releases:
- Follow our seller profile on the MQL5 Market, so updates and new products reach you as they are published.
- Update to the latest version when one appears. The product page lists what changed in each release.
- Check back here for news, and use the comments section for questions and suggestions.
Blueprint Capital