Smart Absorption Radar MT5
- Indicatori
-
Kestutis Balciunas
 Con oltre 16 anni di esperienza attiva nei mercati finanziari, sono specializzato nello sviluppo di strategie di trading forex ad alte prestazioni, indicatori tecnici ed Expert Advisors automatizzati per MT4/MT5. Il mio lavoro comprende sistemi di trading progettati con precisione, orientati
- Versione: 1.0
- Attivazioni: 10
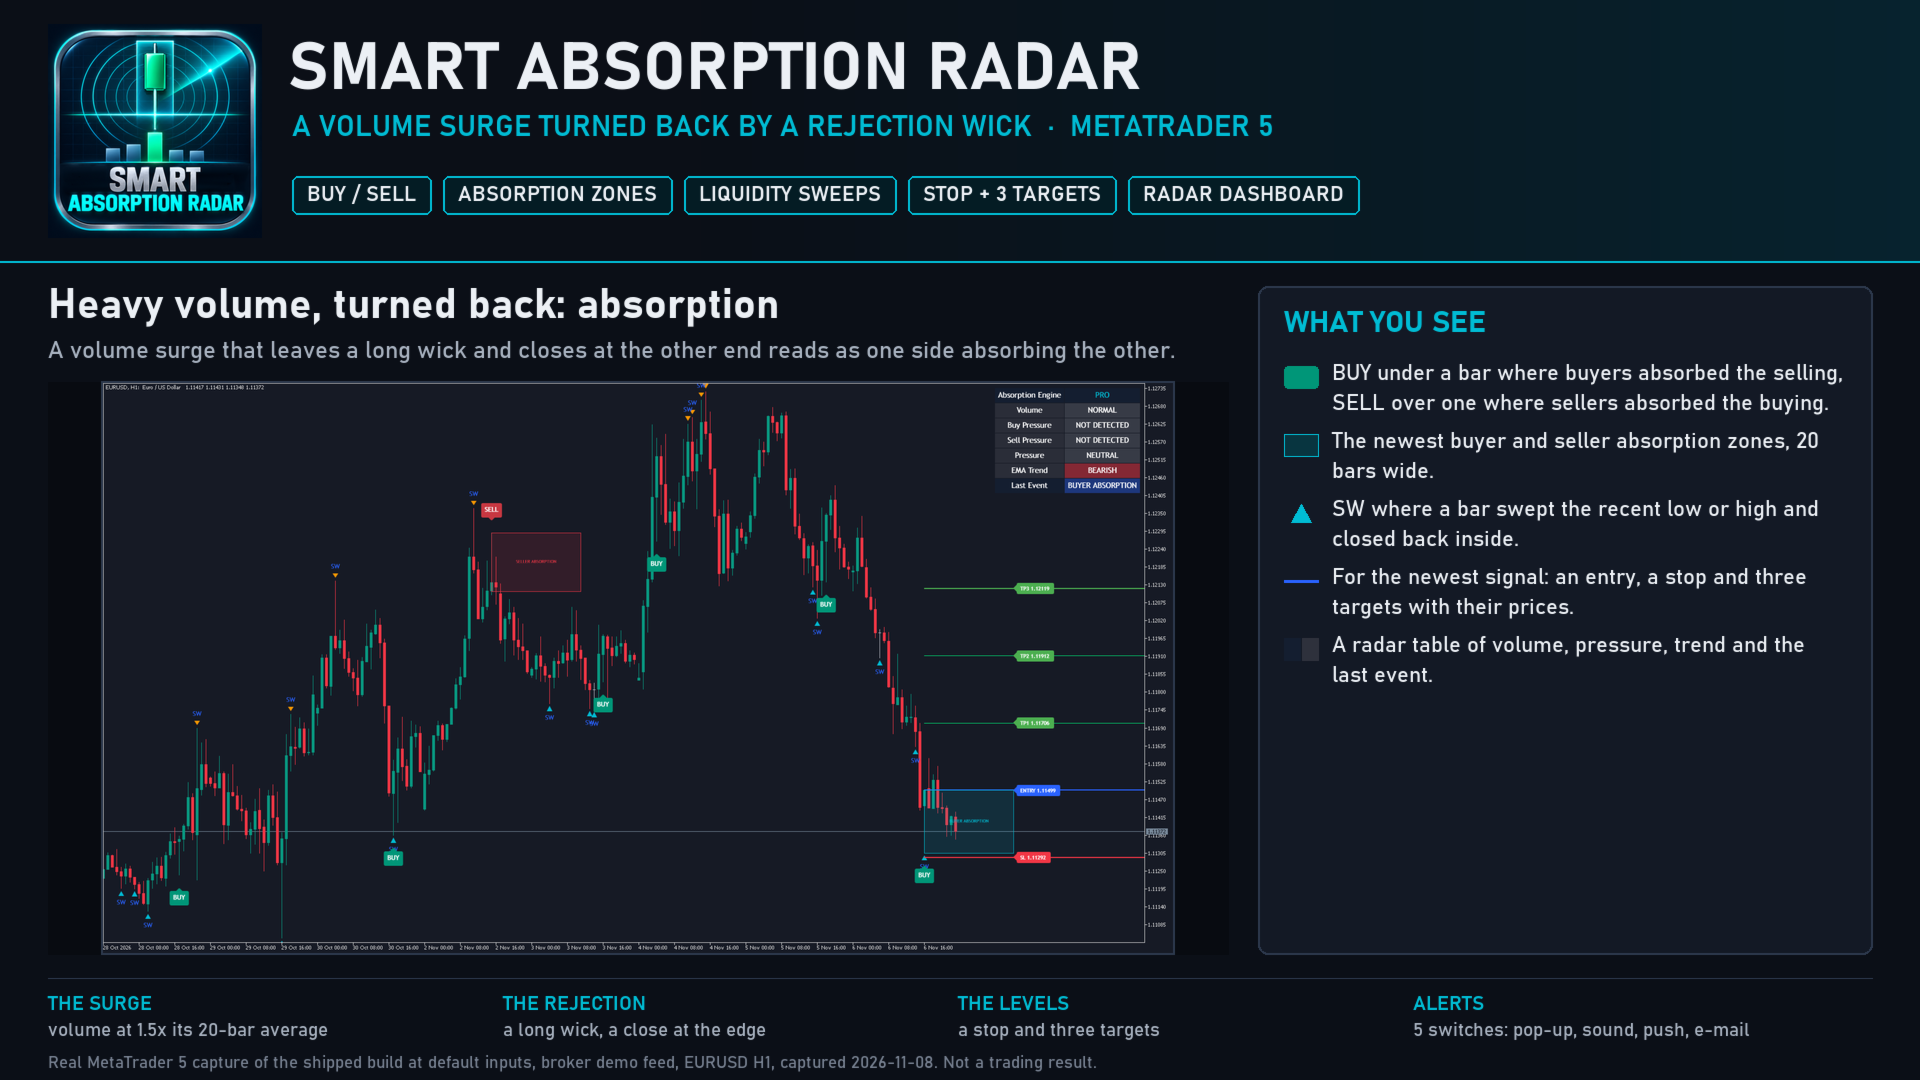
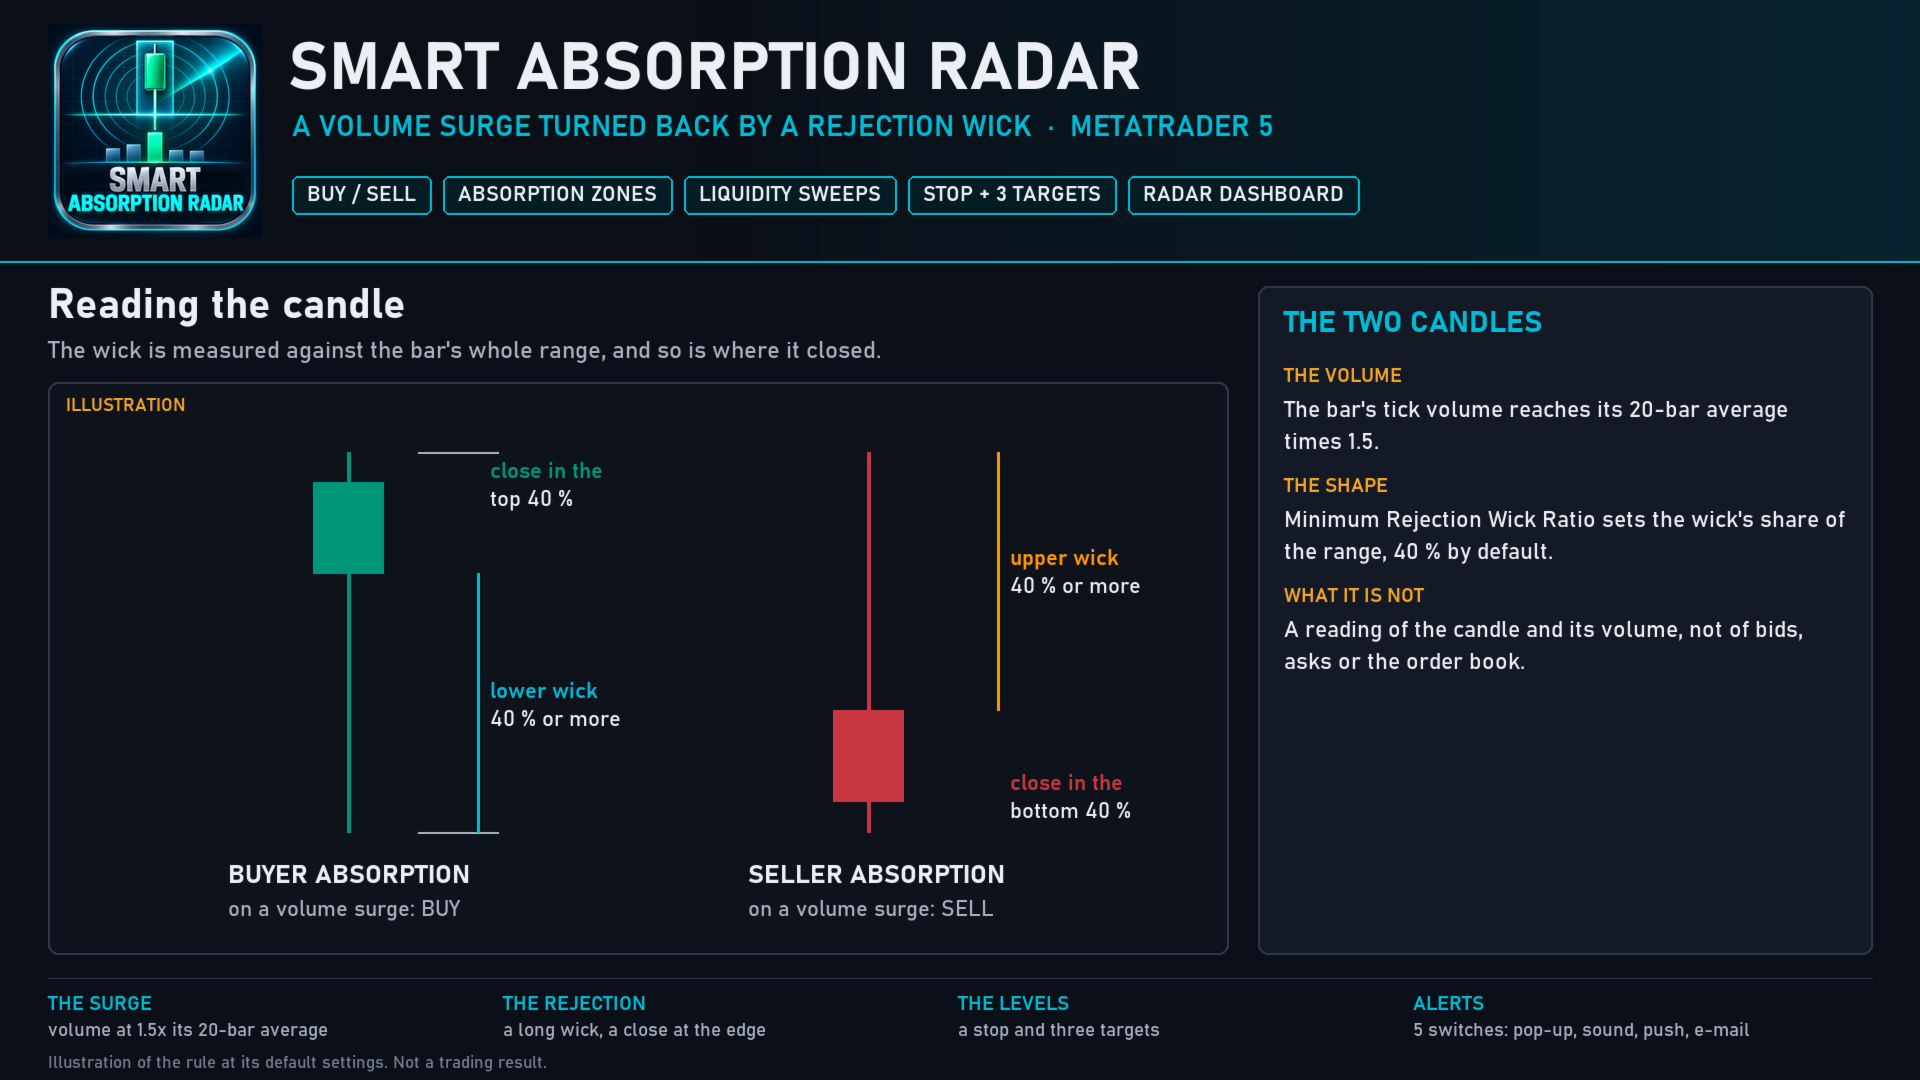
Smart Absorption Radar looks for one event: a bar where heavy volume tried to push price one way and was turned back. A volume surge that leaves a long lower wick and closes near the high reads as buyers absorbing the selling. A surge that leaves a long upper wick and closes near the low reads as sellers absorbing the buying. The indicator marks those bars with BUY and SELL, draws the zone each one left behind, marks sweeps of recent lows and highs, and plans a stop and three targets for the newest signal.
WHAT IT DRAWS
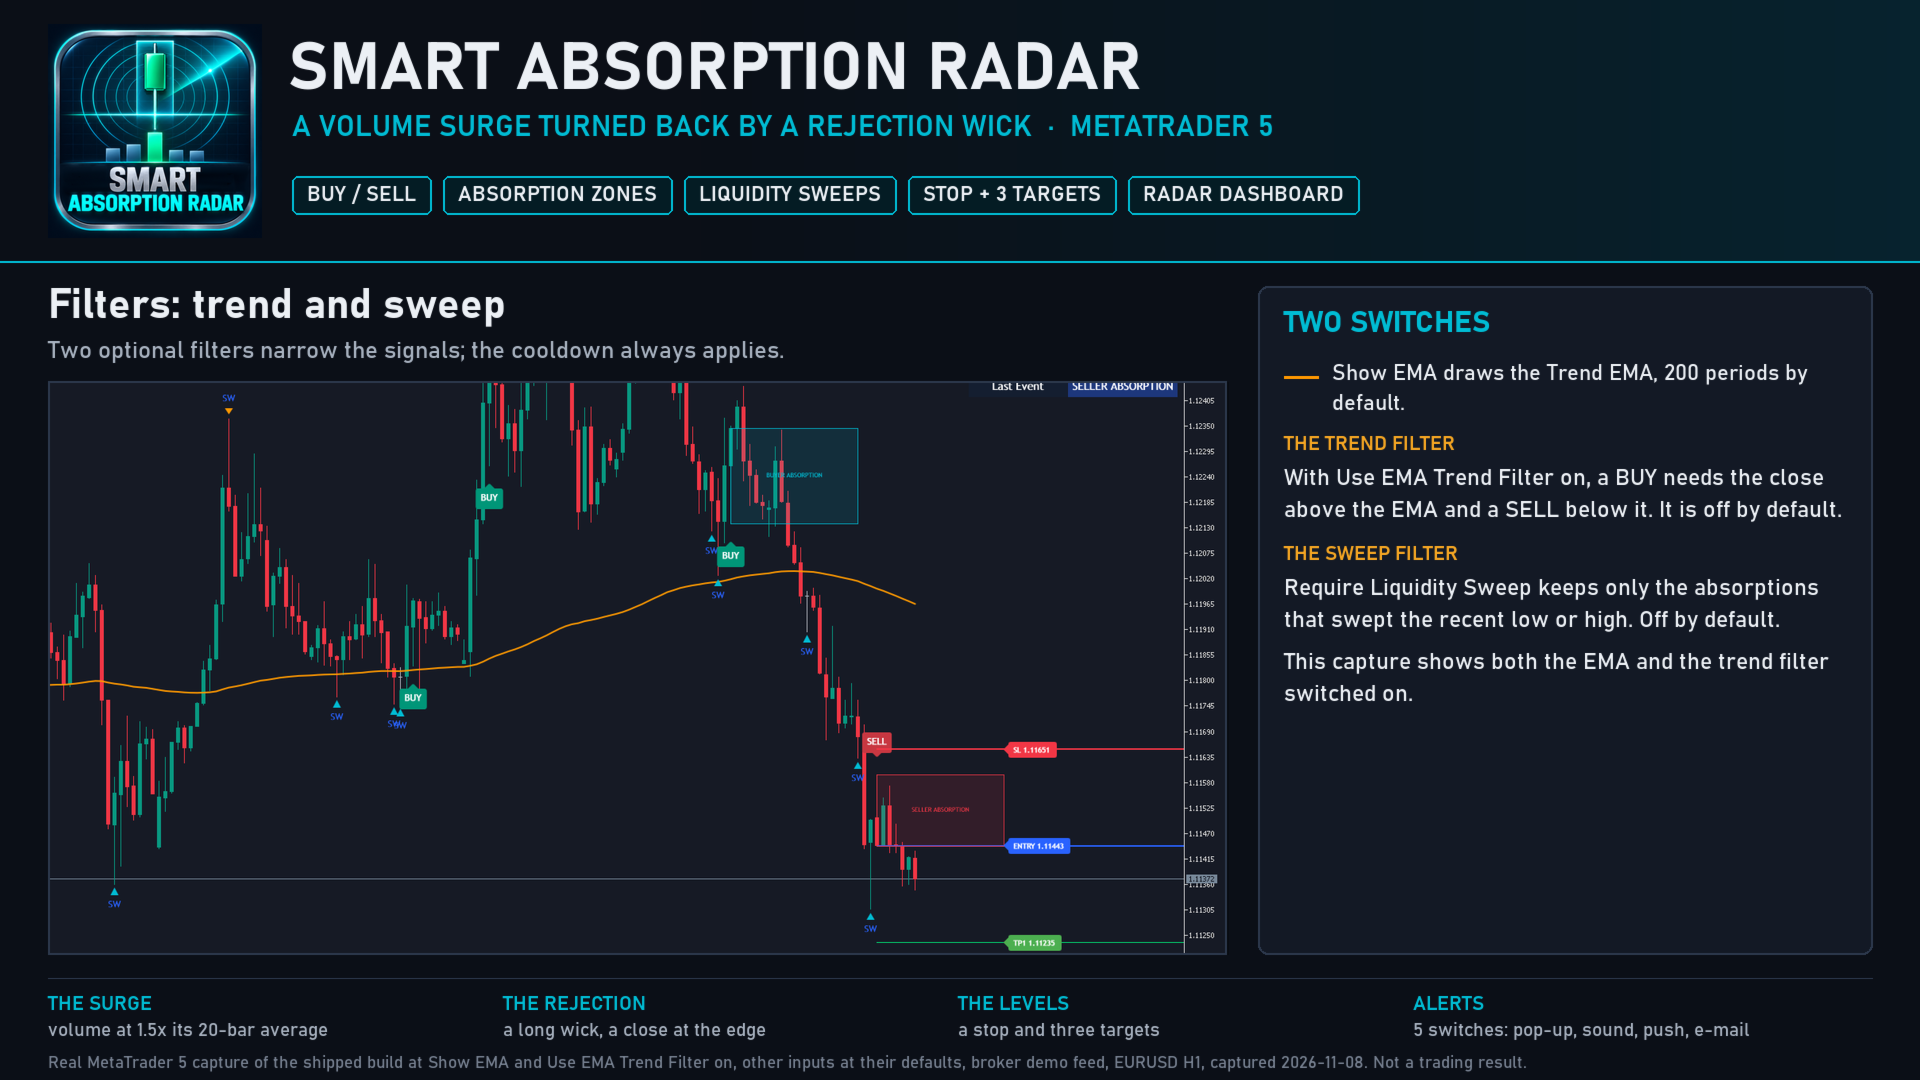
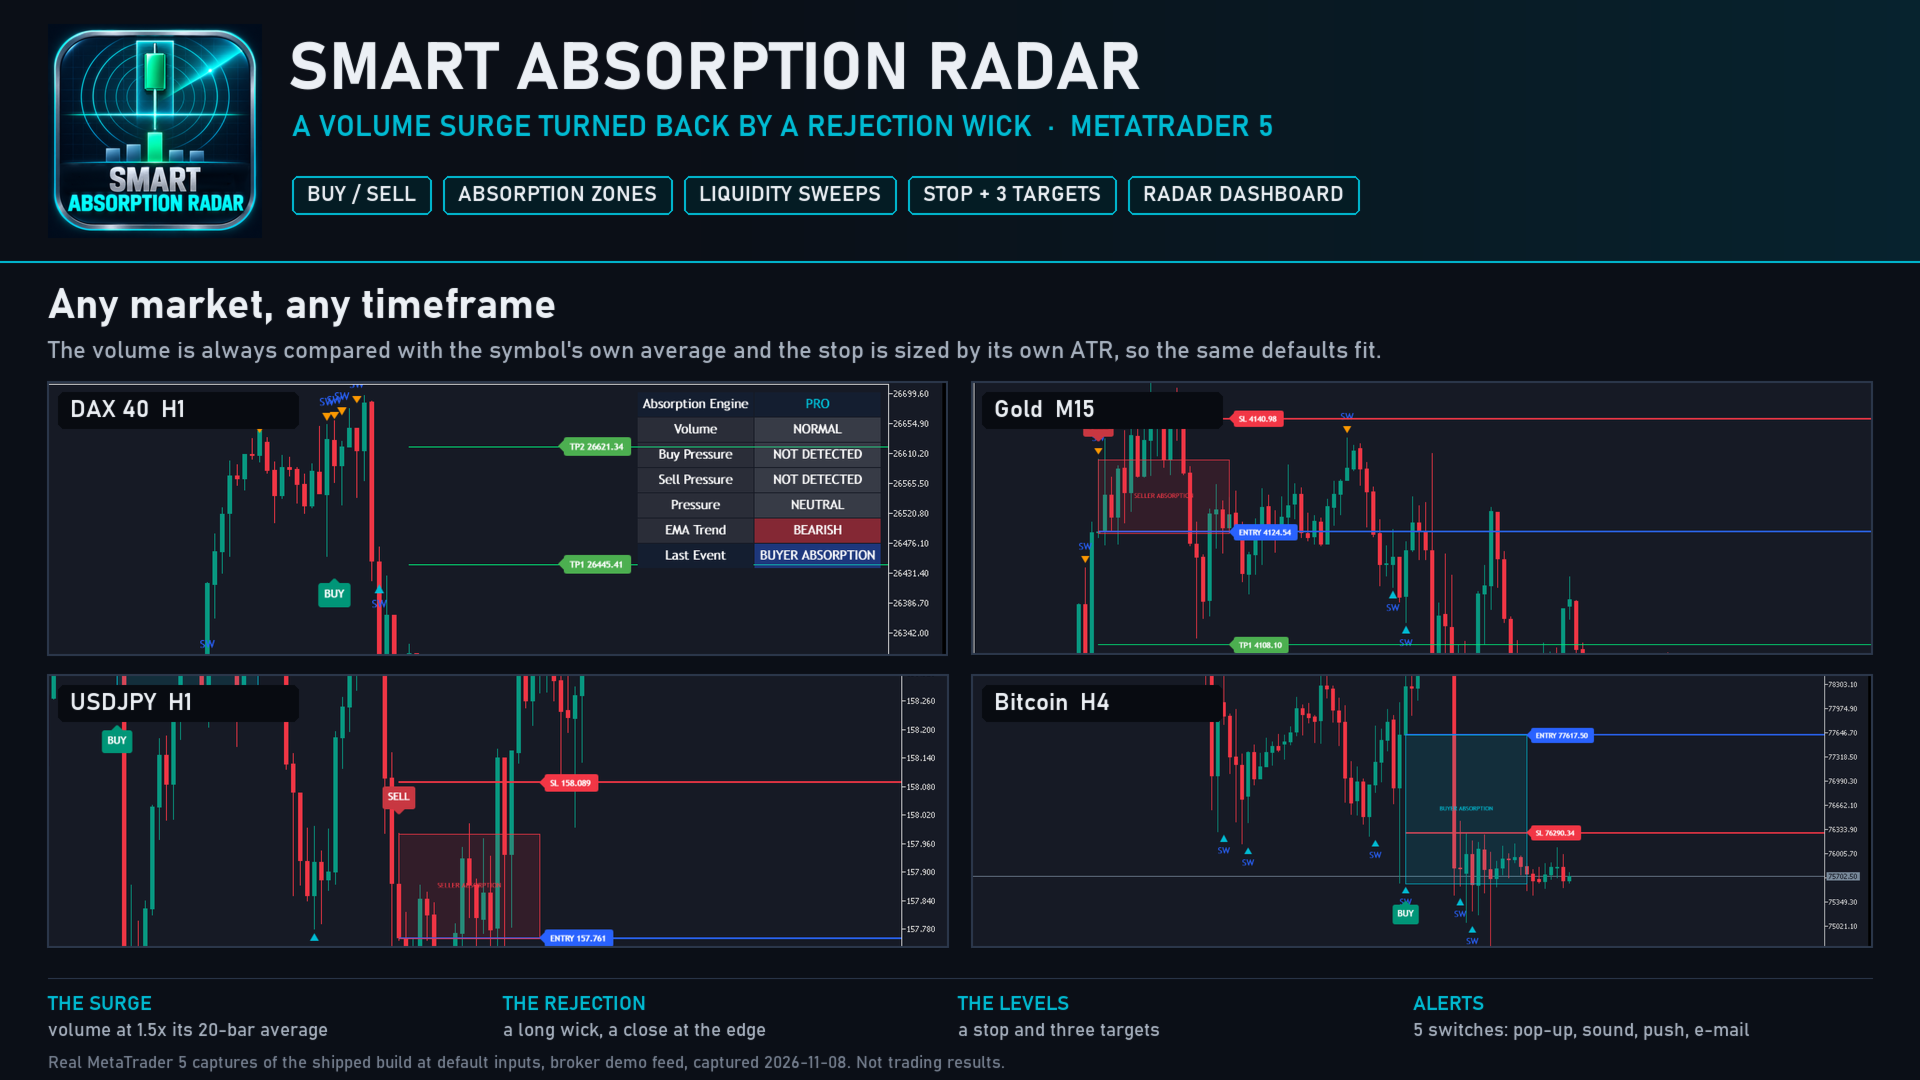
- BUY plates under buyer absorption bars and SELL plates over seller absorption bars.
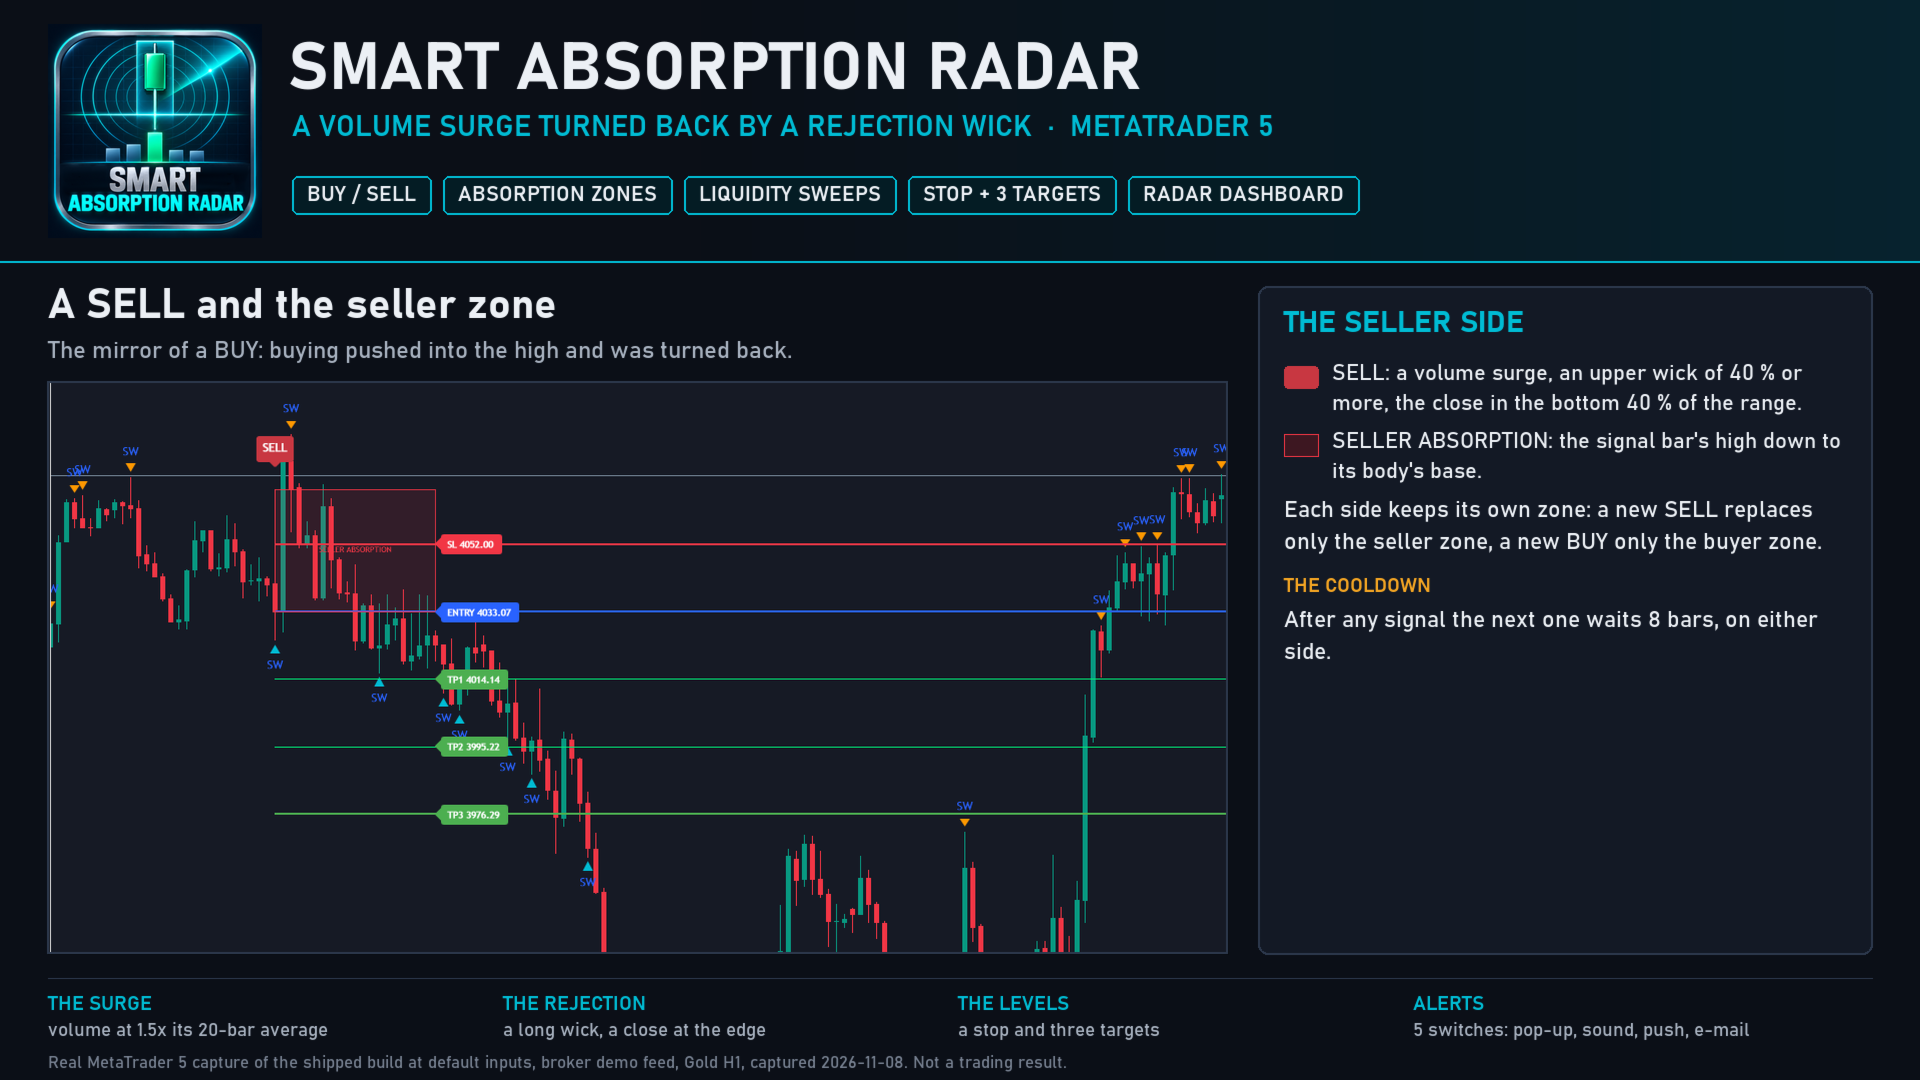
- A BUYER ABSORPTION zone from the newest BUY bar, from the top of its body down to its low, and a SELLER ABSORPTION zone from the newest SELL bar, from its high down to its body's base. Each reaches 20 bars to the right.
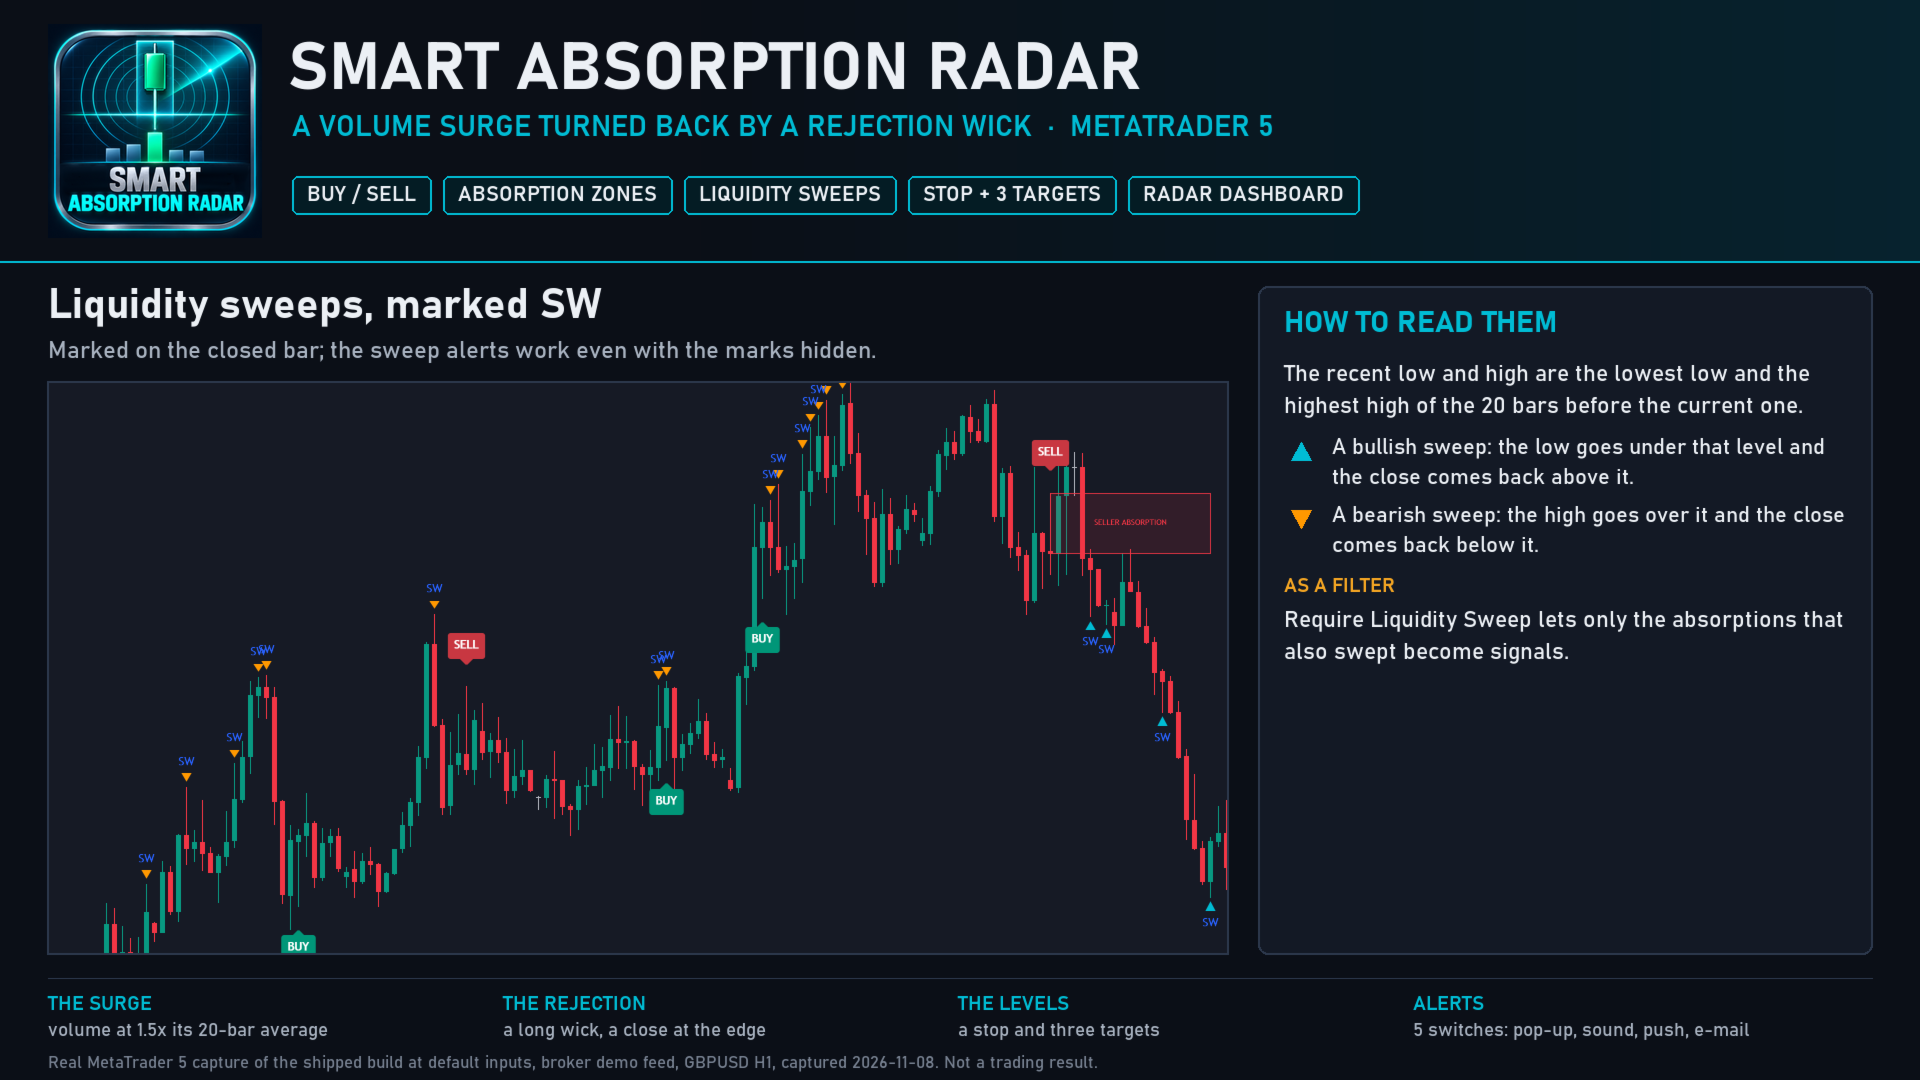
- SW marks: a small triangle under every bar that swept the recent low and closed back above it, and over every bar that swept the recent high and closed back below it.
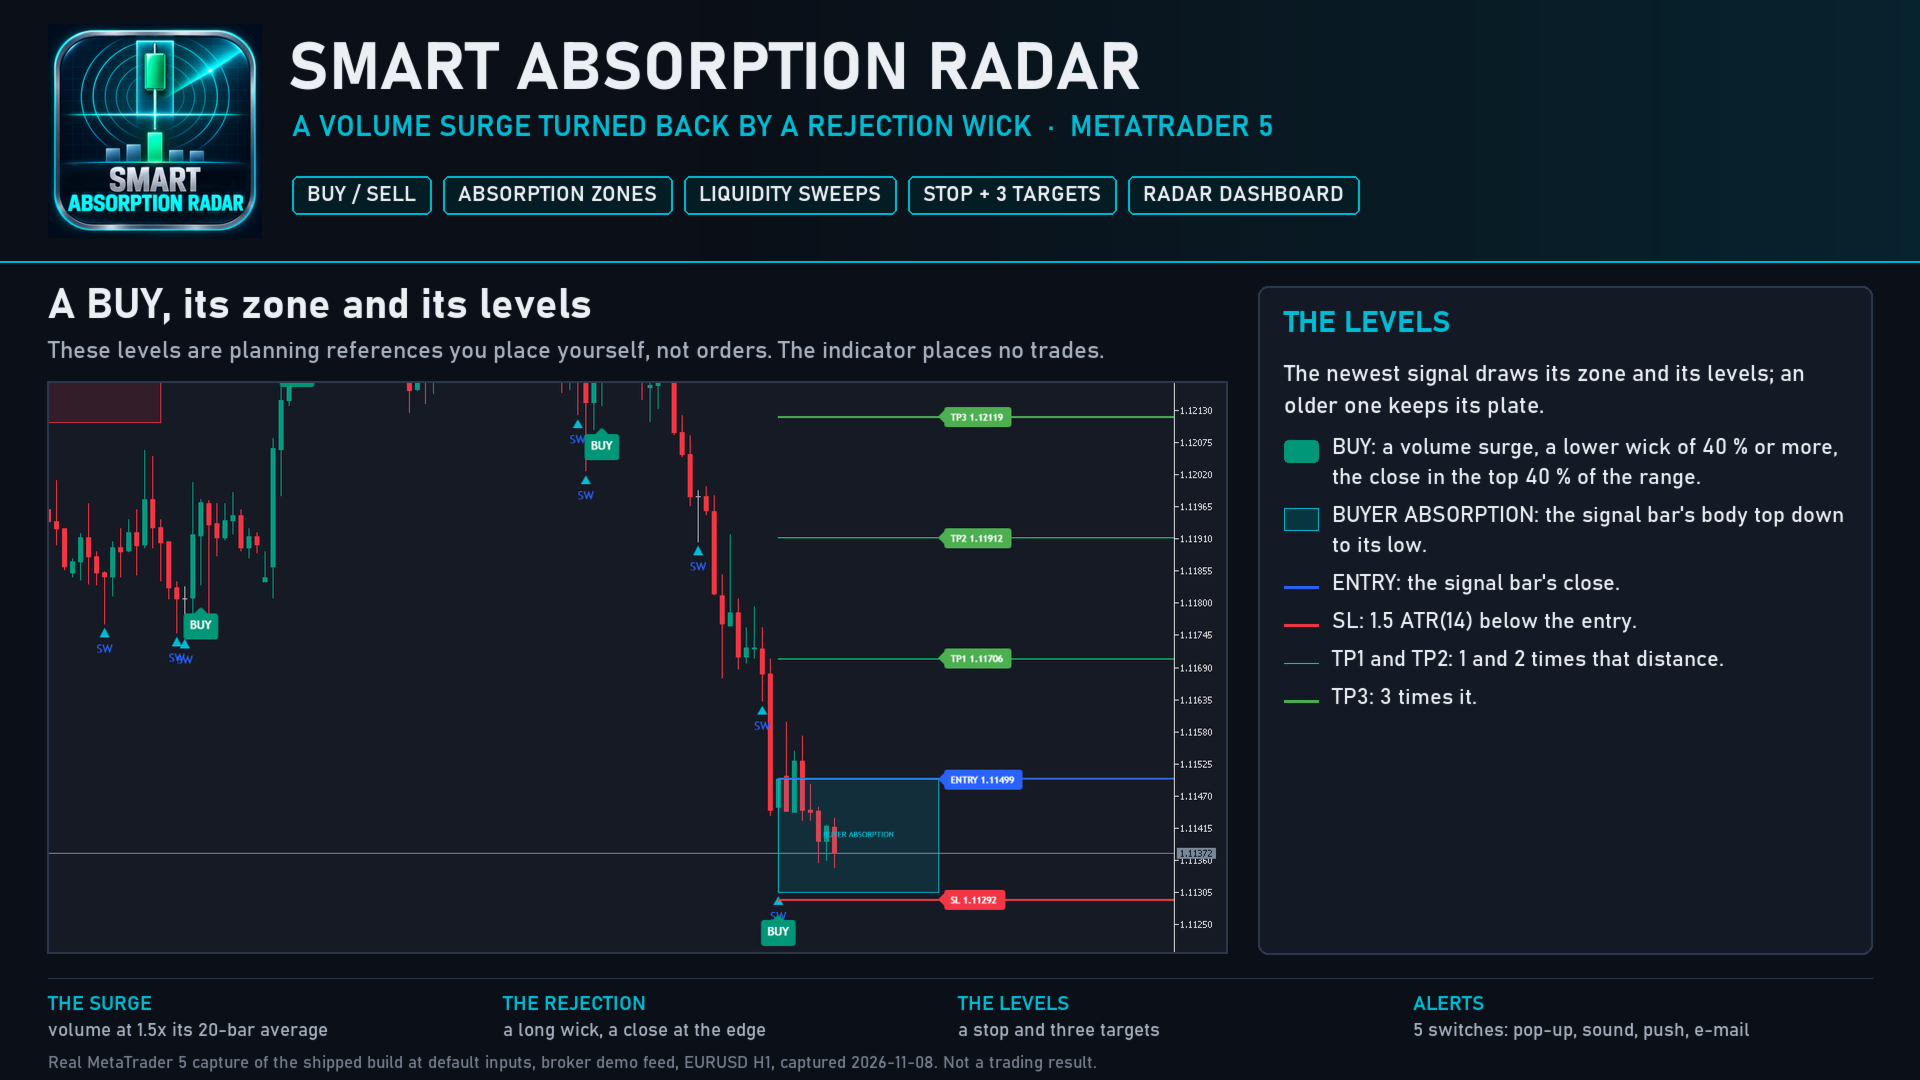
- For the newest signal, an entry line, a stop line and three target lines that run to the chart's right edge, with priced labels for ENTRY, SL, TP1, TP2 and TP3.
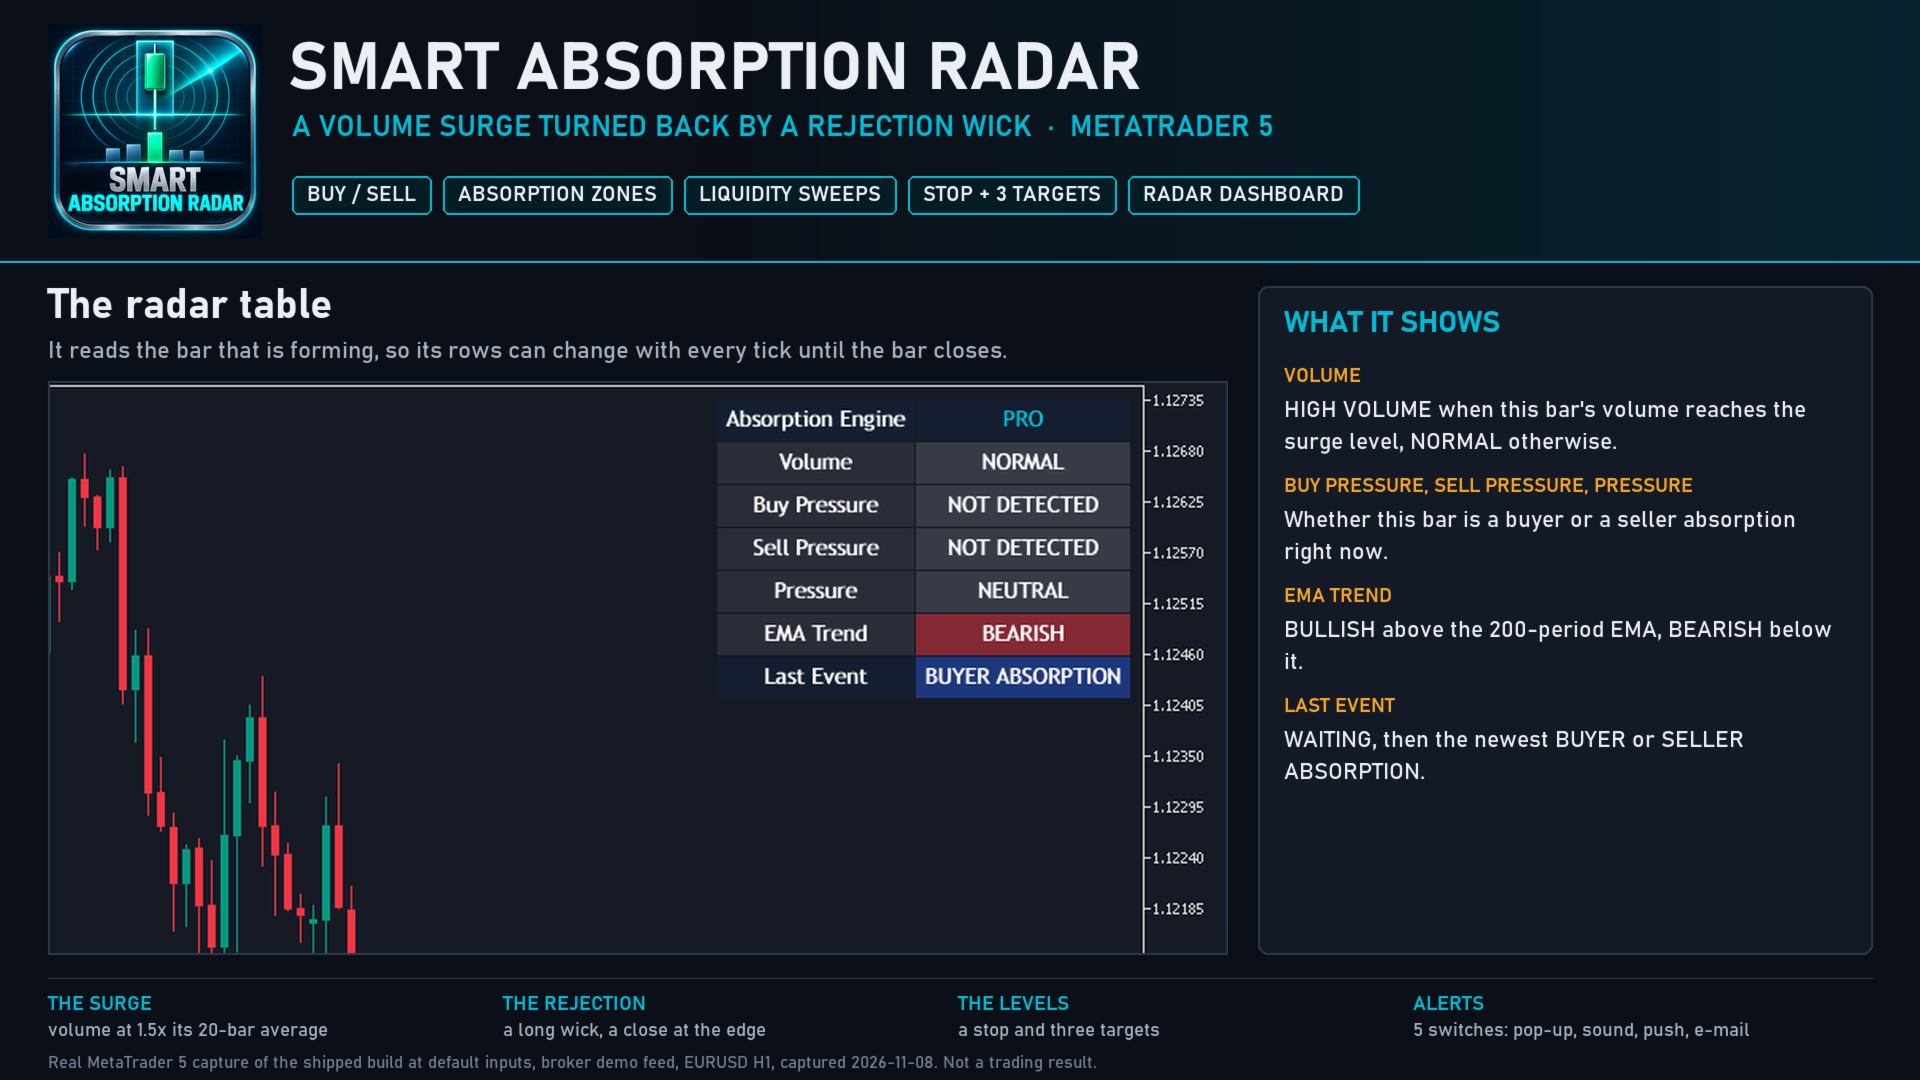
- A radar dashboard in the upper right corner: volume, buy pressure, sell pressure, the pressure reading, the EMA trend and the last event.
- An optional trend EMA line.
Everything is painted with real transparency and exact colours, so a translucent zone shows the candles under it. The painting follows every scroll, zoom and price-scale change.
HOW IT DECIDES
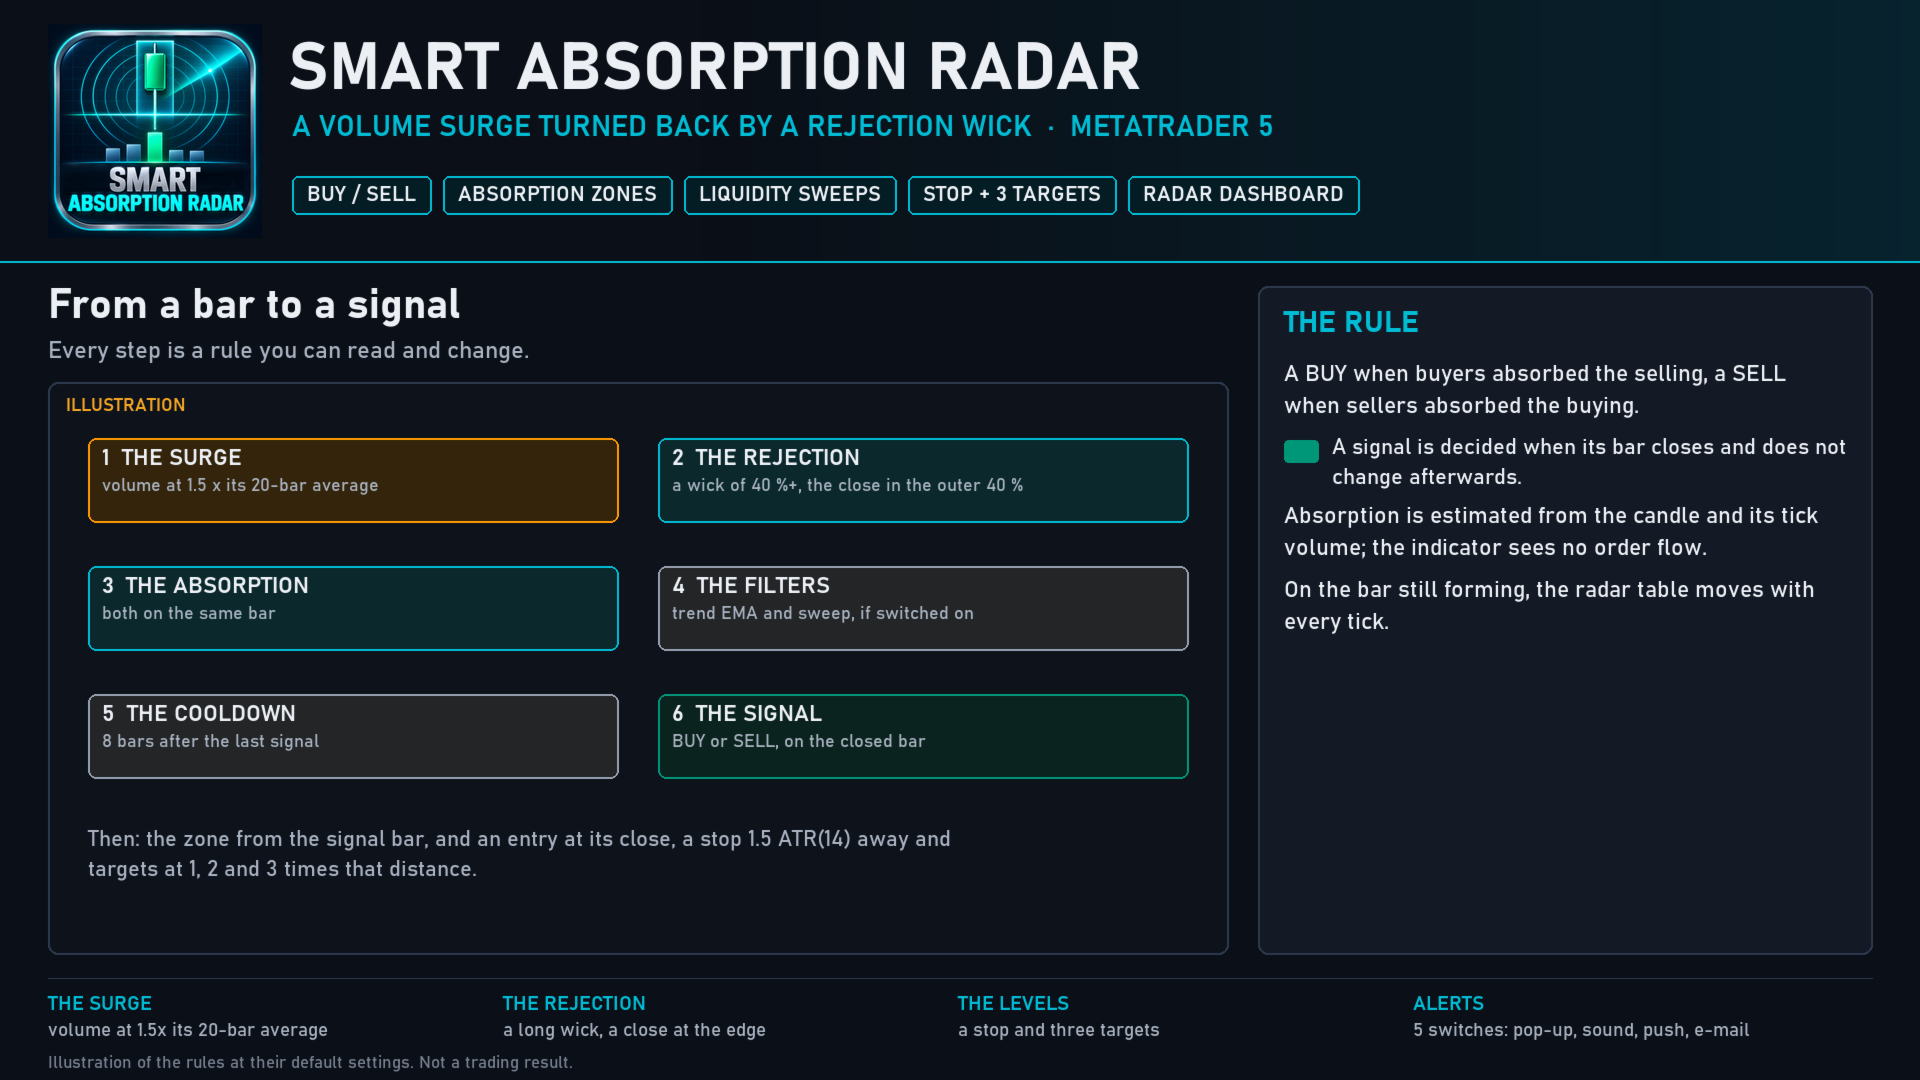
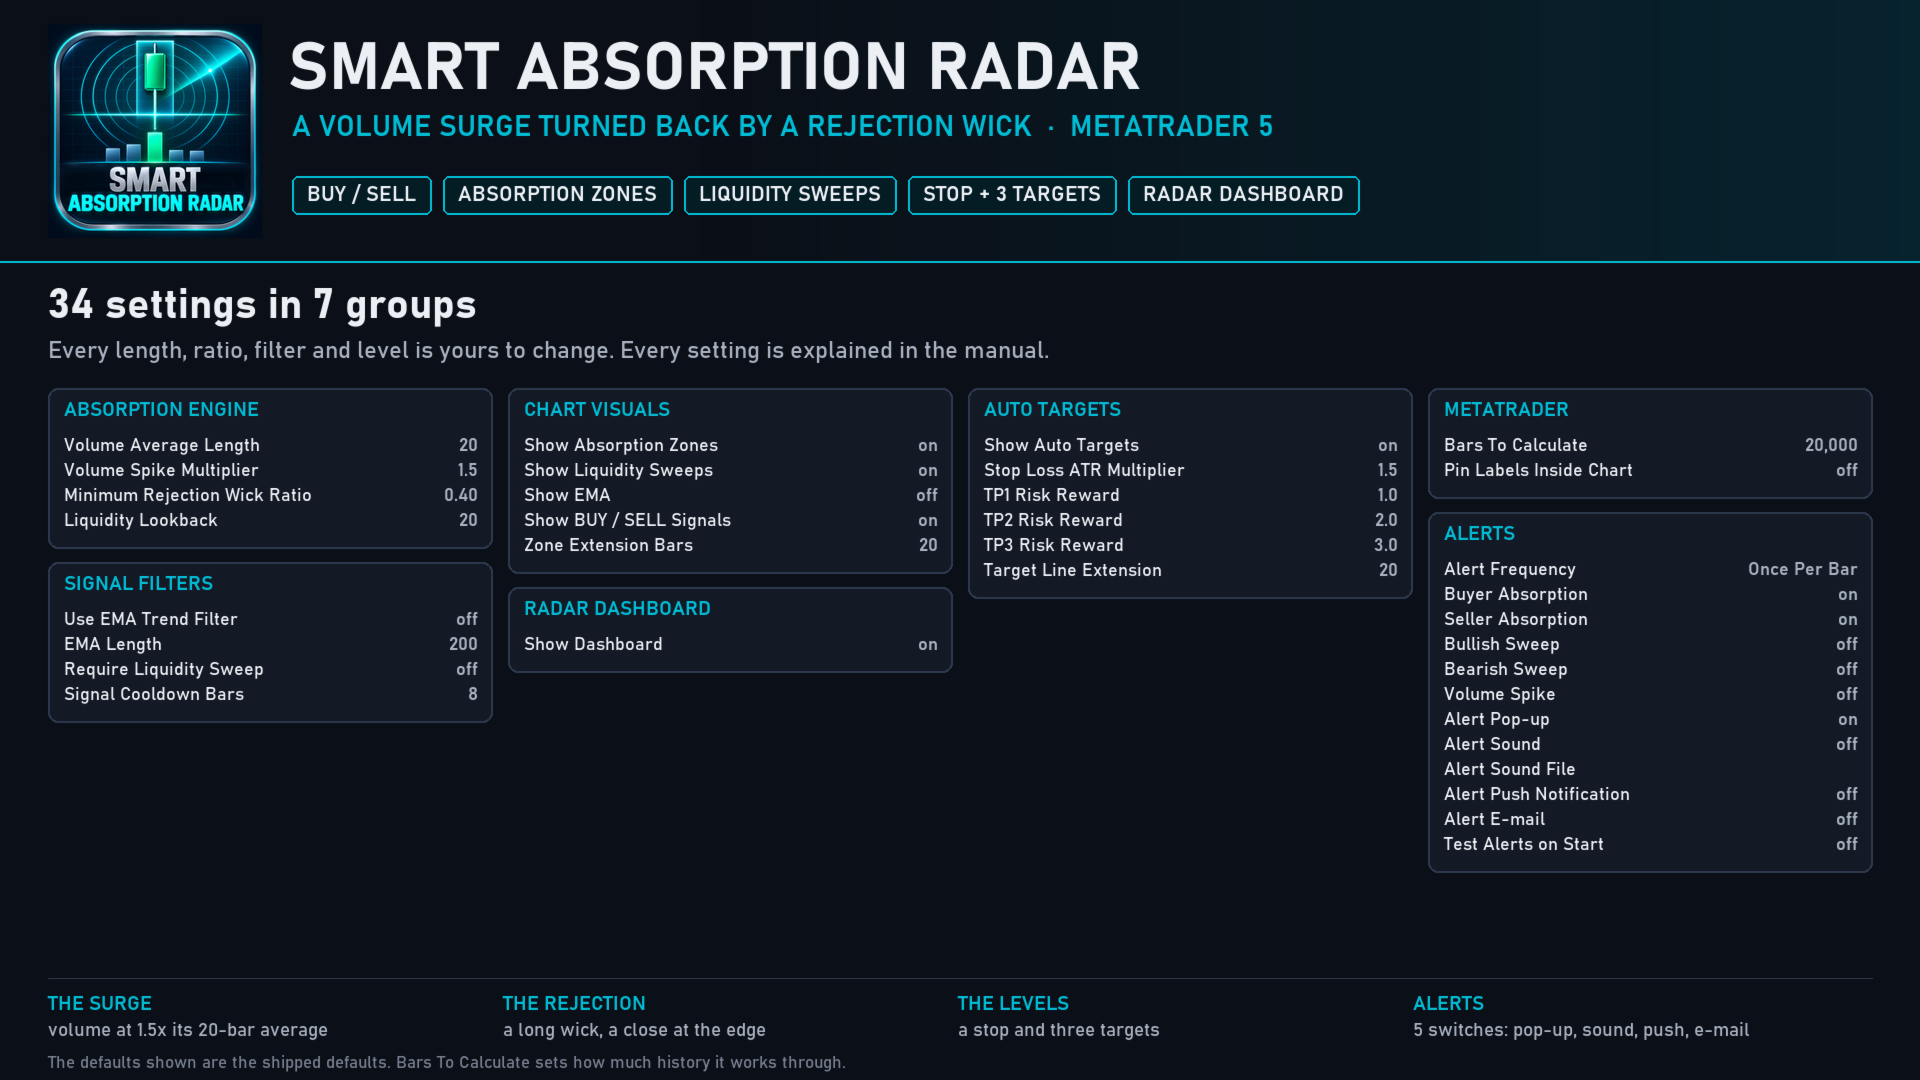
The volume surge. A bar's volume reaches its 20-bar average times 1.5.
The rejection. For buyers, the lower wick is at least 40 % of the bar's range and the close sits in the top 40 % of it. For sellers, the upper wick is at least 40 % of the range and the close sits in the bottom 40 %.
The signal. A surge and a rejection on the same closed bar make a buyer or seller absorption. It becomes a BUY or SELL when the switched-on filters agree: an optional EMA trend filter (BUY above a 200-period EMA, SELL below it), an optional sweep filter (the same bar must have swept the recent low or high), and a cooldown of 8 bars after the last signal on either side. A signal is decided when its bar closes and does not change afterwards.
The sweeps. The recent low and high are the lowest low and the highest high of the 20 bars before the current one. A bar whose low goes below that level and whose close comes back above it is a bullish sweep. A bar whose high goes above it and whose close comes back below it is a bearish sweep.
The levels. The entry is the signal bar's close. The stop sits 1.5 ATR(14) away, on the far side of the entry. The targets are 1, 2 and 3 times that distance. Every distance and multiple can be changed. These levels are planning references, not orders.
ALERTS
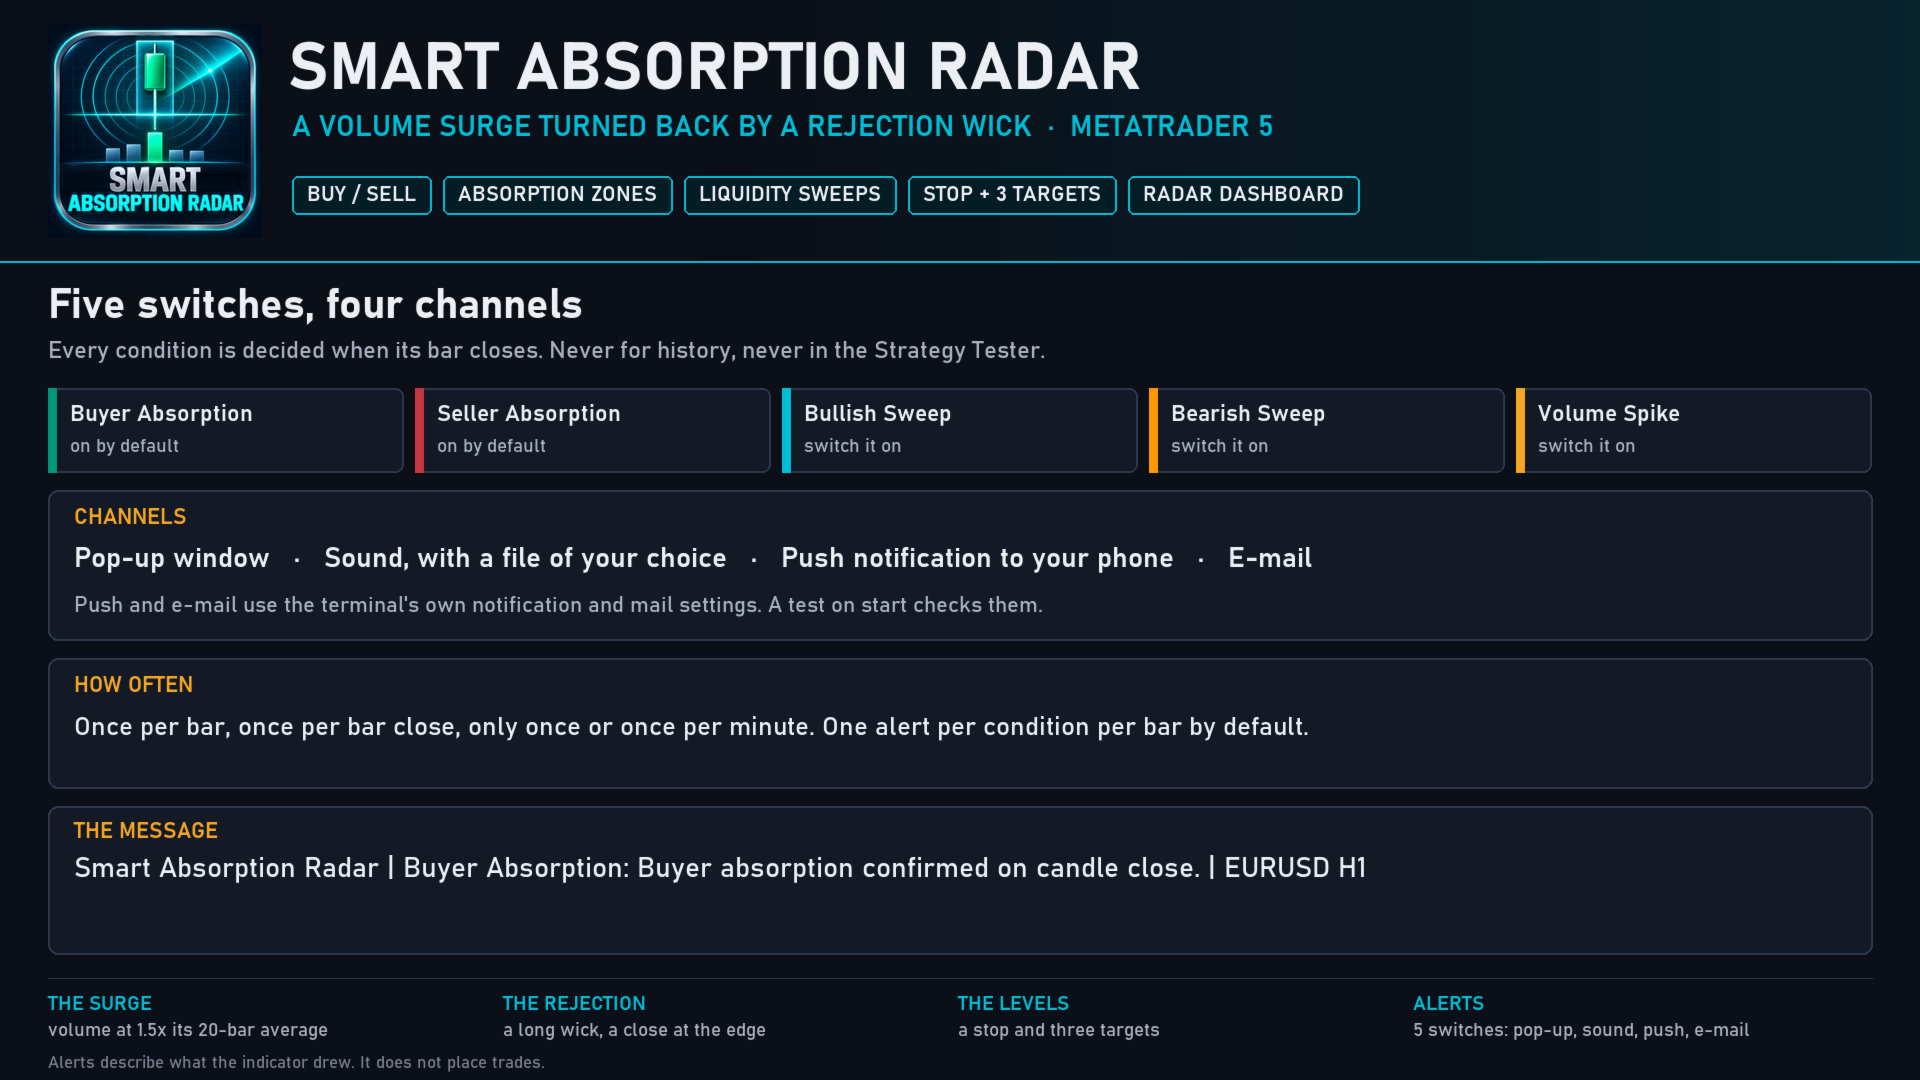
Five conditions, each with its own switch: Buyer Absorption and Seller Absorption are on by default, and Bullish Sweep, Bearish Sweep and a high-volume bar alert can be switched on. Each can arrive as a pop-up, a sound of your choice, a push notification to your phone and an e-mail, and a test on start checks your settings without waiting for a signal. One setting chooses once per bar, once per bar close, only once or once per minute. Every condition is decided when its bar closes. Nothing fires while the indicator walks the chart's history, and nothing fires in the Strategy Tester. An alert reads like this:
Smart Absorption Radar | Buyer Absorption: Buyer absorption confirmed on candle close. | EURUSD H1
WHAT IT DOES NOT DO
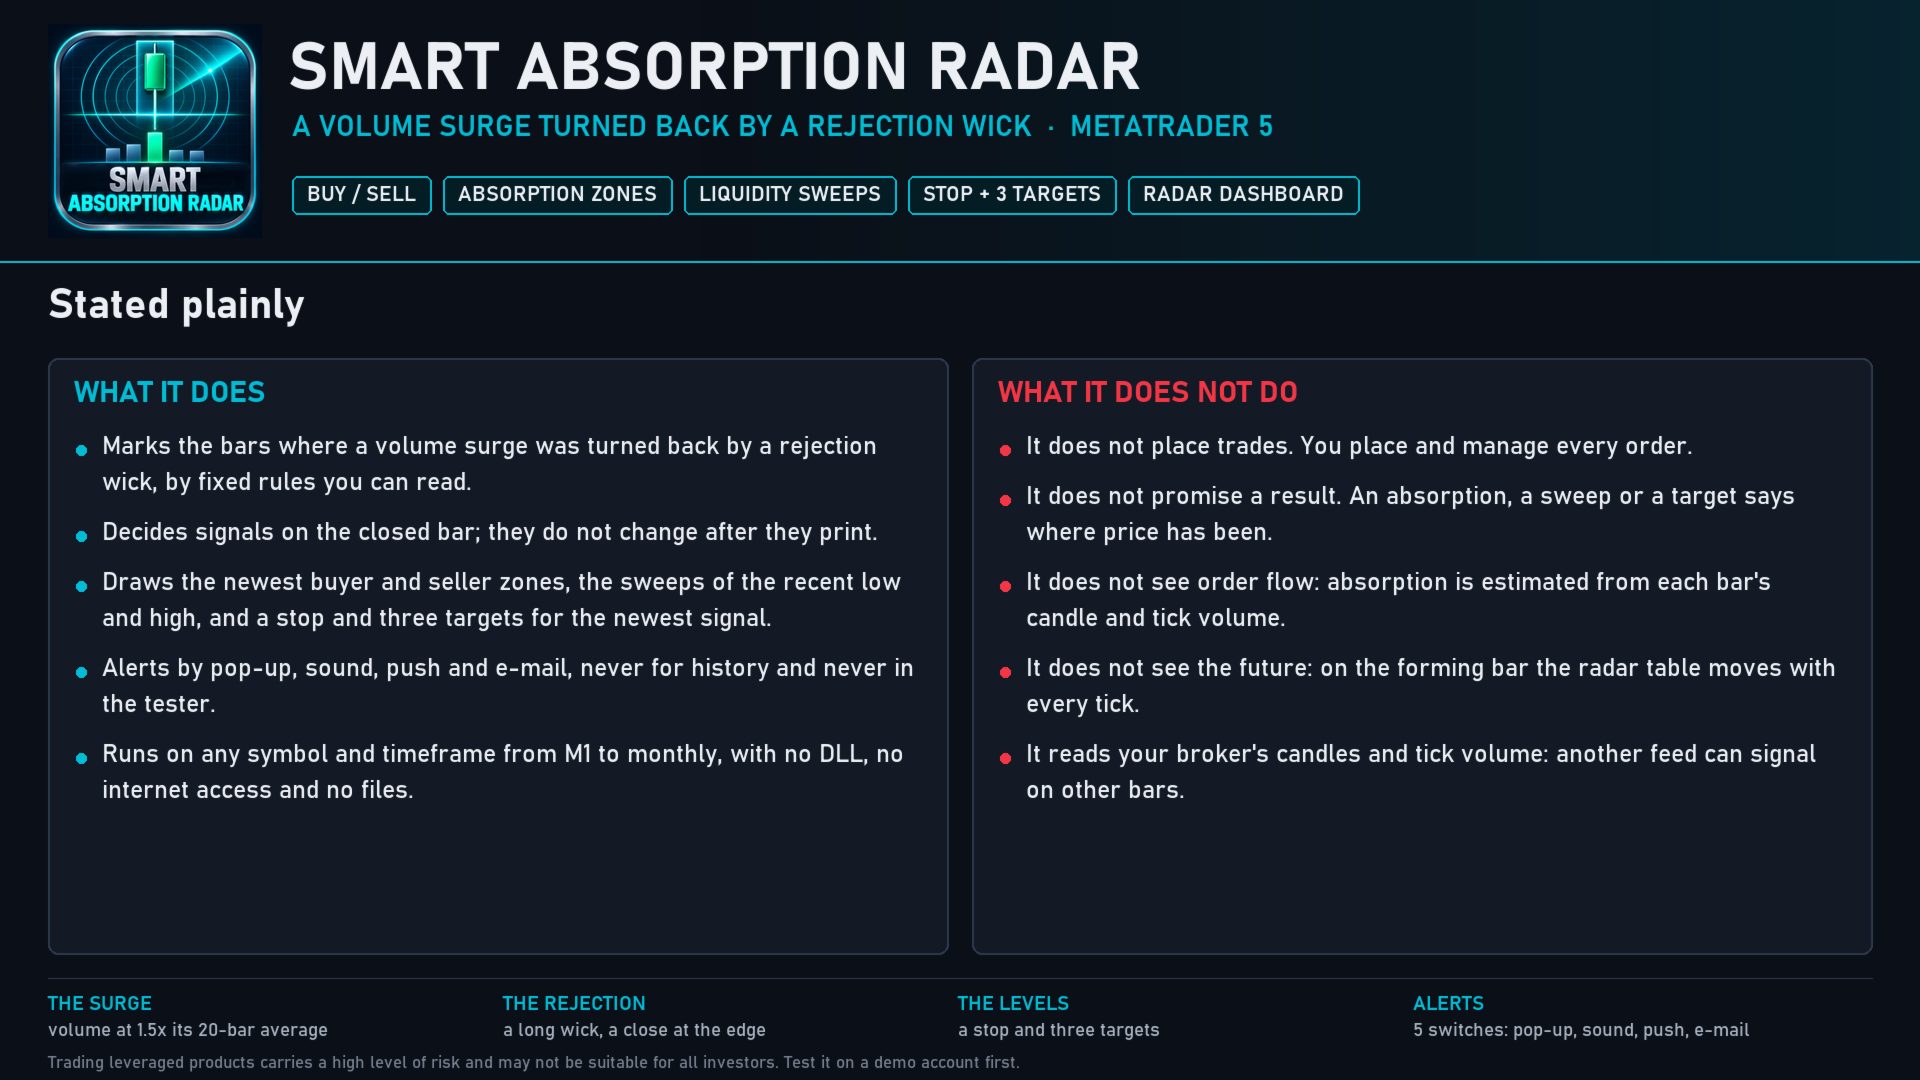
- It does not place trades. It draws and alerts; you place and manage every order.
- It does not promise a result. An absorption, a sweep or a target says where price has been, not where it will go.
- It does not see the future. On the bar that is still forming, the dashboard moves with every tick; a signal, a sweep mark and an alert wait for the closed bar.
- It does not see order flow. Absorption is estimated from each bar's candle and tick volume; the indicator sees no bids, asks or order book.
SETTINGS AND NOTES
- 34 inputs in 7 groups, each explained in the manual. It runs on any symbol and timeframe from M1 to monthly: forex, metals, indices and crypto. The stop and the targets are sized by the symbol's own ATR, and the volume is always compared with the same symbol's own average, so the same settings fit each market.
- Bars To Calculate (20,000 by default) sets how much history it works through, and keeps loading fast.
- The target labels sit 20 bars past the signal, so give the chart some room on the right with the chart shift, or switch on Pin Labels Inside Chart to pull them in.
- Every signal starts from your broker's tick volume and candles, so another feed can signal on other bars. The trade levels are drawn for the newest signal only and are not followed afterwards.
- No DLL, no internet access and no files: the indicator only reads the chart it is attached to.
Trading leveraged products carries a high level of risk and may not be suitable for all investors. Smart Absorption Radar is an analysis tool, not financial advice. Test it on a demo account first.