Hourly Volatility Profile
- Indicatori
-
Mohamed-amine Baddir
 I miei strumenti per MetaTrader 5 nel Market (ognuno si può provare gratis nel tester di strategia prima dell'acquisto):
- Versione: 1.0
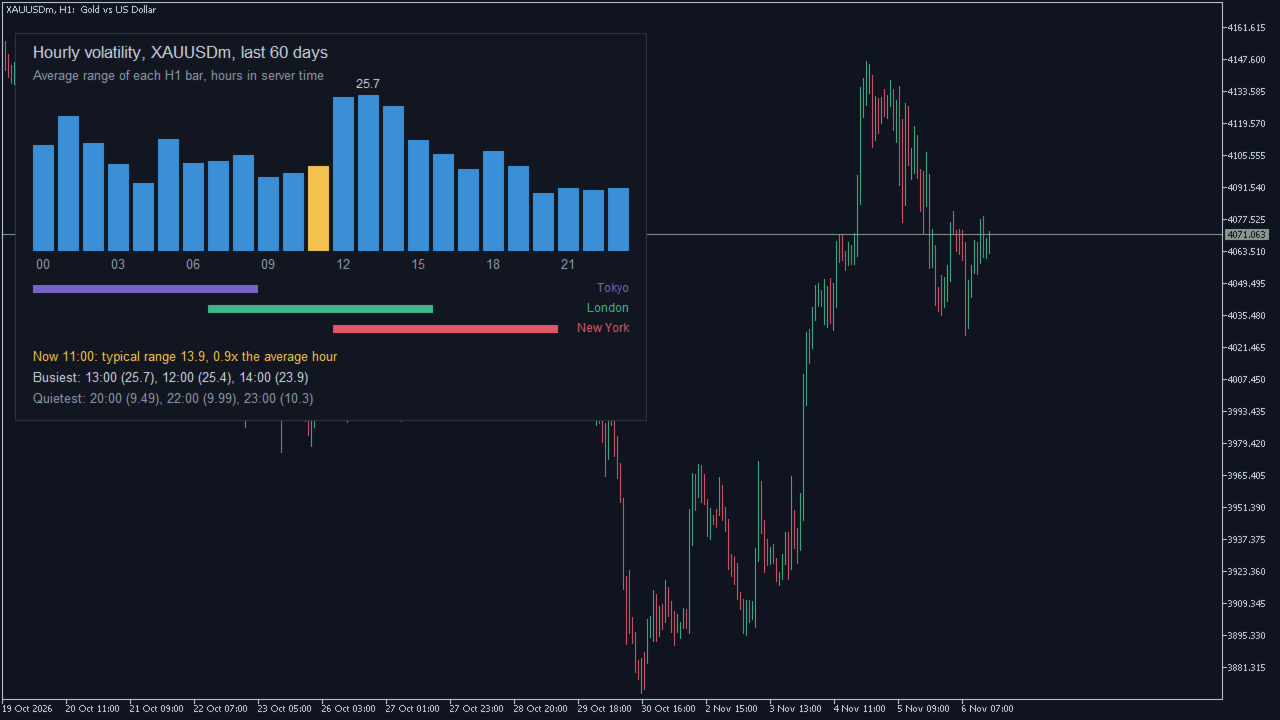
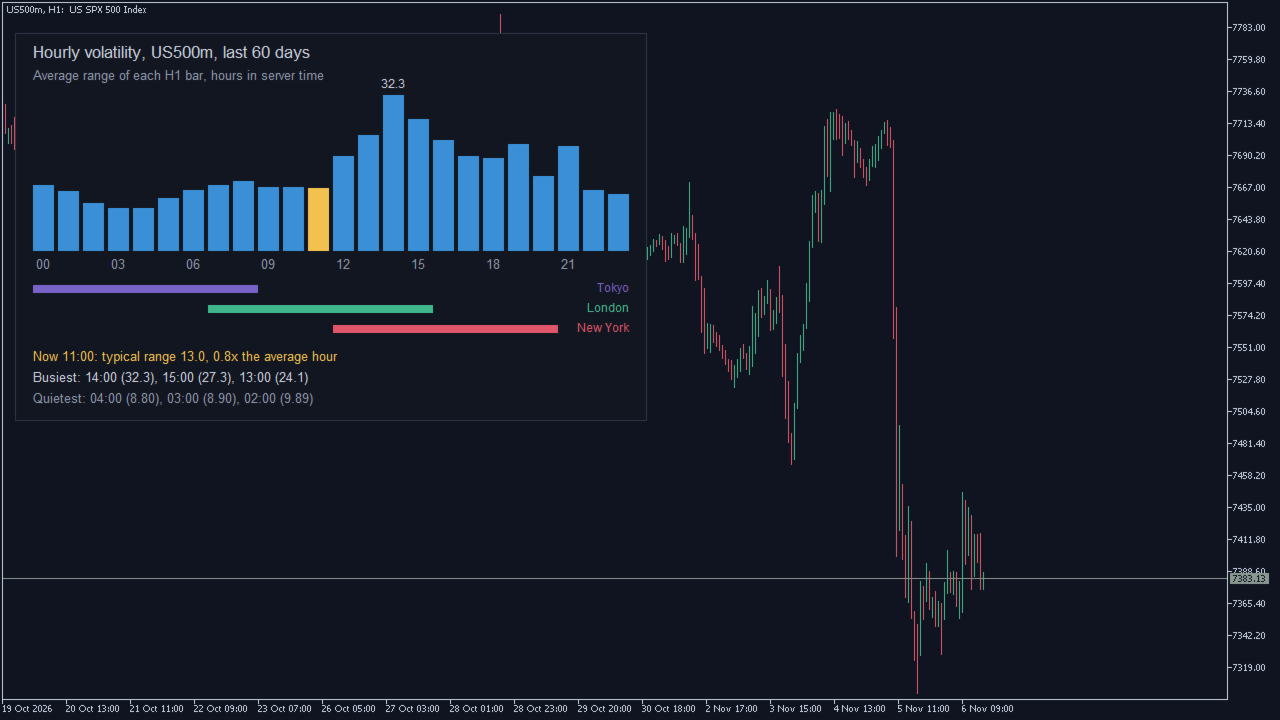
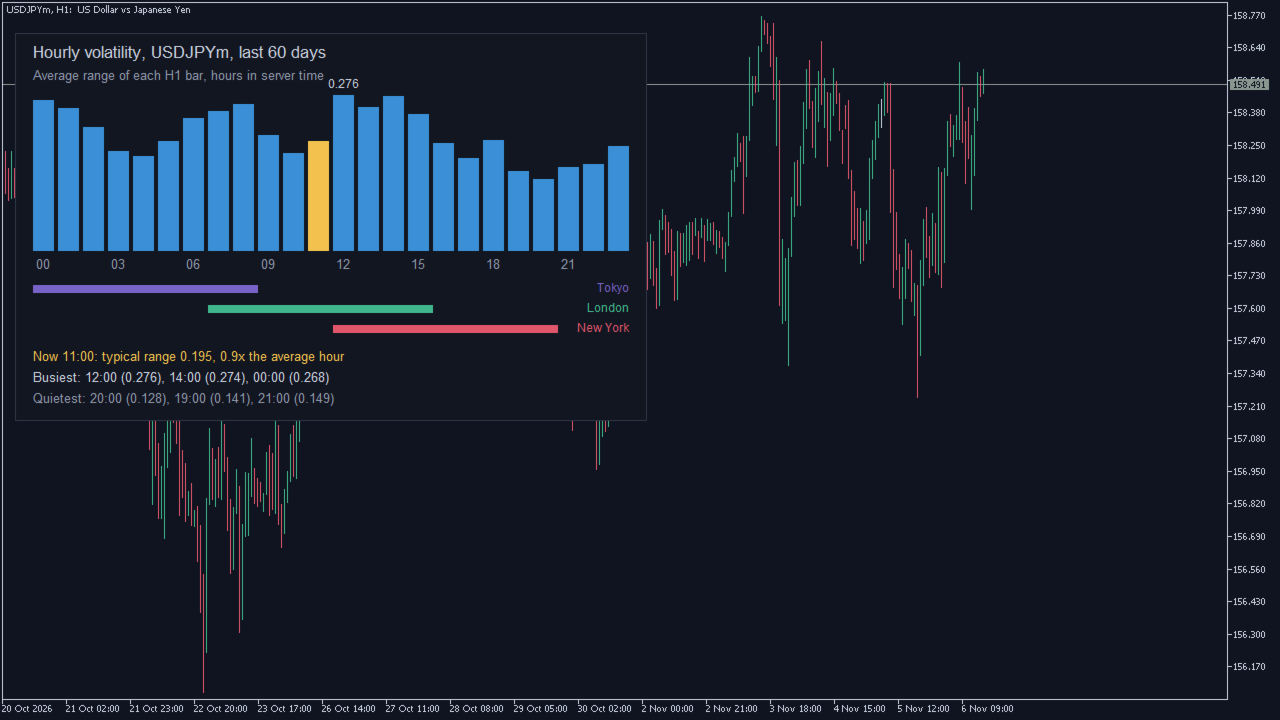
Hourly Volatility Profile shows how far the chart's symbol typically moves in each hour of the day. It averages the range of every H1 bar over the last 60 days (you choose the number of days) and draws one bar per hour, with the current hour highlighted and the Tokyo, London and New York sessions underneath.
Use it to see when your market is active and when it is quiet: to time entries, to know when a stop is most likely to be tested, to judge whether a move in the current hour is unusual, or to choose the hours an Expert Advisor should trade.
What it shows
- 24 bars: the average high-low range of each hour, in the symbol's price units
- The current hour in a different colour, with its typical range and how it compares with the average hour
- The three busiest and the three quietest hours, with their typical ranges
- The Tokyo, London and New York sessions, placed in the time you chose
- Hover a bar to see its exact value and how many bars it is based on
Settings
- Days of history (default 60)
- Hours in broker server time or in UTC
- Show the sessions
- Panel position and size
- Colours
Notes
- Works on any symbol and any chart timeframe; it reads the H1 history itself. Gold, indices and currency pairs each have a very different daily shape (see the screenshots).
- It recalculates once an hour, so it does not slow the chart down.
- It only reads price history: no trading, no DLL, no internet connection.
More from the author: Gemina, an Expert Advisor for gold and USD/JPY, and IndexDip, an Expert Advisor for the S&P 500 and the Nasdaq 100.