AlgoTrade Correlation Matrix
- Indicatori
- Versione: 1.1
- Aggiornato: 3 novembre 2026

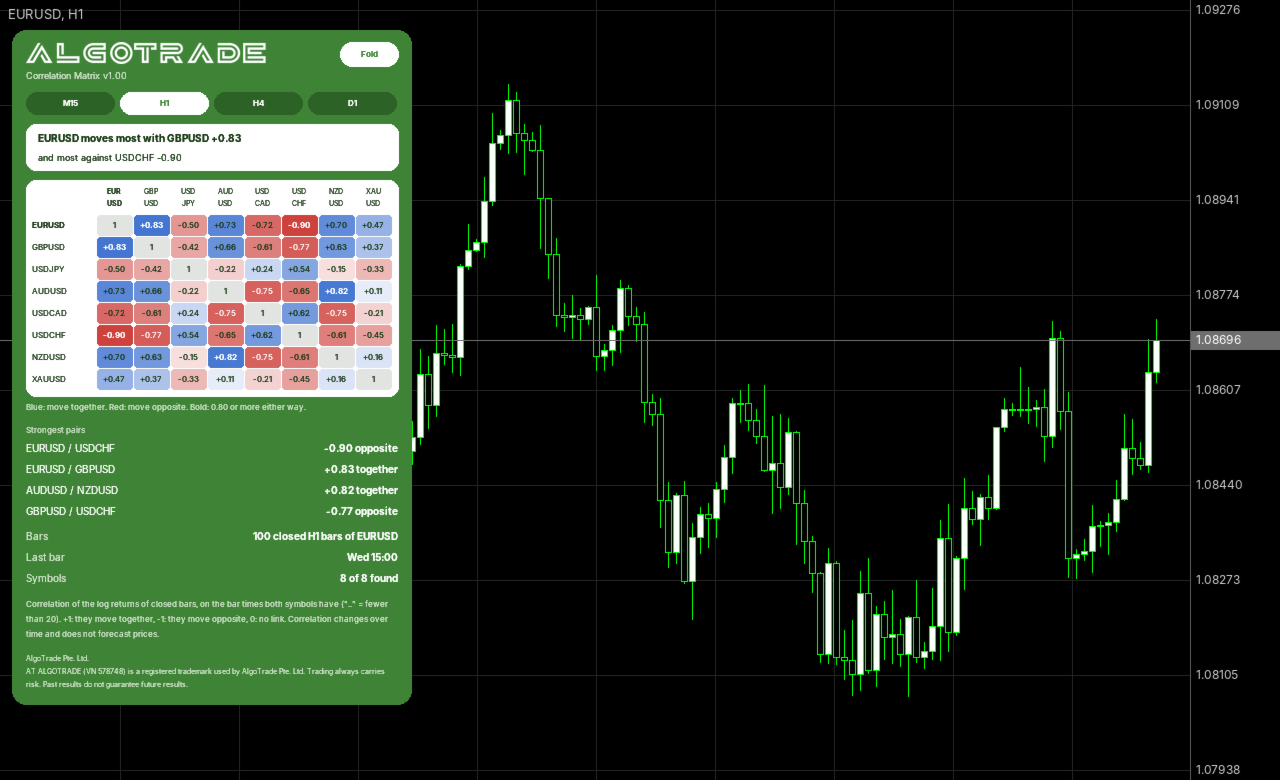
AlgoTrade Correlation Matrix shows how the symbols of your list move together, as a colored matrix on a card, with the symbols that move most with and most against the chart symbol. It reads data only.
What it does
- Up to 10 symbols from a comma separated list (by default EURUSD, GBPUSD, USDJPY, AUDUSD, USDCAD, USDCHF, NZDUSD, XAUUSD). The chart symbol is added when it is not in the list.
- Finds each symbol at your broker, with the chart symbol's prefix and suffix (for example EURUSD.pc).
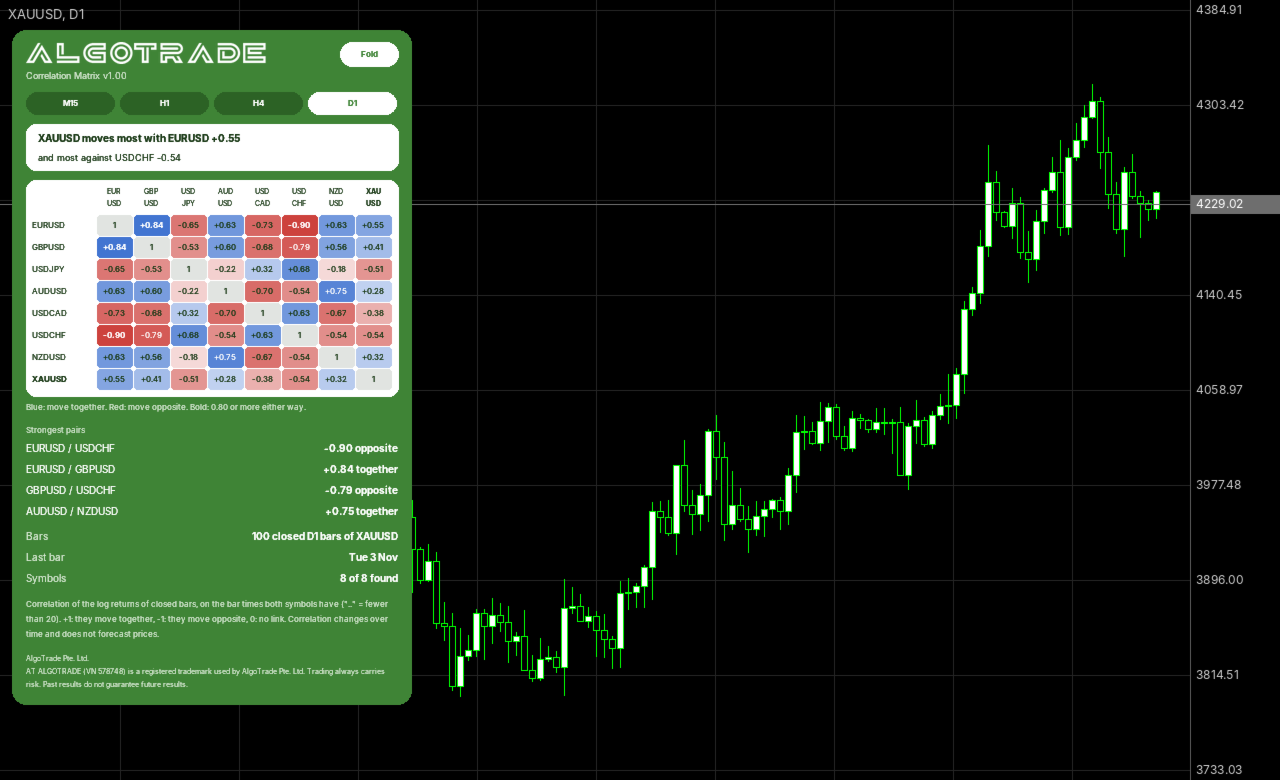
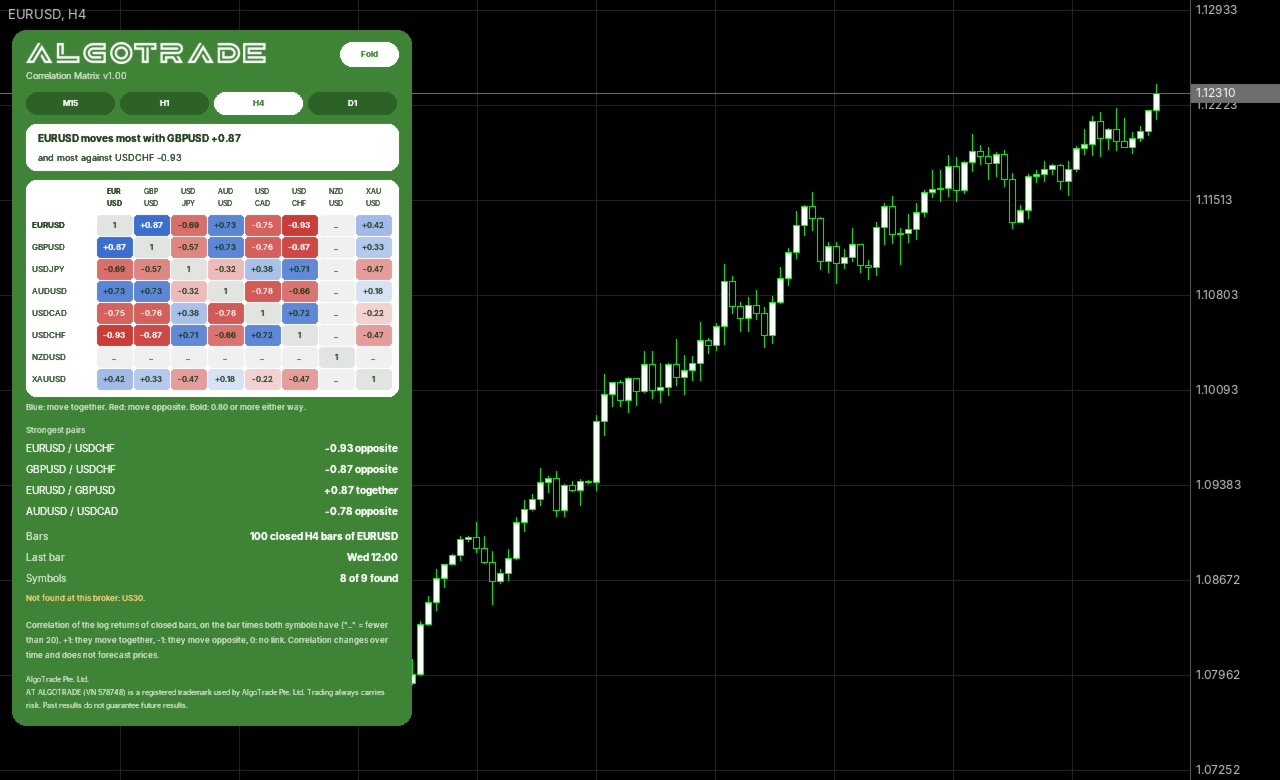
- Tabs for M15, H1, H4 and D1. The correlation uses the last closed bars of the chart symbol (100 by default) and the same time window for every symbol.
- Each cell is the correlation of the two symbols' bar-to-bar returns, from -1 to +1. Blue cells move together, red cells move opposite, and strong values are in bold (0.80 or more by default).
- Shows the symbol that moves most with the chart symbol and the one that moves most against it, and the 4 strongest pairs.
- Lists symbols not found at your broker and symbols without bars yet.
How to use
- Attach the indicator to any chart. Set the list of symbols, the bars used and the strong level in the inputs.
- Click a tab to change the timeframe. Click "Fold" to show a single line, or "Show" to display the full card. The card corner can be changed in the inputs.
- Correlation changes over time and does not forecast prices.
Inputs: symbols, add the chart symbol, add symbols to Market Watch, timeframe shown first, bars, strong level, card corner.
Please read
- This indicator reads data only and does not open, modify, or close trades.
- For questions or feature requests, please post in the comments section on this page. Your reviews help us plan updates.
Made by AlgoTrade Pte. Ltd. Trading always carries risk. Past results do not guarantee future results.