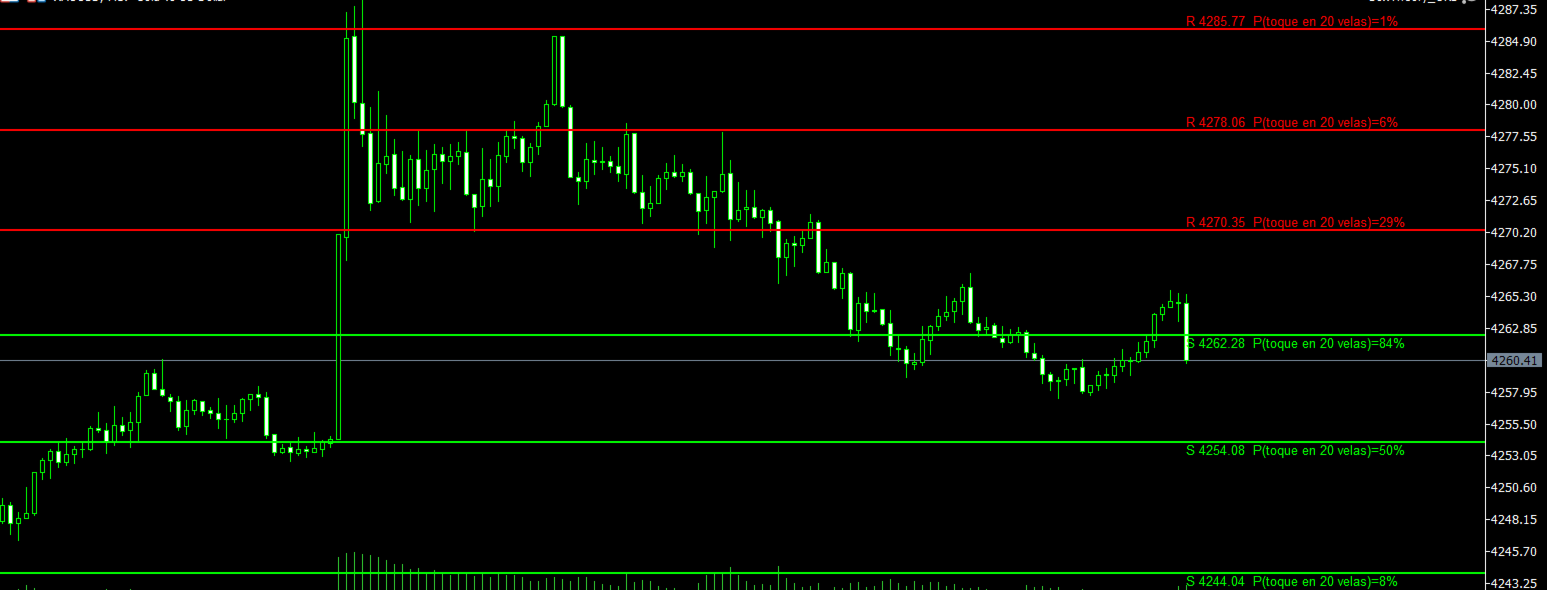
ShortTermSRTouchProbability
- Indicatori
-
Ciceu Gherman
 Hello everyone, traders.
My name is Dennis Gherman. I'm passionate about trading and algorithmic robot development, and I've been in the industry for over 5 years, trading both with prop firms and my own capital. - Versione: 1.0
Short-Term S/R + Touch Probability is an indicator (it never trades, it only draws) that automatically detects short-term support and resistance levels and, next to each one, shows an estimated probability that price will reach it — calculated with a real statistical formula, not an invented number.
How it detects levels:
The indicator identifies confirmed swing highs and lows: a pivot is validated once it has a configurable number of older and newer candles, all lower (for a resistance) or higher (for a support) than it. Only fully CLOSED candles are ever evaluated — never the one currently forming — so the indicator does not repaint: confirmation always arrives with the same delay as any honest pivot indicator. Levels close to each other are merged automatically to avoid cluttering the chart, the maximum number of active levels per side is capped, and once price closes beyond a level, it is removed from the chart instead of staying as visual noise.
On the touch probability - transparent methodology:
Price is modeled as a driftless random walk, whose volatility is estimated from the ATR of the last few days (3 by default, on daily candles, regardless of the chart's own timeframe). That volatility is scaled to the chosen horizon (in candles of the chart's CURRENT timeframe, so the result automatically changes with whatever timeframe you're using) via the square-root-of-time rule, standard in volatility statistics. The probability that price TOUCHES (not just ends beyond) a level is calculated using the reflection principle of Brownian motion - the same mathematical result used in barrier-option pricing, not a calculation invented for this product.
Honest limitations (read before relying on the number):
- The formula assumes there is no trend. In a market with a clear direction, the real probability of touching a level in the trend's favor is higher than the formula shows, and lower against it.
- ATR is a practical volatility proxy, widely used across the industry, but it is not mathematically identical to the standard deviation the formula strictly assumes.
- The probability is an estimate meant to support your own judgment, not a mathematical certainty about what the market will do.
Configurable parameters:
- Candles required on each side to confirm a pivot
- Merge threshold between nearby levels, and the maximum number of active levels per side
- ATR period (in days) and projection horizon (in candles of the current timeframe)
- Colors, line width, and toggling the price/probability labels on or off
This product works on any symbol and any timeframe - there is nothing tailored to a specific instrument, it is pure price action and volatility statistics.