 MetaTrader 5
 Experts
 Indicatori
 librerie
 Utilità
 Widget
 Regole
Guarda i video tutorial del Market su YouTube
Come acquistare un Robot di Trading o un indicatore
Esegui il tuo EA
hosting virtuale
hosting virtuale
Prova un indicatore/robot di trading prima di acquistarlo
Vuoi guadagnare nel Market?
Come presentare un prodotto per venderlo con successo
Expert Advisors e Indicatori per MetaTrader 5 - 393
 Usa i robot di trading e gli indicatori per rendere il trading sul Forex più redditizio. I robot di trading ti permettono di automatizzare l'apertura e la chiusura delle transazioni, e gli indicatori ti aiutano a prevedere con maggior precisione il comportamento del mercato. La pagina contiene il catalogo delle applicazioni MetaTrader 5.

This EA allows you to manage support and resistance zones on MetaTrader 5…but not only: To your buying and selling zones (you can configure 2 sellings zones and 2 buyings zones),
you can add 3 options (2 with multiframes) to enter a position:
Option 1: this is the option that enters a position without a signal: as soon as the price reaches the zone, the robot sends a trade.
Option 2: here the robot will wait for a break in the selected timeframe. Example: you put your zones on an H4 graph (fo
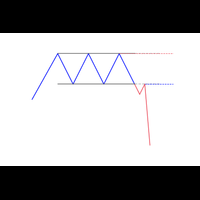
A new box will be added, if the closing price is higher than the maximum (lower than the minimum) of the current box series no less than for the specified value. Reversal will be made, if the closing price is higher (lower) than the last box on a value no less than the specified.
T his is a trend indicator and it can be used as an alternative for the trend definition instruments which use averaging.
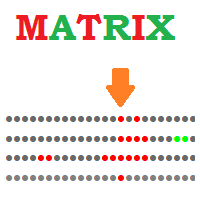
Matrix Indicator Matrix Indicator is a simple but effective indicator.
Matrix indicator displays usual oscillators indicators in a user friendly color coded indicator.
This makes it easy to identify when all indicators are aligned and spot high probability entries.
Inputs of indicator are:
Indicator: RSI, Stochastic, CCI, Bollinger Bands Param1/Param2/Param3: usual settings for the indicator ValueMin: Oversold level for oscillator ValueMax: Overbought level for oscillator The indicator can
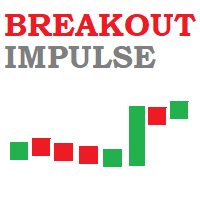
Breakout Impulse Indicator Breakout Impulse Indicator is a pattern recognition indicator for Forex, Stocks, Indices, Futures, Commodities and Cryptos.
The Breakout Impulse is a multi-bar pattern.
The purpose of the pattern is to identify a fast change in momentum.
This type of change can announce the start of a big directional move.
Inputs of the indicator are:
Distance : distance in pixel relative to top or bottom of candle to display the arrow symbol MaxBars : number of bars back used to
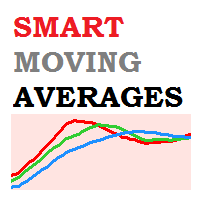
Smart Moving Averages Indicator Smart Moving Averages is an exclusive indicator for Metatrader platform.
Instead of calculating moving averages for the selected chart time frame, the Smart Moving Averages indicator gives you the opportunity to calculate moving averages independently from the chart time frame.
For instance you can display a 200 days moving average in a H1 chart.
Inputs of the indicator are:
Timeframe : timeframe to be used for the calculation of the moving average Period : m
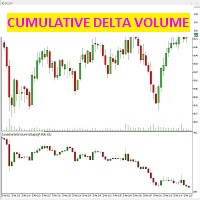
questo indicatore rileva la differenza tra i contratti battuti in bid e in ask (aggression) per ogni singola candela.
l'indicatore mostra nella finetra dedicata sotto al grafico dei prezzi, delle candele date appunto dalla differenza tra i contratti venduti ed acquistati, che generano appunto la forza volumetrica del mercato.
è possibile (vedere dagli screenshot) come selezionare solo il grafico delta cumulativo a candele, oppure anche ccon una trendline delle candele stesse: selezionando la
Automatic trend lines. Type 1. With two extremums. 1) From the current bar "go" to the left and look for the first (right) extremum point with the InpRightExmSide bars on both sides. 2) From the first point again "go" to the left and look for the second (left) extremum point with the InpLeftExmSide bars on both sides.

Traders Toolbox Overwatch - è un'utilità di monitoraggio per tutte le istanze in esecuzione di Traders Toolbox.
È una semplice utilità di cambio grafico e un orologio di mercato per tutti i grafici di trading Traders Toolbox .
Caratteristiche:
1. Colori pulsanti, righe e colonne personalizzabili.
2. Tre tipi di segnale (Hold - Yellow / Sell - Red / Buy - Green)
3. Aggiorna dinamicamente l'elenco dei pulsanti in base alle istanze nuove o chiuse di Traders Toolbox
4. I pulsanti a clic

Leggi la direzione del trend direttamente sul grafico KT Trend Magic combina momentum e volatilità in una linea colorata che segue il prezzo. La linea offre una vista continua dello stato attivo del trend e cambia colore quando cambia la direzione calcolata. Linea verde: mostra uno stato di trend rialzista. Linea rossa: mostra uno stato di trend ribassista. Cambio di colore: segna una nuova transizione direzionale sul grafico. Durante un movimento sostenuto, la linea può anche servire come rifer

LT Easy Trend - La forza della confluenza in un unico indicatore Ti sei mai sentito confuso nel vedere un indicatore che segnala un acquisto mentre un altro, contemporaneamente, indica una vendita? Il LT Easy Trend è stato sviluppato per eliminare questa indecisione, fornendo segnali ad alta probabilità basati sul consenso matematico di 9 tra i più stimati indicatori tecnici al mondo. Invece di sovraccaricare il tuo grafico con decine di finestre, l'Easy Trend elabora tutto in tempo reale e most
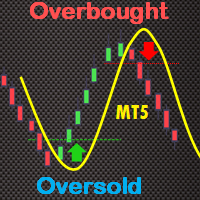
The True Oversold Overbought indicator provides you with ability to swiftly check whether the asset is oversold or overbought. Other than complementing your trading with True Oversold Overbought, you can use the indicator as your only trading system. It works with all forex instruments and will save you the headache of estimating when the market is due for a reversal or retracement. When the "Super Charge" feature is enabled, the areas where the price is in oversold/overbought status are ampli

[ MT4 Version ] [ EA ] Advanced Bollinger Bands RSI MT5 Advanced Bollinger Bands RSI is an Indicator based on the functionalities of the Advanced Bollinger Bands RSI EA . The scope of this indicator is to provide a more affordable solution for users interested in the alerts coming out of the strategy but not in Autotrading. This strategy uses the Bollinger Bands indicator in combination with the RSI, the signal triggers only when both the BB and the RSI indicate at the same time overbought or ov

It is a strategy throughout the history of trading. This since it uses a divergence between the RSI and the price. Many traders use this. The backtest is done in 4 hours, but it can work in other timeframes. It is a risk-benefit ratio of 2:1 since the stop loss is 50 pips and the target to be reached is 100 pips. All these values can be modified at the discretion of the trader. PARAMETERS: LotSize: Its use is recommended at 0.1 for accounts that operate full lots and 1 for accounts that operat

This indicator shows your daily profit for each chart. Please let me know in the comment section or via the MQL5 chat if you want find any problem, or if you want any specific features for this indicator. How to use:
Attach the indicator to the chart you want to see your profit. You can change the color of the indicators. (Currently positive figures are green, and negative are red) You can display the profit for pair it is attached, or for the whole account (all the pairs)

This EA is there to take your trade closing stress away. Quickly close as many trades as you have opened at the click of a button, INCLUDING PENDING ORDERS. This works on the MT5 platform whether it be currencies, Indices, stocks or Deriv synthetic indices. I have saved it under utilities as it is a utility, however, to install this, you have to save the file in you "EA" folder. That is; Go to "File", then "Open Data Folder", "MQL5" and then "Experts". Paste this file there. Restart MT5 and you'

TREND CRUSHER
DEFAULT SETTING - ATTACH TO H4 TIMEFRAME
These are the BEST SYMBOLS TESTED: CADCHF,CADJPY,CHFJPY,EURAUD,USDJPY,EURNZD AUDNZD,USDCAD,GBPCAD,AUDCAD,GBPNZD,GBPAUD
Trend Crusher has a dynamic entry and a dynamic grid system. It is dynamic to avoid opening grids when you do not need them. Why open a grid in normal market conditions? The EA will detect high volatility and only open a grid at a distance that matches the volatility. You can trade against the Trend or Follow the Trend. M
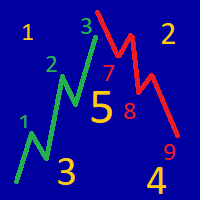
The indicator determines the strength of the trend and its possible reversal points, based on the author's arithmetic approach .
Each new peak or trough is a trend development. Such peaks and troughs are numbered so that the strength of the trend development can be seen. Attempts to change the trend are also numbered. This gives an understanding of a possible change in the direction of the trend. Indicator signals are generated when trying to change the trend .
In the settings, it is p
Mean Volume Most indicators are based on price analysis.
This indicator is based on volume. Volume is overlooked piece of information in most trading systems.
And this is a big mistake since volume gives important information about market participants.
Mean Volume is an indicator that can be used to spot when volume is above average.
It usually means that institutional traders are active.
Peak in volume can be used to confirm an entry since increased volume can sustain the move in one or anot

This trade copy utility allows you to instantly and seamlessly replicate and synchronize unlimited orders from multiple master accounts to multiple slave accounts on your local machine. You can create custom channels (or portfolios) with advanced filtering capabilities to copy from multiple master accounts to multiple slave accounts. Moreover, you can tailor these channels with a range of lot sizing and trade condition options to ensure that copied trades outperform the original source. You can

Painel informativo para day trade. Funciona em conta NETTING ou conta HEDGE. Tem a possibilidade de separar as infomrações dos trades conforme o número mágico de cada EA. Foi desenhado para melhor funcionamento no mercado futuro da B3. Durante as operações, o painel faz a plotagem das linhas de preço, stoploss e takeprofit (gain). Possui informações de volume, preço médio, lucro e stops. Mostra o histórico de ganhos diário, semanal, mensal e anual.

Engulfing Bar IndicatorEngulfing Bar indicator is a pattern recognition indicator for Forex, Stocks, Indices, Futures, Commodities and Cryptos.
The Engulfing Bar indicator is an enhanced pattern of the popular Engulfing Bar to keep only the best patterns produced in the market.
The strategy that comes with the Engulfing Bar is based on price action.
Inputs of the indicator are:
Distance: distance in pixels relative to top or bottom of candle to display the arrow symbol UseAlerts (true/false
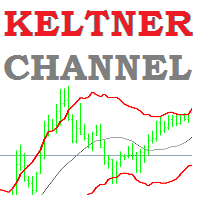
Keltner Channel Indicator Keltner Channel is an oscillator like Bollinger Bands.
Keltner Channel is a very good tool to time entries for your strategy.
Keltner Channel displays a channel where price is supposed to stay unless we are in overbought or oversold situations.
Various strategies use Keltner Channel indicator successfully to spot overbought / oversold situations and look for reversals.
Keltner Channel indicator uses ATR to determine overbought and oversold situations. Inputs of the indi

Utilità per copiare le transazioni da un conto MT5 o MT4 a un altro conto MT5. Demo-version can be downloaded here .
È possibile copiare le posizioni tra conti Netting e Hedging in qualsiasi combinazione. È possibile impostare i filtri in base al nome dello strumento e ai numeri magici delle posizioni da copiare. Finora, la fonte invia informazioni solo sulle posizioni di mercato. Gli ordini in sospeso vengono elaborati al momento della loro trasformazione in posizioni di mercato aperte.
Su
Normalized Volume99% of indicators are based on price analysis.
This indicator is based on volume. Volume is overlooked piece of information in most trading systems.
And this is a big mistake since volume gives important information about market participants.
Normalized Volume is an indicator that can be used to confirm reversal points.
The indicator code volume with colors indicating high, normal and low volume.
You could enhance dramatically your trading system using volume analysis.
Inputs
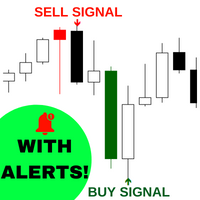
This system is good at identifying short term reversals in the market. It is based on a machine learning study on market structure, and can be a great tool to scan the market or direct trades. With everything, there isn't a 100% win-rate, but this indicator is sometimes always accurate. When it thinks a reversal will happen, it will color the candle a specific color, draw an arrow and then alert you on whether to buy or sell the upcoming candle. Simple Setup Drag and drop onto any chart, at

Fisher Kuskus Indicator Fisher Kuskus is an indicator used by scalpers on low time frames like M1.
The Fisher Kuskus is now available for Metatrader platform.
Inputs of the indicator are:
Period : period to be used for calculation of the indicator PriceSmoothing : value of 0.0 to 0.99 IndexSmoothing : value of 0.0 to 0.99 The indicator can be used with any time frame.
It can be used with any class of assets: Forex, Stocks, Indices, Futures, Commodities and Cryptos. Other indicators for MT4:

Elasticity - it is a Secure Automated Software for trade Forex market and indices.
This EA modifies the distances depending on the market situation, being able to shorten or increase the distances depending on how the algorithm reads the market.
The system operates market breaks. Looking for the market point of greater efficiency ris/ benefit , to minimize the risks of margin call. The system uses two different algorithms, one to follow the trend and the other to operate market pullbacks. D

Inside Bar IndicatorInside Bar is a very popular candlestick pattern.
Inside Bar indicator can be used to trade Forex, Stocks, Indices, Futures, Commodities and Cryptos.
The Inside Bar indicator will search for inside bar candles pattern in the chart and will generate display them.
The indicator is also able to generate alerts in your screen or sent to your phone.
Inputs of the indicator are:
Symbol: type of char symbol to be displayed in the chart to show Inside Bar patterns CustomCode: char c

JUST EURUSD M5 !!
That´s it! Just attach this EA to EURUSD M5 Chart and let it trade yourself. Based on a particular strategy, this EA follow trends and trades according to it. You can configure some parameters, such as lot size, magic number, spread, number of opened orders, takeprofit, stoploss, trigger filter, trade out system and a calendar trade filter. Takeprofit and Stoploss can be fixed in points (10 x pips). Please PM if you have some doubt.
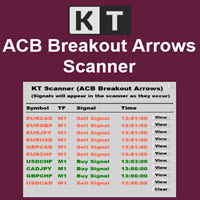
Questo è uno scanner multi-simbolo e multi-timeframe per il nostro indicatore ACB Breakout Arrows . Con le impostazioni predefinite, analizza i segnali di acquisto/vendita su 28 coppie di valute e 9 timeframe contemporaneamente .
Caratteristiche
Può analizzare 252* combinazioni di simboli e timeframe da un singolo grafico. Apre il grafico del segnale con un modello predefinito con un solo clic. Facile da spostare ovunque sul grafico tramite drag and drop. Avvisi in tempo reale tramite popup,

The utility is designed to save funds on your trading account. There is support for three levels of minimum equity and free margin. For each level, you can set partial (by a certain percentage) or complete closing of all market orders. The partial close percentage is applied for each order separately based on its current size (i.e. the size at the time the equity or free margin reaches the appropriate level). Upon reaching the last third level, the utility can close all charts, which will make i

· Bandas Bollinger & RSI En este producto se utiliza una estrategia de trading con uno de los indicadores comúnmente utilizados en el mercado, esto en conjunto con una sólida experiencia del mercado en la que se observa el posible cambio de tendencia debido al toque de las bandas bollinger. A su vez tiene que fijarse en el indicador RSI. Por otro lado, el Take Profit así como el Stop Loss no tendrán que posicionarse ya que el algoritmo viene diseñado para que el Take Profit se fije en

Element is a Forex arrow indicator that implements a kind of technical analysis based on the idea that the market is cyclical in nature. Follows the market trend with good reliability, ignoring sharp market fluctuations and noise around the average price. Thus, all intersection points will be optimal points at which the movement changes taking into account the indicator period. It catches the trend and shows favorable moments of entering the market with arrows. Displays signals simply and clear

50% off. Original price: $60 Triangle Finder is a multi symbol multi timeframe dashboard that finds symmetrical triangle pattern in 28 symbols and 9 timeframes with a deep scan feature to scan all market watch symbols (up to 1000 instruments!).
Download Demo here (Scans only M1, M5 and M10) Settings description here MT4 version here
Triangle Finder features: Realtime monitoring of 28 customizable instruments and 9 timeframes at the same time. Deep scan mode to scan all market watch symbo

The Signal Sunrise channel indicator automatically builds a trend movement support channel. The price is in its trend movement in a certain range, and not a chaotic spread of the price is unclear in which direction. And if the price deviates within a certain range, then this means that the boundaries of these ranges are support and resistance lines and form a channel.
It is no secret that the wave theory, like many others, is based on observations, however, one of the most important patterns i

Fixation of the Result is a trend indicator, a technical analysis tool that helps determine the exact direction of a trend: either an up or down price movement for a trading pair of currencies. This indicator, although a little late, is still the most reliable signal that a trader can safely focus on. Determining the market trend is an important task for traders.
The indicator is used in the forex markets. One of the main definitions for monitoring the currency market is a trend, which is why

Passage Victorious is a handy tool, and even if you are used to trading on a clean chart, sometimes you need to take a look at this indicator. If you are not sure how to determine the trend inflection point and are concerned about how to draw trend lines then this indicator is for you. From now on, you do not need to sit near the computer and analyze the price, just use this indicator.
The indicator calculates saturation levels of the price chart. A signal to exit the oversold area is a buy si
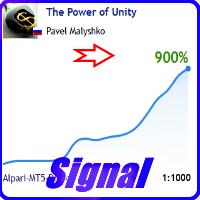
Price 175 set for limited time then price 599
I differ from many developers in that I continue. improve your products. The main goal is to make such products that users will be satisfied with. You can always write to me and I will try to help, because I appreciate every client.
Without regular updates, the Expert Advisor will work much worse. therefore, if someone tries to sell activation to you, your benefit is very doubtful.
The MT4 and MT5 versions will have different results due to

L'indicatore "JAC Trend Color Candle" per Meta Trader 5, è stato creato per facilitare visivamente il trend per il trader. Si basa su tre parametri, che identificano il mercato rialzista, ribassista e non-trend. I colori sono configurabili dal trader e anche il trader medio configurabile. i parametri di trend non possono essere configurati in quanto sono differenziali dell'indicatore.

1. What is this This is a tool used to display the balance curve in real time. The historical orders of the MT5 software are only tabular, and it looks troublesome when you have a lot of orders. This program can draw your historical trading orders in the form of a capital curve graph. This way you can see at a glance how well you are trading and where you are going wrong. At the same time, although the MT5 strategy backtest has a capital curve, it does not match the price one by one. So it is v
The indicator, Support and Resistance Detect Signal automatically detects support and resistance levels and trend lines, emitting a signal whenever the condition is met, as configured.
It reads support and resistance drawn manually or automatically built into the chart by other external indicators.
Note: Support and Resistance Detect Signal is compatible with almost all external indicators that draw on the chart, support and resistance levels, in addition to trend lines.
Discover our
The indicator, Support and Resistance Detect Signal automatically detects support and resistance levels and trend lines, emitting a signal whenever the condition is met, as configured.
It reads support and resistance drawn manually or automatically built into the chart by other external indicators.
Note: Support and Resistance Detect Signal is compatible with almost all external indicators that draw on the chart, support and resistance levels, in addition to trend lines.
Discover our Elite v
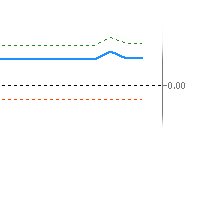
An imbalance indicator that marks imbalance on the chart with zones and gives the amount of imbalance as an oscillator value. There's one line for the amount of short imbalance, one line for the long imbalance and the combined imbalance as a thicker line. The combined imbalance goes above 0 if there's more imbalance above than below the current price and vice versa. The blue thicker line, shows (imblance above - imbalance below). The greeen dotted line shows imbalance above The red dotted line s
This is Boleta Long & Short NT-HDG, an Expert Advisor created with the function that will make operations carried out in Long & Short much easier.
> With just one click it is possible to mount a position in two assets simultaneously, further accelerating your actions right after the decision has been made.
> With it, it is also possible to operate in Hedge accounts, being able to set up positions in the same asset, for those who have strategies for this purpose.
> Can be used in multiple mar

Advanced Hedging Strategy with Intelligent Lot Management LL Gold Miner EA is a professional Expert Advisor designed for MT5 hedging accounts.
It combines simultaneous buy/sell positioning with controlled lot progression and customizable risk management. Built originally for XAUUSD, it can also operate on other symbols such as EURUSD. Core Strategy Logic • Opens BUY and SELL positions simultaneously
• Independent profit target per direction (in account currency)
• When one side reaches targe
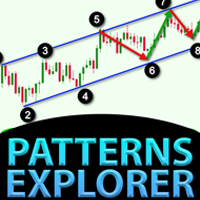
Esplora modelli per modelli a triangolo come triangolo simmetrico, triangolo asimmetrico o triangolo ad angolo retto, modello a cuneo come cuneo ascendente o cuneo discendente, modello di espansione e canale di tendenza
Questo indicatore esplora il modello storico così come i modelli attuali, è il miglior indicatore per coloro che stanno cercando di risparmiare tempo disegnando manualmente una linea di tendenza o un triangolo e vogliono usarlo per l'analisi automatizzata del tracciamento dei m

Reservoir is a reversal indicator and is part of a special category of instruments. The indicator not only analyzes the price movement, but also indicates the points of possible reversals. This contributes to the quick and optimal opening of buy or sell orders (depending on the current situation). In this case, the historical data of the analyzed asset is necessarily taken into account. It is the correct implementation of such actions that in many ways helps traders make the right decision in t

T Trader Expert #advisor
works very well on all Pairs and all Frames. Is fully automated and based on the tick to filter as many as possible winning trades. ===============================================================================================
This Robot is fully automated and has been created for everyone. The Robot works also on cent accounts. =============================================================================================== => On the lower Frames there are too many sma

Promo Offer - Premium Product Low Risk Settings:
0.2 lot and 10k account. Please use the default settings to test the EA on MT5 platform with lot size and deposit balance as mentioned above. Live Signal: https://www.mql5.com/en/signals/1434687 Symbol: NAS100 USTEC US100 Nasdaq 100 Timeframe: 30M Use Swap-free ECN This expert advisor is for NAS100 indices, opens only long positions for safely. Hundreds of hours of work went into this EA from development to quality back-testing on MT5
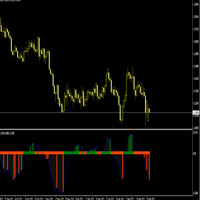
The Slope indicator measures the slope of a linear regression , which is the line of best fit for a data series. A 20-period Slope, therefore, measures the slope of a 20-day linear regression. ... In general, a positive slope indicates an uptrend, while a negative slope indicates a downtrend. How do you use slope Indicator?
By applying the slope indicator to both the price chart and the price relative , chartists can quantify the price trend and relative performance with one indicator. A pos
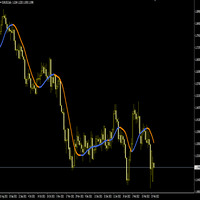
The Hull Moving Average (HMA) attempts to minimize the lag of a traditional moving average while retaining the smoothness of the moving average line. Developed by Alan Hull in 2005, this indicator makes use of weighted moving averages to prioritize more recent values and greatly reduce lag. The resulting average is more responsive and well-suited for identifying entry points. For more information, welcome to our Telegram Group. https://t.me/InfinXx
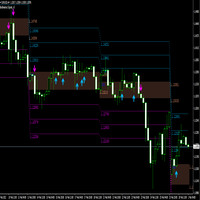
A breakout refers to when the price of an asset moves above a resistance area, or moves below a support area . Breakouts indicate the potential for the price to start trending in the breakout direction. For example, a breakout to the upside from a chart pattern could indicate the price will start trending higher. The indicator works with arrows in case of breakthrough, you also have a level of 1 tp, a level of 2 tp, a level of 3 tp. For more information, welcome to our Telegram Group. https:

EquityProtect provides hidden StopLoss, TakeProfit or TrailingStop based on the account equity. All orders of all symbols can be closed or just the chosen currency and/or just buys or sells or pending orders deleted. EquityProtect closes all or just defined orders when the account equity falls under or rises over a certain level. Besides EquityProtect can use the account equity as trailing stop. A comment in the chart shows the equity where the robot will react. An Alert can be activated and ope

NSA is designed to operate in the night market when the volume is low and everything tends to offset the movements, the basic idea is Newton's third law, thought that every action will have a reaction. The system detects the action and operates the reaction. Main strategy is using mean reversion on end of US season. Following the logic of Sir Newton, the magnitude of the action will be proportional to the reaction, that is, the greater the action, the greater the profit of our system. NSA is a f
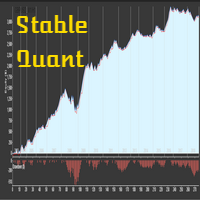
PER XAU/USD
Questo è un sistema di trading stabile che utilizza generazioni casuali e trend following trading. L'esperto è stato testato a posteriori con dati di qualità, ha completato un periodo di ottimizzazione insieme alla simulazione Monte Carlo per evitare l'overfit su intervalli di tempo XAU/USD di 1 ora. Vengono utilizzati Stop Loss e Take Profit. L'EA ha più configurazioni e non c'è nient'altro da fare se non capire quanti lotti scambiare.
Caratteristica:
Utilizza la percentuale d
The Market Reversal Catcher indicator looks for market reversal points or major pullback. To do this, it analyzes previous price movements and using a flexible algorithm for estimating the probability of a reversal, also gives recommendations on entry points and sets recommended profit targets for positions opened on a signal. Market Reversal Cather User Guide - Read Version for MetaTrader 4 - here The indicator is very easy to use and does not require a lot of information to understand how it

The indicator, Big Candle Detect , is based on ATR and Volume to detect candlesticks of buying and selling strength, which is represented through an oscillator indicator. With this indicator you will be able to identify the lateral market, providing better entries according to your strategy.
Big Candle Detect highlights candles with brighter colors when the condition is found, making it easier to identify, in addition to being fully compatible for automation in your EA.
SETTINGS
ATR Period

This is a product that carries a strategy that is used on certain YouTube channels. By studying it and understanding its mechanics, it was possible to carry out this EA based on the initial parameters of the strategy. The accommodation of the average movements in different periods is used. These in turn accommodate, the past candles at the beginning of the operation must have a certain accommodation for them to generate a sniper entry.
The take profit will be positioned twice as large as the s

Questo è facilmente l'indicatore più trascurato che ti dà la maggior parte delle informazioni sull'azione dei prezzi. È l'unico indicatore che uso io stesso.
Questo indicatore ti fornisce informazioni su quanto si muoverà il prezzo oggi e in quale direzione più probabile.
ADR sta per intervallo medio giornaliero. Se fai trading o scalping intraday, devi conoscere la gamma di quanto si muoverà il prezzo.
Diciamo che il prezzo si è spostato della metà di quanto è normale per la giornata, ed è
Questo Expert Advisor trova la direzione dell'andamento della coppia di valute su un determinato numero di barre, dopodiché determina il momento della correzione. Se il trend è abbastanza forte e la correzione diventa uguale a quella specificata nei parametri, l'EA opera nella direzione del trend (ma solo se letture dell'indicatore aggiuntive confermano l'apertura di un trade). Poiché questo EA funziona sulle correzioni, non acquisterà al massimo né venderà al minimo del trend. Ha molte imposta
O indicador mostra as principais regiões de compradores e vendedores. Onde há defesa e agressão dos players do mercado, possíveis locais de STOPS. Regiões em vermelho com Setas para baixo indicando onde houve vendedores atuando no mercado. Regiões em verde com Setas para cima indicam onde houve compradores atuando no mercado. Indicador mostra locais interessantes para operar, onde o Stop é mais barato.
Indicator Constant TF Moving Average basically is the same Moving Average indicator, but differently it always shows the price values of chosen time frame. Also, number of periods to show can be selected. Indicators purpose is to use it as support and resistance level in smaller time frames than selected in Input menu. How it looks like you can see in screenshots and video. ---------Main settings-------- Timeframe - choose time frame from dropdown menu Number of periods to show - enter the integ

Questo indicatore della zona di domanda e offerta disegna le zone sul grafico e invia avvisi quando il prezzo ha raggiunto o rotto una zona. È anche possibile utilizzarlo per essere avvisati di doppi cime/basse regolari invece che di zone. È possibile utilizzare filtri RSI, volume e divergenza per filtrare solo le configurazioni più potenti. Combinato con le tue regole e tecniche, questo indicatore ti consentirà di creare (o migliorare) il tuo potente sistema. Questo indicatore è per il trader p

Holiday Sales Zones Indicator The Zones Indicator is your everyday Trading tool that leverages advanced algorithms, including ICT institutional concepts like order blocks , engulfing candle patterns , and Level interactions , to identify critical levels of supply and demand (Resistance & Support). Visual signals are generated and clearly marked on the chart, providing a straightforward guide for traders to spot key opportunities.
Key Features Advanced Algorithmic Analysis : Identifies supply

TrendHunt is an indicator focus on higher timeframe (H1 and Above) It using breakout strategy, plus MA for filter. Check for Support, Resistance and News before every entry to increase the success rate.
Parameters Moving Average Period - 200 Moving Average Price - Closed Price Entry Period - 20 (Breakthrough 20 High for Long, 20 Low for short) Stop Period - 10 (cross over 10 low for exit long)

L'Hyper Bot è un EA di trend trading per EUR/USD nell'intervallo di tempo di 1 ora.
Importante: il file set deve essere caricato prima dell'uso e si trova nella sezione commenti
L'EA utilizza 2 indicatori direzionali e negozia in base alle inversioni cercando di catturare grandi mosse. Guarda gli screenshot per determinare come potrebbe funzionare nel backtest e in tempo reale. Al test finale, l'EA ha ottenuto un sorprendente rendimento del 150% in un mese. Tutti gli screenshot sono ottimizza

Eu tentei muitas coisas na negociação forex no passado e aprendi muito nos últimos 3,5 anos. Tentei varias ferramentas para negociação manual e nao tive muito sucesso. Sempre fui fascinado com o mercado forex, . A integração dos dados de volume é uma característica única e aumenta muito a qualidade das decisões comerciais do Expert Advisor. E sim, você tem que lembrar que os resultados do backtest não são os mesmos que resultados ao vivo. Mas aqui eles estão muito próximos. agora o único Exp

Al-Bankini Expert Advisor is a trend trader with a very simple strategy common indicators.
It will trade quite a lot. Make sure you know what you`re doing or ask for help. Dont overload your account.
The system was not optimized and has adjustable indicator settings as its universally adaptable.
Be aware, that its recomended to run multiple pairs on the same account for more profit. Not to many. No correlating ones.
Our Goal is to help you be way more profitable and way more stress free, so yo

The indicator draws lines (with line objects) to the close prices of the last closed bars, on selected timeframes. Parameters
Close line 1 close price timeframe - timeframe of the 1st close price Close line 1 color - color of the 1st close price Close line 1 width - width of the 1st close price Close line 1 style - style of the 1st close price Close line 1 max count - the maximum number of lines plotted for the 1st close price, considering the selected timeframe in Close line 1 timeframe paramet
機能&特徴: ZigZagをもとに主要なレジスタンスとサポートラインを引きます。 各時間足で押し安値、戻り高値を簡単に把握できます。 現在何波目なのか簡単に把握できます。
※ トレンド転換時はカウンターは1、継続時は2,3,4..となります。
※ちなみにこちらはZigZagの谷山を数えています。エリオット波動数ではありません。
現在買い目線でいるべきなのか売り目線なのか簡把握できます。 過去2つのZigZagラインで静的にフィボナッチを引きます。 今の値動きで動的にフィボナッチを引きます。 逆フィボナッチ(静的なフィボナッチのみ)に変更することも可能になります。 ボタンにより以下の操作が可能になります。
1.ZigZagラインの表示、非表示
2.ノーマルフィボナッチ、逆フィボナッチの切り替え ※環境により表示に時間が掛かる場合があります。
3.1分足、5分足、15分足で1つ上のZigZagラインが引けるようになりました。
4.レジスタンスとサポートラインを再描写します。 トレンド継続や変換をアラートで通知します。 エリオット3波発生の
Il MetaTrader Market offre un luogo pratico e sicuro dove acquistare applicazioni per la piattaforma MetaTrader. Scarica versioni demo gratuite di Expert Advisors e indicatori direttamente dal tuo terminale e testali nello Strategy Tester.
Prova le applicazioni in diverse modalità per monitorare le prestazioni ed effettuare pagamenti per i prodotti desiderati, utilizzando il sistema di pagamento MQL5.community.

Ti stai perdendo delle opportunità di trading:
- App di trading gratuite
- Oltre 8.000 segnali per il copy trading
- Notizie economiche per esplorare i mercati finanziari
Registrazione
Accedi
Accetti la politica del sito e le condizioni d’uso
Se non hai un account, registrati