 MetaTrader 5
 Experts
 Indicatori
 librerie
 Utilità
 Widget
 Regole
Guarda i video tutorial del Market su YouTube
Come acquistare un Robot di Trading o un indicatore
Esegui il tuo EA
hosting virtuale
hosting virtuale
Prova un indicatore/robot di trading prima di acquistarlo
Vuoi guadagnare nel Market?
Come presentare un prodotto per venderlo con successo
Indicatori tecnici per MetaTrader 5 - 204
 I segnali degli indicatori tecnici giocano un ruolo cruciale nell'apertura e nella chiusura delle transazioni sui mercati azionari e Forex. L'essenza degli indicatori è una trasformazione matematica del prezzo di un simbolo finanziario, finalizzata alla previsione dei cambiamenti futuri dei prezzi. Prova gli indicatori tecnici, per prevedere al meglio il comportamento del mercato e ricavarne dei guadagni.

Market Structure, Liquidity & Confirmed Setup Engine for MetaTrader 5 Not another arrow indicator. MultiSignal analyses market structure, liquidity, displacement and confirmation before presenting a trading setup. The indicator is designed for traders who want structured market information instead of a chart filled with isolated BUY and SELL arrows . FROM MARKET STRUCTURE TO CONFIRMED SETUP MultiSignal analyses multiple conditions and presents the resulting setup directly on the chart. Liquidit

Understudy shows which market regime you are in, and it tells you when its own machine learning is not good enough to be trusted.
Most machine learning indicators ask you to take the model on faith. This one measures itself against a fixed structural baseline on every closed bar and publishes the verdict on the chart. It will tell you, in writing, when it is losing.
HOW IT WORKS
Two forecasters run side by side.
The Principal is a fixed structural model. Its weights never change, so it stay

Candlestick Signal Pro – Advanced Japanese Candlestick Trading Indicator Candlestick Signal Pro is an advanced MetaTrader 5 indicator designed to identify high-quality trading opportunities using Japanese candlestick patterns combined with intelligent Support and Resistance analysis. Instead of displaying every candlestick pattern as a trading signal, the indicator evaluates the quality and location of each pattern and calculates a Signal Strength score from 0% to 100% . Only signals that meet t

Short Description (EN) Monitor up to 3 independently configurable Bollinger Bands across up to 6 timeframes (M1–H4) from a single chart. Receive instant sound, popup, and mobile alerts the moment price touches any upper or lower band — no more chart‑hopping or constant manual checking. Key Features (EN) 3 fully configurable Bollinger Bands (enable/disable, period, deviation) Multi‑timeframe monitoring: M1, M5, M15, M30, H1, H4 — independent of the chart’s timeframe Distinct sound alerts for upp

Apex Squeeze Breakout MT5 — Squeeze, Confirm, Breakout. Apex Squeeze Breakout MT5 is a professional MT5 breakout and trend-following indicator built to identify one of the most important market transitions: LOW VOLATILITY → SQUEEZE → BREAKOUT → TREND Instead of chasing price after a large move has already started, Apex monitors the compression of a multi-line WMA ribbon and looks for expansion with momentum and trend confirmation. When the market compresses, the ribbon turns ORANGE .

GOLDPRO MAX Advanced Multi-Timeframe and Smart Money Market Analysis for MetaTrader 5 GoldPro Max is a professional market analysis indicator for MetaTrader 5 designed to help traders study market direction, price structure, liquidity, market imbalance and potential trading areas from multiple perspectives. The indicator combines Multi-Timeframe Analysis, Smart Money Concepts, Market Structure, Liquidity Analysis, Order Blocks, Fair Value Gaps, Premium and Discount analysis, Smart Analytical Eng

Indicatore per MetaTrader 5 sull'oro: una sola freccia sulla prima candela chiusa in cui quattro timeframe puntano nella stessa direzione (M5, M15, H1 e H4).
Ogni riga del pannello riporta l'orario della candela letta, perché i timeframe superiori chiudono molto prima di quello del grafico: senza l'orario non si capisce quali candele si confrontano. Se non sono allineati, la riga Blocking indica il timeframe che blocca l'allineamento con i suoi tre numeri.
In sintesi
- Non c'è nulla da impost

TriYep Indicator PRO v1.02 – Over 70% Accurate Signals Indicador TriYep PRO v1.02 – Señales con más del 70% de precisión Presentación El indicador TriYep PRO v1.02 se creó con un único propósito: ofrecer señales totalmente fiables. Esta versión profesional funciona con cualquier par de divisas y en cualquier marco temporal , aplicando su lógica probada a todos los mercados. Mientras que otros indicadores inundan tu gráfico con señales falsas y te hacen perder operación tras operación, hemos dise

Average Day Range Short description A daily-range statistics engine that classifies the last 90 days into Bullish / Bearish / Doji bars, splits them into Big & Normal groups, and projects today's expected open→high / open→low targets and bias straight onto your chart.
Full description Average Day Range turns raw daily-bar history into an actionable intraday roadmap. Instead of guessing "where will price go today?", it measures what price actually did after the open over the last three months,

Short description (for the one-line field) Statistical day-range dashboard: classifies daily bars into Bullish, Bearish and Doji, splits each class into Big vs Normal, shows averaged wicks and open→high / open→low targets, and labels the live session BULLISH / BEARISH / DOJI / MONITORING. Works on any symbol and timeframe. Full description AverageDayRange is a statistical day-range analyzer that shows you what an "average" day really looks like on your symbol — and where the current day stands r

Gold Net Range Signals è un indicatore per MetaTrader 5, pensato per l'oro. Non si appoggia a nessun altro indicatore: legge i quattro prezzi di ogni candela chiusa e lo spread registrato su quella candela. Se, tolto il costo, resta ancora ampiezza e la candela supera le 20 candele chiuse precedenti, compare una freccia.
In sintesi
- Non si imposta niente: nessuna soglia, nessun periodo, nessun moltiplicatore. - Non ridisegna (no repaint). La freccia compare a candela chiusa e non si sposta pi

Una visione completa del mercato da un solo grafico Multi-Symbol Market Regime Radar Pro è uno scanner di mercato avanzato per MetaTrader 5 che analizza contemporaneamente più simboli e timeframe. Invece di passare continuamente da un grafico all’altro, la dashboard offre in un unico pannello ordinato una visione chiara della direzione del mercato, della forza del trend, del livello di confidenza, della volatilità e dell’allineamento dei timeframe superiori. L’indicatore non dipende da una singo

Short description (one line): KeyLevels draws a dynamic grid of key price levels around the previous daily close — a base line plus two independent step-level grids — to highlight support and resistance zones on any chart.
How it works The indicator anchors to a base price, which by default is the closing price of the previous completed daily (D1) candle. From that base it draws three sets of levels:
Level 1 — Base line: a single, clearly visible anchor line at the base price (color and thick

Comprendere dove il prezzo può cercare liquidità Liquidity Reaction Map MT5 è un indicatore di analisi del mercato applicato direttamente al grafico. Identifica potenziali aree di liquidità sul lato degli acquisti e delle vendite utilizzando una struttura di prezzo confermata. L’indicatore combina punti di swing, massimi e minimi uguali, livelli del giorno e della settimana precedente, estremi delle sessioni e prezzi tondi in una mappa della liquidità organizzata. I livelli vicini possono essere

SESSION TRADER PRO
The Institutional-Grade Session Sweep Indicator That Changes Everything
---
Traders, listen up.
You've been lied to. The market doesn't move randomly. It follows liquidity—and most retail traders are the liquidity.
I'm about to show you how to stop being the prey and start being the predator.
What if You Could See Where Smart Money Is Lurking?
Every single day, institutional traders hunt for one thing: your stop losses.
They sweep the highs and lows of Asia, London, a

Short description (marketplace listing, ~400 chars) MarketDominance visualizes intraday market control by accumulating candle bodies from the session start. Every bar is classified as Bullish, Bearish or Doji and "poured" into green/red bottles on an on-chart panel — the taller the bottle, the stronger the side's dominance. Includes doji detection with wick analysis, Big/Normal bar classification (ATR or average body), 90-day historical averages, and a color-coded dominance footer. Fully custo

This indicator maps market structure using an inside-bar/outside-bar range model, inspired by price-action structure concepts taught by trading educator mentfx (Anton). It automatically classifies each bar as either an "outside" bar (a break of both the prior high and low, indicating range expansion) or an "inside" bar (contained within the prior range, indicating consolidation), then tracks the resulting bullish or bearish range as it evolves. Once a range is established, the indicator further

Tasso di sopravvivenza del trend per MetaTrader 5: un indicatore del regime di mercato che misura quanto spesso lo stato del trend attuale è sopravvissuto alla barra successiva e assegna un punteggio alla propria previsione Tasso di sopravvivenza del trend, classificazione dello stato del mercato e punteggio di previsione Brier in tempo reale, in una finestra dell'indicatore MT5. Misura la pressione di acquisto e vendita dietro la mossa attuale, la classifica in uno stato di mercato e segnala qu
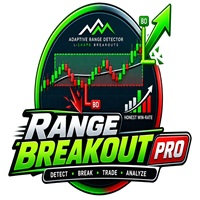
SHORT DESCRIPTION ----------------- A range-bound market detector with an adaptive 10–120 bar lookback that draws a sloped average line (midpoint / SMA / linear regression) and marks L-shaped breakouts (BO / BD) with an honest paper-trade win-rate panel. Signals are computed on closed bars only — no repainting on the forming bar.
HOW IT WORKS ------------ 1. ADAPTIVE RANGE DETECTION — scans lookback windows (default 10..120 bars) and selects the LONGEST window whose high-low width is within

Spread & News Sentinel – Market Conditions & Performance Monitor for MT5 Monitor the conditions around your trading, not just the price. Spread & News Sentinel is a MetaTrader 5 monitoring indicator designed to give traders a clear view of three important parts of their trading environment: Spread conditions, economic news and realized account performance. Instead of generating buy or sell signals, Sentinel focuses on the conditions surrounding your trades. It monitors the live spread on the att

Short description (one line) ZigZag-style swing indicator that plots swing highs/lows, leg midpoints, range labels and dynamic Small/Medium/Large target levels with a latched target-chaser line.
Full description Swing Cross is a highly customizable ZigZag-style indicator that identifies swing highs and lows, draws the connecting legs, and automatically builds dynamic target levels from your symbol's recent leg-range history.
How it works Detects local swing highs/lows using the classic ZigZag
ChartDeck PRO ChartDeck PRO è un indicatore per MetaTrader 5 che riunisce sette strumenti grafici in un unico programma e li controlla da un pannello di icone ancorabile sul grafico. Ogni strumento si attiva o si disattiva con un solo clic sulla sua icona. I parametri si modificano sul grafico in un riquadro delle impostazioni che si apre accanto al pannello, senza riaprire la finestra delle proprietà dell'indicatore. Ogni strumento mantiene il proprio timeframe, i propri parametri e le proprie

FVG Pro — ICT Fair Value Gap Signal Indicator Built for professional traders who already trade ICT concepts. This indicator is designed for traders already familiar with ICT (Inner Circle Trader) methodology and FVG (Fair Value Gap) concepts — Consequent Encroachment, mitigation, inverse gaps, and bias-based execution. It is not a beginner "buy/sell" signal box; it's a precision tool that automates the tedious part (finding, tracking, and grading FVGs in real time) so you can focus on execution

Trend Power Master: Complete Multi-Symbol Trend Analysis Dashboard Stop wasting time switching between charts and searching for confirmation signals. Trend Power Master combines classic technical analysis into one clear, structured visual matrix. The indicator calculates real-time trend direction and market power, delivering instant market overview directly on your chart interface. Key Features Multi-Indicator Power Engine : Combines calculations from 20 classic MT5 indicators (E

Overview Institutional Swing Profile is a cutting-edge technical analysis tool designed for MetaTrader 5, bringing institutional-grade Volume Profile analysis directly to individual swing structures. Instead of calculating profiles over arbitrary fixed time sessions (like daily or weekly sessions), this indicator dynamically maps volume distribution across market swings , giving you crystal-clear visibility of where true institutional liquidity, support, resistance, and acceptance lie. Whether y

Master SMC — The Actual SMC Master SMC is built for traders who want to read the market with more clarity instead of getting lost in a chart full of unnecessary information. It brings the key ideas of Smart Money Concepts (SMC) into one clean and practical indicator. Rather than simply throwing signals at you, Master SMC helps you understand why price may be moving, where important liquidity and structure exist, and how the market is behaving around key areas. At its core, Master SMC tracks both

THIAGO MT5 Trading Performance & Drawdown Dashboard for MetaTrader 5 Everything that matters about your trading account — directly on your MT5 chart. Thiago MT5 is a compact real-time dashboard for traders who want to instantly monitor their performance, exposure and drawdown without switching between MT5 windows or external spreadsheets. One indicator. One dashboard. Full visibility.
EVERYTHING AT A GLANCE ACCOUNT
Balance • Equity • Margin • Free Margin • Leverage OPEN POSITIONS
Longs • S

ZoomX è un indicatore di utilità per MetaTrader 5 che consente di regolare direttamente con il mouse la scala verticale dei prezzi del grafico. Tieni premuto il pulsante sinistro del mouse sulla scala dei prezzi e trascina verso l’alto per ingrandire o verso il basso per ridurre. Fai doppio clic sulla scala dei prezzi per ripristinare il ridimensionamento automatico del grafico. Il parametro Zoom sensitivity controlla la velocità dello zoom su una scala da 1 a 5. ZoomX modifica esclusivame

Horizontal lines on the chart alternate between solid and dashed styles, representing areas of interest based on significant highs and lows from different timeframes, creating potential confluence between market structures. The indicator is designed to assist each participant in their own market studies, giving users the flexibility to combine the indicator with their personal trading system and analysis methods . The lines should not be used as standalone entry triggers . Instead, they are inte
FREE

MyZtrade Margin Zones (NKZ)
The indicator shows on the chart the zones where major players - market makers and central banks - concentrate their activity, as well as key price levels derived from extremes.
**Zones:** - market maker / central bank percentage zones - **5%, 10%, 15%, 20%, 25%** and fine 0.5%…5%; - NKZ zones from highs and lows - 1/4, 1/2, 3/4, 100%, 200%; - ATR zones of higher timeframes (H4, D1, W1, MN).
**Features:** - automatic zone building from the latest price extremes; -

Candle Stick Timer Indicator ️ Know Your Candle. Know Your Time. Trade With Confidence. Stop guessing when the current candle will close. Candle Stick Timer Indicator gives you a clear, real-time countdown directly on your trading chart, helping you stay aware of every second of the candle’s formation. Whether you trade Forex, Gold, Crypto, Indices, or other markets , this indicator helps you monitor candle timing without constantly checking the clock. Key Features ️ Real-Time Candl

TradeXray TrendAutoLines
What it does. It draws trend lines from one fixed geometric rule, and it never moves a line after that line has been drawn.
What it does not do. It does not tell you when to buy or when to sell, and it does not claim that these lines have any statistical edge. We have not measured one, so we do not say that one exists.
What has been checked. The no-repaint behaviour is not just a sentence in this description. It is checked by an automated verification harness, and the

How it works A fresh read, every week. At the start of each trading week, PivotRadar re-anchors its zones to that week's opening structure. Nothing carries over stale from the week before — every week starts clean. Three graduated tiers, both directions. As price works deeper into a zone, PivotRadar tracks it through three escalating tiers — a shallow first warning, a stronger mid-level signal, and an extreme-zone alert. This works for both potential upside and downside reversals, tracked indep

FVG Horizon is a Fair Value Gap channel indicator for MetaTrader 5. Instead of filling the chart with extending FVG boxes, it combines active bullish and bearish imbalances into a smooth, adaptive channel. The indicator detects three-candle Fair Value Gaps, stores their relevant price levels and automatically removes them after price closes through the level. The remaining active levels are averaged and smoothed to create dynamic upper and lower channel boundaries. Three configurable Fibonacci l

Aurum Price Action AI — Gold Price Action Intelligence System Advanced Multi-Confluence Market Structure, Liquidity & Smart-Money Signal Engine for XAUUSD (and beyond) Overview Aurum Price Action AI is a professional-grade MT5 indicator built specifically to read gold (XAUUSD) the way institutional price-action traders do — through market structure, liquidity, order blocks, fair value gaps, and multi-timeframe context — and to distill all of it into one clear, non-repainting BUY / SELL / WAIT si

RSI Divergence Pulse KPG – Indicatore di Divergenza Multi-Timeframe per MT5 Descrizione Generale RSI Divergence Pulse KPG è un indicatore tecnico professionale e multifunzionale sviluppato da Billion KPG Club per MetaTrader 5. Scansiona automaticamente l'oscillatore RSI per rilevare divergenze rialziste e ribassiste utilizzando un robusto algoritmo di regressione lineare. L'indicatore visualizza frecce verdi (ACQUISTA) e rosse (VENDI) chiare direttamente sul grafico dei prezzi, insieme a line

TLM Gold Master Trading System
A Professional Gold Trading Decision & Signal System for MetaTrader 5
The TLM Gold Master Trading System is a specialized MT5 indicator designed for traders who want a structured, multi-factor approach to analyzing Gold (XAUUSD).
Instead of relying on a single indicator, the system combines trend direction, higher-timeframe confirmation, market volatility, momentum, pullback conditions, automatic support/resistance zones, and ATR-based price-space analysis into

PRICE STRUCTURE RSI Price Structure RSI is a market-structure oscillator for MetaTrader 5. Instead of calculating RSI directly from ordinary price changes, it measures the balance between confirmed bullish and bearish price-structure breaks. The indicator tracks pivot highs and pivot lows. A break above an active pivot high increases the cumulative structure value, while a break below an active pivot low decreases it. Wilder RSI smoothing is then applied to this structure data, producing an osci

Volatility Reversal Engine is a multi-layer volatility and mean-reversion indicator for MetaTrader 5. It converts changes in market volatility into a normalized 0–100 oscillator, making it easier to identify volatility expansion, contraction, exhaustion, reversal conditions and divergence. The indicator is designed for traders who want more information than a standard volatility line. It combines volatility percentile analysis, smoothing, price divergence, mean-reversion ranking, graded signals,

FVG Zones MTF This indicator detects Fair Value Gaps (FVG) and draws them as zones on your chart, from up to three timeframes at the same time - the chart timeframe plus two higher timeframes of your choice. Each timeframe set has its own colours and label, so you always know which timeframe a zone came from. Key Features Detects bullish and bearish FVG zones on the current timeframe plus two higher timeframes , all shown on one chart. Small control panel on the chart with one button per timefra

Breakout Scanner Indicator: The Ultimate 4-Candle Harami Breakout Detection System
The Market Never Sleeps—But Now Your Scanning Does
Imagine having a tireless assistant that watches every single symbol in your Market Watch, across multiple timeframes simultaneously, scanning for one of the most powerful reversal patterns in technical analysis—and delivering the results to you in a clean, actionable dashboard before you've even finished your morning coffee.
That's exactly what the Breakout S

XAUUSD Smart Trend & Signal Indicator Trade smarter. Filter the noise. Catch the move. Take your Gold trading to the next level with a professional technical indicator designed to identify high-quality BUY and SELL opportunities while filtering market noise and weak setups. Built with XAUUSD (Gold) in mind, the indicator is especially suitable for scalping and intraday trading , including fast timeframes such as M1, M5 and M15 . Key Features BUY & SELL Signals Get clear visual BUY and SELL

TradeXray TripleMA
What it does. It draws three simple moving averages, marks the places where two of them cross, and prints a few measurements of the current geometry on a small panel. Every mark and every number is taken from bars that have already closed.
What it does not do. It does not tell you when to buy or when to sell. It does not claim that these lines, these crosses or these numbers have any statistical edge. We have not measured one, so we do not say that one exists.
What has been

Caratteristiche Principali: Sfondi Multi-Timeframe (HTF): Mostra le candele del timeframe superiore (H1, H4, D1) disegnate perfettamente sullo sfondo del tuo grafico di ingresso (M1, M5, M15). Modalità Auto Intelligente: Dimentica i cambi di impostazioni! L'algoritmo rileva il tuo timeframe attuale e si adatta automaticamente al timeframe superiore ideale. Sessioni di Trading Pro: Disegna i box delle sessioni Asiatica, di Londra e di New York direttamente dietro il prezzo. Ideale per le st

SlopeBand Pro è un indicatore professionale di pendenza del trend che costruisce automaticamente un canale dinamico attorno al prezzo medio usando logica di deviazione smussata. I limiti superiore e inferiore rivelano all'istante se il mercato è in trend, in compressione o pronto ad espandersi, senza ridisegnare i segnali passati. A differenza delle Bande di Bollinger statiche, la larghezza del canale si adatta alla pendenza attuale del mercato, offrendo un chiaro vantaggio visivo per ingressi

AutoTrendline Pro rileva automaticamente i pivot di swing e disegna le linee di tendenza più valide direttamente sul tuo grafico. Le linee di resistenza appaiono tratteggiate e le linee di supporto continue, entrambe validate contro l'azione del prezzo e rimosse immediatamente in caso di rottura, esattamente come le disegnerebbe un chartist professionista. L'algoritmo basato su replay costruisce ogni linea solo con pivot confermati, quindi nulla viene ridisegnato in seguito. Puoi controllare le

Reversal Divergence Pro analizza 10 indicatori contemporaneamente: MACD, Istogramma, RSI, Stocastico, CCI, Momentum, OBV, VW-MACD, CMF e MFI. Rileva divergenze regolari e nascoste, sia rialziste che ribassiste, e assegna a ogni segnale una probabilità ponderata dal 25 al 95 per cento. Ogni segnale mostra un livello di impatto da Basso a Molto Alto e una chiara etichetta REVERSAL direttamente sul grafico, così puoi operare solo i setup più forti. La modalità ibrida senza ritardo integrata fornisc

Parallel Channels Pro costruisce un canale di regressione lineare ponderato per il volume attorno al mercato, con tre livelli paralleli per lato. Identifica fasi di trend pulite, segna gli sweep di liquidità sul livello esterno e sblocca o riblocca il canale sui pivot di swing e sulle rotture della linea centrale. Il nucleo usa la validazione della correlazione di Pearson e un rifiuto robusto degli outlier opzionale, oltre a un lookback adattivo basato sul rapporto ATR. Ogni trigger viene valuta

DS Precision RSI Trend Signals Overview DS Precision RSI Trend Signals is an RSI signal and trend-analysis indicator for MetaTrader 5 (MT5). It combines configurable RSI buy and sell signals with an adjustable primary trend filter, an internal price zone and optional closed-candle confirmation. Entry and exit signals are therefore evaluated not only on the basis of an individual RSI value, but also in the context of trend direction, price area and candle confirmation. Separate RSI ranges can be

Smart Money Structure Pro combina una nuvola RMA rapida e lenta con etichette automatiche della struttura di mercato (HH, HL, LH, LL) e canali di trend predittivi. Le candele sono colorate di lime nel momentum rialzista e di cremisi in quello ribassista, con candele di trigger ai crossover RMA filtrati dal momentum del Cloud RSI. Gli estremi di ipercomprato e ipervenduto dell'RSI sono marcati direttamente sui punti di swing. Il risultato è un dashboard completo di price action su un unico grafic

Smart Money Zones Pro è un indicatore Smart Money in stile TradingView che unisce zone automatiche di domanda e offerta, fair value gap (FVG), etichette di struttura del mercato (BoS, CHoCH, I-BoS, I-CHoCH), conversione delle zone in BOS, livelli rolling 4H e 1D con attività di volume, ombreggiatura delle sessioni di New York, Asia e Londra e box di area di interesse. Le zone sono costruite dai pivot di swing con larghezza basata sull'ATR e tutto viene disegnato direttamente sul grafico con opac

TrendPulse Signal Pro è un motore di segnali completo che rileva i cambi di trend, segna gli ingressi LONG e SHORT direttamente sul grafico e disegna automaticamente i livelli di Stop Loss, Entry e tre Take Profit per ogni segnale. Un dashboard di performance integrato mostra il win rate simulato, la distanza attuale dell'operazione e il risultato di una simulazione di gestione del rischio a 3 livelli: il livello uno chiude al TP1 con il profitto bloccato, il livello due chiude al TP2 o al blocc

VTX OMNIBOARD PRO è una workstation di analisi quantitativa di livello istituzionale progettata per MetaTrader 5. Basato su algoritmi avanzati di analisi dei trend, calcolo dell'aspettativa matematica e monitoraggio del rischio per Prop Firm, consente di analizzare il mercato e gestire il rischio da un unico pannello principale. Che tu sia uno scalper, uno swing trader o un trader di Prop Firm, VTX OMNIBOARD PRO trasforma le complesse dinamiche di mercato e le metriche del conto in informazioni

Title: Trader Nakal Institutional Clean Wave & Structure PRO Category: Indicators / Market Structure & Trend OVERVIEW Elevate your trading precision with Trader Nakal Institutional Clean Wave & Structure PRO — a comprehensive Smart Money Concepts (SMC) & Trend Matrix indicator engineered specifically for MetaTrader 5. Whether you are a Scalper, Day Trader, or Swing Trader , this all-in-one institutional toolkit filters market noise, automatically maps key structural breakouts ( BOS & CHoCH ),

Trader Nakal Basic – Smart POC & Trend Reversal System Fitur Utama Dynamic Point of Control (POC): Menghitung level harga dengan volume akumulasi tertinggi secara otomatis dari jam pembukaan pasar ( Asia/Jakarta Session ) lengkap dengan penyesuaian otomatis Season DST/Winter. EMA/SMA Trend Crossover Signal: Memberikan konfirmasi arah tren terkini melalui persilangan garis EMA 9 dan SMA 21. Automatic ATR Stop Loss & Take Profit: Secara otomatis mengkalkulasi dan menampilkan garis acuan Stop Lo

GOLD TRADERS, DO YOU SEE THIS?
this is a non-trading XAUUSD analyser Why is this important? The EA helps you see what most traders miss — traps, order blocks, FVG, and liquidity sweeps. You get institutional-grade signals without manual analysis.
Works on ANYThis is NOT a trading EA — it's an INDICATOR that detects: FVG Bull (Open) with age tracking SSL Taken (Liquidity Sweep) TRAP — Stop Hunt Low/High Fake Bear BOS Inducement of FVG Bullish BOS
It gives you bias,

️ Hari yang Cerah — Heikin Ashi Trend & Breakout Signals Hari yang Cerah adalah indikator profesional untuk MetaTrader 5 yang menggabungkan visualisasi Heikin Ashi, deteksi perubahan momentum, dan konfirmasi breakout dalam satu sistem yang dirancang untuk membantu trader membaca arah market dengan lebih jelas. Indikator ini menyediakan dua jenis signal: Aggressive Momentum Signal melalui circle dan Confirmed Signal melalui arrow. Sistem signal bekerja berdasarkan candle yang telah selesai dan m

Stochastic Quad Rotation with Volume Stochastic Quad Rotation with Volume is a multi-speed stochastic momentum indicator for MetaTrader 5 designed to show momentum rotation, extreme conditions, oscillator alignment, divergence and higher-timeframe context in one separate indicator window. Instead of relying on a single stochastic calculation, the indicator tracks four stochastic speeds together with a volume-weighted stochastic. This makes it possible to see how short-, medium- and longer-term m

Cycle Projection Pro è un indicatore di analisi ciclica per MetaTrader 5, pensato per il timeframe Daily. Individua e proietta nel tempo i cicli ricorrenti del prezzo, aiutandoti a stimare quando — non quanto — il mercato potrebbe trovarsi vicino a un punto di svolta. Come funziona L'indicatore somma sei cicli armonici a periodo esplicito — Weekly, Biweekly, Monthly, Quarterly, Semiannual, Annual — ciascuno modificabile e attivabile singolarmente. La loro combinazione genera un'onda composita c

See at a glance when volatility is speeding up before a move — and when it is fading into a dead market. Any pair, any timeframe. No repaint — signals are final on bar close. Try it free in the Strategy Tester before you buy.
THE PROBLEM Most volatility tools tell you how big the range is right now. They do not tell you the one thing that matters for timing: is volatility accelerating or slowing down? You end up entering just as a move runs out of steam, or sitting out while a breakout

StructureScope - la struttura del grafico, disegnata solo una volta confermata
COSA DISEGNA Struttura BOS e CHoCH, etichettati sul livello rotto. Order block L'ultima candela opposta prima dell'impulso che ha rotto la struttura. Ombreggiata finché non mitigata. FVG Squilibri a tre candele non ancora colmati. Quelli colmati vengono rimossi anziché restare a ingombrare. Liquidità Massimi e minimi uguali, con tolleranza in ATR. S

TrendArrow Pro - una regola di ingresso sul ritracciamento verificabile
COSA FA Una freccia compare solo se tre condizioni concordano: 1. Trend. La media del time frame superiore deve avere pendenza E l'ADX essere sopra la sua soglia. In laterale non compaiono frecce. 2. Ritracciamento. Il prezzo deve rientrare in una banda ATR attorno alla media. 3. Innesco. L'RSI esce dalla sua banda oppure l'istogramma MACD cambia segno - a sua scelta, o entrambi. Facoltativamente l'ultimo swing confe

Adjustable Fair Value Gap – Multi-Timeframe FVG Indicator for MetaTrader 5 The Adjustable Fair Value Gap indicator automatically detects and displays open Fair Value Gaps on any MetaTrader 5 chart. The indicator uses the classic three-candle FVG structure and allows the analysis timeframe to be selected independently from the current chart timeframe. For example, you can display H1 Fair Value Gaps on an M5, M15, H1, or H4 chart without changing the chart itself. Only currently open Fair Value Ga

Gold Scalper Signals – A Scalping Signal Indicator for XAUUSD Gold Scalper Signals is a tool designed to assist with gold (XAUUSD) scalping. It identifies trade entry points based on Moving Average crossover signals, displaying them directly on the chart via clear, easy-to-spot Buy/Sell arrows. Key Features: Displays two Moving Average (MA) lines (Fast/Slow) with customizable periods and calculation methods (SMA, EMA, SMMA, LWMA). Buy/Sell signal arrows appear immediately upon crossover confirma

professional indicators that answer every pre-trade question: WHEN to trade (sessions), WHEN to avoid (news), WHERE price stands (prev day + week/month closes) and WHERE the value zone is (ATR sweet spots). No repainting. Any symbol & timeframe. (Paste the whole file: RiyaVed_Intraday_Suite_Market_Description.md from this folder. It is final and ready.)
TAGS ---- sessions, news calendar, support resistance, levels, intraday, breakout, no repaint, sweet spot, ATR, forex, bundle, trading dashb

Currency Strength Correlation Dashboard
Forza in tempo reale di 8 valute, correlazione e un bias intermarket in un unico pannello Currency Strength Correlation Dashboard legge le 28 coppie principali e assegna un punteggio alla forza in tempo reale delle 8 valute principali da 0 a 100, così vedi a colpo d'occhio quale valuta guida e quale resta indietro. Aggiunge la correlazione dei tuoi simboli rispetto alla coppia che tradi, un bias intermarket da oro, indice del dollaro, un indice azionario e

1. What Is It? ---------------------------------------------------------------- TradingSession Canvas is a display-only chart indicator that marks the three main trading sessions of every day as semi-transparent colored blocks on the chart:
1. Asia session (default start 01:00) 2. Europe session (default start 10:00) 3. America session (default start 16:00)
Each session is drawn on its own canvas (CCanvas): - A semi-transparent block fills the session's time and price range;

Liquidity Pool Radar maps the price levels where stop-losses cluster, flags the moment price sweeps them and snaps back, and tells you whether that sweep landed on an abnormally wide spread. It turns liquidity theory into a clean, real-time tool you can read at a glance. Full user manual: https://www.mql5.com/en/blogs/post/774413 What makes it different Most liquidity tools stop at drawing levels. Liquidity Pool Radar adds a built-in spread lens: every sweep is checked against the instrument's o

PERFECT DAY SURE ENTRIES INDICATOR – COMPLETE TRADING OVERVIEW
The Philosophy Behind This Indicator
The Perfect Day Sure Entries indicator is not just another tool on your chart – it is a comprehensive trading decision engine built on the foundation of institutional-grade concepts. It combines multiple layers of market analysis into one cohesive dashboard that tells you when, where, and in which direction to trade with high confidence.
The Perfect Day Sure Entries integrates five powerful tr

Kito AutoTrend Pro Scanner Ultimate is a multi-symbol, multi-timeframe trendline intelligence scanner designed to turn Market Watch into a structured opportunity dashboard. Instead of opening charts one by one, the scanner continuously analyzes selected symbols and timeframes, identifies relevant trendline interactions, scores their quality and presents the strongest opportunities in one dashboard.
SPECIAL OFFER: After purchasing this scanner, send me a private message to claim your bonus indic
MetaTrader Market - i robot di trading e gli indicatori tecnici per trader sono disponibili nel tuo terminale di trading.
Il sistema di pagamento MQL5.community è disponibile per tutti gli utenti registrati sul sito MQL5.com che effettuano transazioni su MetaTrader Services. Puoi depositare e prelevare denaro usando WebMoney, PayPal o una carta di credito.

Ti stai perdendo delle opportunità di trading:
- App di trading gratuite
- Oltre 8.000 segnali per il copy trading
- Notizie economiche per esplorare i mercati finanziari
Registrazione
Accedi
Accetti la politica del sito e le condizioni d’uso
Se non hai un account, registrati