 MetaTrader 5
 Experts
 Indicatori
 librerie
 Utilità
 Widget
 Regole
Guarda i video tutorial del Market su YouTube
Come acquistare un Robot di Trading o un indicatore
Esegui il tuo EA
hosting virtuale
hosting virtuale
Prova un indicatore/robot di trading prima di acquistarlo
Vuoi guadagnare nel Market?
Come presentare un prodotto per venderlo con successo
Nuovi indicatori tecnici per MetaTrader 5 - 181
 I segnali degli indicatori tecnici giocano un ruolo cruciale nell'apertura e nella chiusura delle transazioni sui mercati azionari e Forex. L'essenza degli indicatori è una trasformazione matematica del prezzo di un simbolo finanziario, finalizzata alla previsione dei cambiamenti futuri dei prezzi. Prova gli indicatori tecnici, per prevedere al meglio il comportamento del mercato e ricavarne dei guadagni.
Segui la direzione del mercato a colpo d'occhio KT Trend Filter trasforma il suo metodo perfezionato di analisi del trend in una linea chiara e colorata direttamente sul grafico dei prezzi. Aiuta a riconoscere rapidamente se il mercato sta salendo, scendendo o muovendosi lateralmente senza sovrapporre più indicatori. Con il valore predefinito 200 per Trend Period, ottieni una visione direzionale ampia e mantieni lo stato attuale facile da individuare. Trasforma il trend in un contesto visivo chi
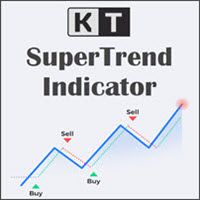
KT SuperTrend traccia una linea direzionale chiara sul grafico dei prezzi. Durante un trend rialzista, la linea avanza sotto il prezzo e può servire come riferimento per seguire il movimento. Durante un trend ribassista, passa sopra il prezzo e accompagna il mercato verso il basso. Poiché la distanza si basa sull'Average True Range, la linea si adatta quando la volatilità aumenta o diminuisce. La direzione cambia dopo che una candela chiude dall'altra parte della linea SuperTrend. Una chiusura s
KT Aroon Oscillator è una versione modificata dell'oscillatore Aroon originale, sviluppato inizialmente da Tushar Chande nel 1995. Misura l'intervallo di tempo tra i recenti massimi e minimi e utilizza queste informazioni per calcolare la direzione e la forza della tendenza di mercato. Funziona sul presupposto che durante una tendenza rialzista il prezzo raggiunga nuovi massimi consecutivi, mentre durante una tendenza ribassista si formino nuovi minimi. Segnale di acquisto: quando la linea Aroo
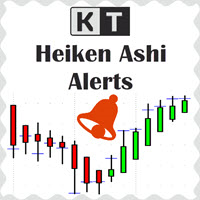
KT Heiken Ashi Alert mostra frecce di acquisto e vendita e genera avvisi basati sulle candele Heiken Ashi standard. È uno strumento indispensabile per i trader che desiderano integrare Heiken Ashi nella propria strategia di trading. Una freccia di acquisto viene mostrata quando Heiken Ashi passa da uno stato ribassista a uno rialzista. Una freccia di vendita viene mostrata quando Heiken Ashi passa da uno stato rialzista a uno ribassista. Include notifiche push, email, suoni e avvisi pop-up.
Cos

KT Pip Counter è un indicatore semplice e informativo che mostra dati essenziali in tempo reale. Informazioni così critiche possono supportare il trader durante sessioni di mercato particolarmente intense.
Funzionalità
Mostra il profitto/perdita corrente in valuta, pips e percentuale. Mostra lo spread attuale. Indica il tempo rimanente alla chiusura della candela in corso. Schemi di colore differenti per scenari di profitto o perdita. Posizione e layout del testo completamente personalizzabili

KT Pivot Points traccia automaticamente i livelli pivot giornalieri, settimanali e mensili su un grafico utilizzando i dati più recenti. I punti pivot sono indicatori ampiamente utilizzati nell'analisi tecnica, soprattutto nel mercato Forex.
Caratteristiche
Invia avvisi quando il prezzo tocca un livello pivot. Offre una personalizzazione completa per ciascun tipo di livello pivot. Mostra chiaramente i livelli pivot giornalieri, settimanali e mensili. Utilizza poche risorse CPU per calcoli p
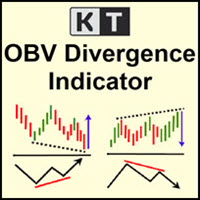
KT OBV Divergence mostra le divergenze regolari e nascoste che si formano tra il prezzo e l'oscillatore OBV (On Balance Volume).
Caratteristiche
Le divergenze asimmetriche vengono scartate per garantire maggiore precisione e ridurre il disordine visivo. Supporta strategie di trading sia per inversioni di tendenza che per continuazioni. Completamente compatibile e pronto per l'integrazione in un Expert Advisor. Utilizzabile sia per gli ingressi che per le uscite dal mercato. Tutti gli avvisi sta
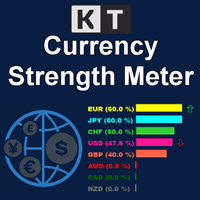
Il KT Currency Strength Meter misura la forza e la debolezza delle singole valute utilizzando una formula matematica aggregata applicata alle principali coppie di valute Forex. La forza viene calcolata analizzando le candele rialziste e ribassiste su un periodo fisso. L’algoritmo ordina poi le valute dalla più forte alla più debole, aggiornandole in tempo reale in base ai dati ricevuti.
Vantaggi
Migliora istantaneamente la tua strategia eliminando i segnali che suggeriscono di acquistare valute
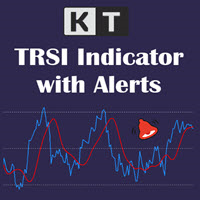
KT TRSI è un oscillatore costruito combinando RSI (Indice di Forza Relativa), EMA (Media Mobile Esponenziale) e SMA (Media Mobile Semplice). Rispetto all'RSI classico, il TRSI è meno soggetto a falsi segnali grazie all'effetto di smussamento della SMA. Inoltre, è dotato di tutti i tipi di avvisi compatibili con MetaTrader.
Regole di ingresso semplici
Acquisto: quando la linea blu (RSI) incrocia verso l'alto la linea rossa (TRSI). Vendita: quando la linea blu (RSI) incrocia verso il basso la lin
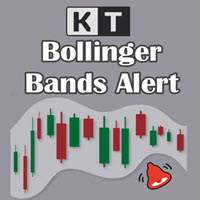
Monitora ogni tocco delle Bande di Bollinger direttamente sul grafico KT Bollinger Bands Alert mostra le bande superiore, centrale e inferiore e controlla se la candela corrente tocca una delle bande selezionate. Attiva gli eventi utili al tuo metodo e lascia che l'indicatore richiami la tua attenzione nel momento opportuno mentre osservi il resto del mercato. Mantieni visibili i valori di tutte e tre le bande Le etichette di prezzo opzionali seguono sul grafico i valori correnti delle bande sup
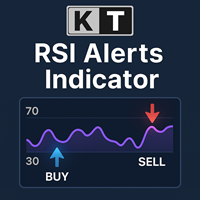
KT RSI Alerts è una versione personalizzata dell’oscillatore RSI (Relative Strength Index) che fornisce segnali e avvisi basati su quattro eventi personalizzati: Quando l’RSI entra in una zona di ipercomprato. Quando l’RSI esce da una zona di ipercomprato. Quando l’RSI entra in una zona di ipervenduto. Quando l’RSI esce da una zona di ipervenduto.
Funzionalità Ideale per i trader che analizzano i movimenti dell’RSI all’interno delle zone di ipercomprato/ipervenduto. Indicatore leggero che consu

KT Forex Volume mostra il volume di acquisto e vendita di una coppia di valute sotto forma di istogramma colorato. Il volume è composto dalle transazioni di acquisto e vendita su un asset. Nel mercato Forex: Se il volume di acquisto supera quello di vendita, il prezzo della coppia di valute tende a salire. Se il volume di vendita supera quello di acquisto, il prezzo della coppia di valute tende a scendere.
Caratteristiche Evita operazioni sbagliate confermandole con i dati di volume per tick. T
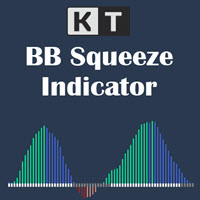
Osserva la contrazione della volatilità prima dell'espansione del momentum KT BB Squeeze riunisce lo stato della volatilità e la direzione del momentum in un oscillatore chiaro. Confronta Bollinger Bands e Keltner Channels per mostrare se il mercato è compresso o in espansione, mentre l'istogramma evidenzia l'evoluzione del momentum intorno alla linea dello zero. Punti grigi: Bollinger Bands si trova all'interno di Keltner Channels e indica una fase di compressione. Punti bianchi: Bollinger Band
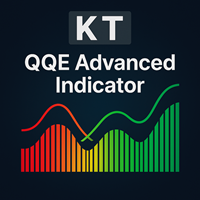
KT QQE Advanced è una versione modificata dell’oscillatore QQE classico che lo rappresenta in modo più accurato tramite un istogramma colorato con Trailing Line (TL) veloce e lenta.
A differenza del QQE classico, KT QQE Advanced presenta un istogramma con livelli di ipercomprato/iper-venduto.
Applicazioni
Trova segnali rapidi di acquisto/vendita su tutti i timeframe grazie allo scanner MTF. Individua la direzione del trend con maggiore precisione. Rileva mercati in ipercomprato/iper-venduto.
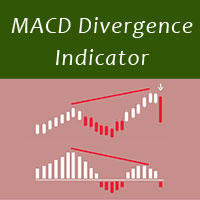
MACD divergence indicator finds divergences between price chart and MACD indicator and informs you with alerts (popup, mobile notification or email) . Its main use is to find trend reversals in the chart. Always use the divergence indicators with other technical assets like support resistance zones, candlestick patterns and price action to have a higher possibility to find trend reversals. Three confirmation type for MACD divergences: MACD line cross zero level Price returns to previous H/L Crea
FREE
Mouse You can draw fibonaccis moving the mouse over the zigzag indicator Pin them You can click on fibonacci with this option and it will no longer be deleted unless you click on it again :) Precision The tuned fibonacci gets the precise point in lower timeframes Enjoy it You can ask me for add more features, so please comment and leave your ranting for me to be happy, thank you :)
FREE

Market Momentum Alerter Market Momentum Alerter will inform you about danger to operate in the market.
Imagine you see a very nice setup (Forex, Stocks, Indices) and you decide to place your trade...
And you finally lose your trade and don't understand what happened.
This can happen due to big operations in the market carried out by banks and big institutions.
These operations are invisible for most people.
Now with the Market Momentum Alerter you will be able to detect those operations...

ATR Scanner Pro is a multi symbol multi timeframe volatility scanner that monitors and analyzes Average True Range indicator value in up to 28 symbols and 9 timeframes in 3 modes : ATR value: As a volatility dashboard it shows the ATR indicator value in all pairs and timeframes and signals when the ATR value reaches a maximum or minimum in a given duration. Short term ATR/Long term ATR ratio: It shows ratio of 2 ATRs with different periods. It's useful in detecting short term volatility and

Indicator and Expert Adviser EA Available in the comments section of this product. Download with Indicator must have indicator installed for EA to work.
Mt5 indicator alerts for bollinger band and envelope extremes occurring at the same time. Buy signal alerts occur when A bullish candle has formed below both the lower bollinger band and the lower envelope Bar must open and close below both these indicators. Sell signal occur when A bear bar is formed above the upper bollinger band and upper
FREE

KT Average Daily Range(ADR) shows the upper and lower levels using the average daily range covered by the currency pair or the instrument. The average daily range is calculated using the chosen period in the input settings. ADR High: ADR upper level is found by adding the average daily range value to the current day's low.
ADR Low: ADR lower level is found by subtracting the ADR value from the current day's high.
Features
It shows the ADR levels with several other helpful information benefici

KT Fisher Transform is an advanced version of the original Fisher Transform oscillator equipped with divergence detection, crossover alerts, and many more features. Originally it was developed by John F. Ehlers. It converts the asset's price into a Gaussian normal distribution to find the local extremes in a price wave.
Features
A light-weighted oscillator that efficiently identifies the upward and downward crossovers and marks them using vertical lines. It also finds regular and hidden diverg

PriceRunner MT5 The PriceRunner indicator is based on pure relative power. It gives promising results even in M1 timeframes in currency pairs and M2 in commodities and cryptos. The indicator is designed with user-friendly and simple settings. It is very suitable even for beginners who are interested in indicators and strategies. I am ready to make improvements on the indicator in line with the needs of those who buy or rent. However, even in its current state, you can see very promising results
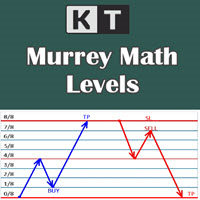
It shows the Murrey Math levels on chart and also provides an alert when price touch a particular level. T. Henning Murrey, in 1995, presented a trading system called Murrey Math Trading System, which is based on the observations made by W.D Gann.
Applications
For Murrey Math lovers, this is a must-have indicator in their arsenal. There is no need to be present on the screen all the time. Whenever the price touches a level, it will send an alert. Spot upcoming reversals in advance by speculatin
KT Candle Timer shows the remaining time in the closing of the current bar. You can use the bar closing time for multiple purposes, including time and trade management during the trading hours.
Features
It also shows the Symbol spreads along with the remaining time. It offers two convenient timer display positions, i.e., chart corner or next to the current bar. From colors to text size, it offers full customization according to user preferences. It is optimized to work without using extensive c
KT Bullish Bearish shows the bullish/bearish regime of the market in the form of a colored histogram representing both of the market states alternately. Bull Market (Blue Histogram): A bull market indicates an uptrend when an instrument price rises over a continued period like days, months, or years. Bear Market (Red Histogram): A bear market indicates a downtrend when an instrument price rises over a continued period like days, months, or years.
Applications
It prevents trading against the big
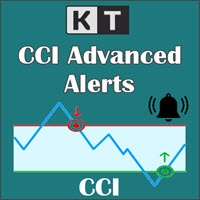
KT CCI Alerts is a personal implementation of the Commodity Channel Index (CCI) oscillator that provide signals and alerts on four custom events: When CCI enter in an overbought zone. When CCI exit from an overbought zone. When CCI enter in an oversold zone. When CCI exit from an oversold zone.
Features A perfect choice for traders who speculate the CCI movements within an overbought/oversold zone. Lightly coded without using extensive memory and resources. It implements all Metatrader alerts.
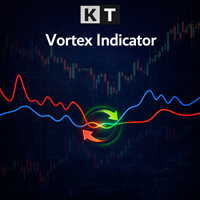
The Vortex Indicator was first presented by Douglas Siepman and Etienne Botes in January 2010 edition of Technical Analysis of Stocks & Commodities. Despite its based on a complex implosion phenomenon, the vortex is quite simple to interpret. A bullish signal is generated when +VI line cross above the -VI line and vice versa. The indicator is mostly used as a confirmation for trend trading strategies. The Vortex was inspired by the work of Viktor Schauberger, who studied the flow of water in tur
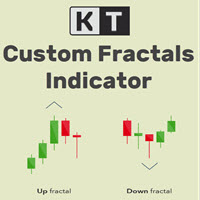
KT Custom Fractals is a personal implementation of the Fractal indicator first introduced by Bill Williams. With KT Custom Fractals you can choose a custom number of bars to allow to the left and right side of the fractal. For example, you can display the fractals that have "three" successive bars with the highest high in the middle and one lower high on both sides , or you can display the fractals that have "Eleven" consecutive bars with the lowest low in the middle and five higher lows on bot

KT Fractal Channel Breakout draws a continuous channel by connecting the successive Up and Down fractals. It provides alerts and also plots the Up and Down arrows representing the bullish and bearish breakout of the fractal channel.
Features
If you use Bill Williams fractals in your technical analysis, you must also include it in your trading arsenal. It can be very effective and useful for stop-loss trailing. A new market trend often emerges after a fractal channel breakout in a new direction.
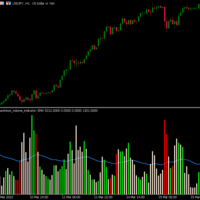
Hawkeye Volume Indicator contains a complex algorithm which executes over 300 calculations per bar in order to analyze the price action and associated volume, giving traders a tremendous advantage. Now Available in MT5 for U nlimited Use !
Volume is the only leading indicator which: .signals a price movement prior to it happening
.provides the fuel that drives the market Hawkeye Volume works in all markets and can be used in all timeframes for both tick and time charts – from longer term swing a
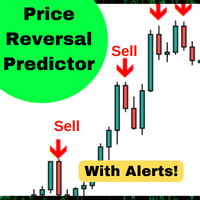
Questo algoritmo prevede variazioni di prezzo a breve termine con una precisione del 90%*. Predice se il prezzo sarà superiore o inferiore alla candela del segnale. Perfetto per il trading di reversione media, opzioni binarie o contratti futures su intervalli di tempo più grandi. L'indicatore è stato testato su 5 anni di dati e ha una precisione del 90% per prevedere inversioni di prezzo nel tempo.
Caratteristica: 1. Configurazione semplice a. Trascinare e rilasciare su qualsiasi grafico b. Ab
FREE

Questo algoritmo prevede variazioni di prezzo a breve termine con una precisione dell ' 86%*. Quando c'è una grande mossa determinata dall'ATR, durante una condizione di ipercomprato o ipervenduto, l'indicatore ti avviserà. Predice se il prezzo sarà superiore o inferiore alla candela del segnale. Perfetto per il trading di reversione media, opzioni binarie o contratti futures su intervalli di tempo più grandi. L'indicatore è stato testato su 5 anni di dati e ha una precisione del 90% per preved
FREE
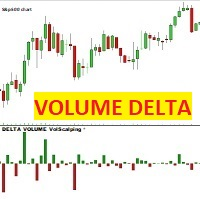
DELTA DI VOLUME Volscalping Questo indicatore, per ogni candela di prezzo, disegna una candela Delta, che è la differenza tra i contratti acquistati e venduti. La candela sarà rossa e negativa se i contratti scambiati in bid (venduti) superano quelli in ask, al contrario, la candela sarà verde e positiva se i contratti scambiati in ASK (comprati) superano quelli in bid.
ATTENZIONE: L'indicatore funziona solo con broker che forniscono un flusso di dati di mercato reale e che dividono i contrat
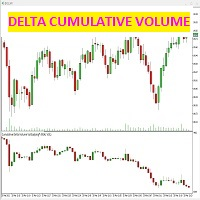
questo indicatore rileva la differenza tra i contratti battuti in bid e in ask (aggression) per ogni singola candela.
l'indicatore mostra nella finetra dedicata sotto al grafico dei prezzi, delle candele date appunto dalla differenza tra i contratti venduti ed acquistati, che generano appunto la forza volumetrica del mercato.
è possibile (vedere dagli screenshot) come selezionare solo il grafico delta cumulativo a candele, oppure anche ccon una trendline delle candele stesse: selezionando la
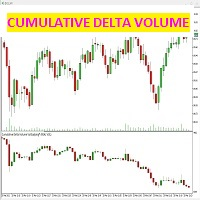
questo indicatore rileva la differenza tra i contratti battuti in bid e in ask (aggression) per ogni singola candela.
l'indicatore mostra nella finetra dedicata sotto al grafico dei prezzi, delle candele date appunto dalla differenza tra i contratti venduti ed acquistati, che generano appunto la forza volumetrica del mercato.
è possibile (vedere dagli screenshot) come selezionare solo il grafico delta cumulativo a candele, oppure anche ccon una trendline delle candele stesse: selezionando la

KT Coppock Curve trasforma una lettura smussata del momentum in una visione chiara della direzione del mercato. L'indicatore lavora in una finestra separata sotto il grafico dei prezzi, dove la linea dello zero è il riferimento principale. Invece di reagire a ogni piccolo movimento della curva, puoi vedere rapidamente se il momentum rimane sul lato rialzista o ribassista. La curva combina tassi di variazione di periodi più lunghi e più brevi, quindi ne smussa il risultato. In questo modo aiuta a
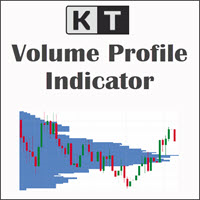
KT Volume Profile ti aiuta a studiare dove si è concentrata l'attività di trading all'interno di un'area del grafico scelta da te. Posiziona il rettangolo sul movimento da analizzare e trascina il bordo sinistro o destro. Il profilo viene ricalcolato subito e traccia un istogramma orizzontale lungo l'intervallo di prezzo selezionato. Scegli la parte del grafico che conta davvero Non sei vincolato a una sessione o a un periodo fisso. Il rettangolo mobile permette di isolare una gamba di trend, un

ROC misura la velocità con cui il prezzo è cambiato rispetto a un periodo precedente. Per questo è particolarmente utile quando il prezzo raggiunge un nuovo massimo o minimo di swing, ma il momentum dietro al movimento non lo conferma. KT ROC Divergence trova automaticamente queste differenze e traccia linee corrispondenti sul grafico del prezzo e nella finestra ROC. A differenza degli oscillatori che rimangono entro un intervallo fisso, ROC si espande e si contrae con la velocità del mercato. N
Indicatore Relative Vigor Index (RVI) avanzato con segnali a doppia linea, sistema di livello zero, supporto multi-timeframe, segnali visivi personalizzabili e sistema di avvisi altamente configurabile.
Servizi di programmazione freelance, aggiornamenti e altri prodotti TrueTL sono disponibili sul mio profilo MQL5 .
Feedback e recensioni sono molto apprezzati!
Cos'è il Relative Vigor Index (RVI)? Il Relative Vigor Index (RVI) è un oscillatore di momentum sviluppato da John Ehlers che misura l
FREE

Il nostro indicatore fornirà uno screening dello spread per monitorare lo spread di più coppie contemporaneamente e anche un conto alla rovescia del timer della candela mostra il tempo rimanente prima che la barra corrente si chiuda e si formi una nuova barra.
OFFERTA A TEMPO LIMITATO: Tutti i nostri indicatori premium sono disponibili a soli 50$, accedendo al nostro blog MQL5 troverai tutti i dettagli dei nostri indicatori premium. Clicca qui.
Caratteristiche principali
Monitora la diffu
FREE
Vedete in quale sessione forex state operando e quanti pips ha fatto ogni sessione, direttamente sul vostro grafico MetaTrader 5. KT Forex Sessions MT5 è un indicatore delle sessioni che disegna le sessioni di Tokyo, Londra e New York come box colorati e scrive l'ampiezza di ogni sessione in pips sul suo box. L'indicatore legge da solo l'offset GMT del vostro broker, e ogni sessione segue l'ora locale e l'ora legale della propria città. I box restano al posto giusto tutto l'anno, senza nulla da
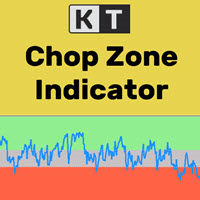
È un fatto ben noto che i mercati finanziari seguono un trend solo per circa il 30% del tempo, mentre per il restante 70% si muovono all'interno di un intervallo laterale. Tuttavia, molti trader principianti trovano difficile capire se il mercato è in tendenza o bloccato in una fase laterale. KT Chop Zone risolve questo problema evidenziando chiaramente la fase del mercato in tre zone: zona ribassista, zona rialzista e zona laterale (Chop Zone).
Caratteristiche
Migliora immediatamente le tue op
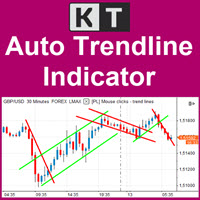
Mantieni aggiornate sul grafico le trendline importanti KT Auto Trendline costruisce automaticamente una trendline superiore e una inferiore dai recenti punti di swing ZigZag, quindi proietta entrambe in avanti sul grafico attivo. In questo modo ottieni una struttura chiara per seguire breakout in formazione, reazioni e cambi di direzione senza dover ridisegnare continuamente le stesse linee a mano. Segui insieme la struttura vicina e gli swing più ampi Il primo gruppo di trendline è attivo per
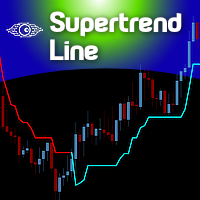
The Supertrend indicator was originally created by a french fellow named Olivier Seban , and its goal is to identify the Primary Trend of prices . Its calculation is easy and based on the average of Highs and Lows and then we add the volatility of a custom period, plus a multiplier. This way we get the Supertrend Line. You can find in the web several approaches and trading strategies using this very useful indicator.
HOW TO "READ" THIS INDICATOR
If the closing prices are above Supertrend Line,
FREE

The Analytical cover trend indicator is a revolutionary trend trading and filtering solution with all the important features of a trend tool built into one tool! The Analytical cover indicator is good for any trader, suitable for any trader for both forex and binary options. You don’t need to configure anything, everything is perfected by time and experience, it works great during a flat and in a trend.
The Analytical cover trend indicator is a tool for technical analysis of financial markets
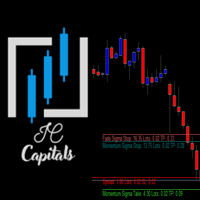
Key Features: Multi-Target Volatility: Configure multiple Take Profit and Stop Loss levels based on real-time market volatility. Fully Customizable: Set specific volatility multipliers (e.g., 4x for Stop, 10x for Take) using any look-back period (e.g., previous 20 bars on a 2-minute chart). Clear Visuals: Assign unique names to each level to be displayed directly on your symbol's chart for easy monitoring. Consistency: Every level calculated is synchronized with the volatility of your chosen per
FREE
Smart Moving Averages Indicator Smart Moving Averages is an exclusive indicator for Metatrader platform.
Instead of calculating moving averages for the selected chart time frame, the Smart Moving Averages indicator gives you the opportunity to calculate moving averages independently from the chart time frame.
For instance you can display a 200 days moving average in a H1 chart.
Inputs of the indicator are:
Timeframe : timeframe to be used for the calculation of the moving average Period : m
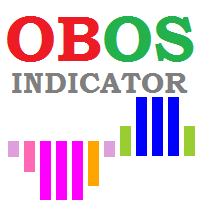
OBOS indicator
OBOS Indicator is an exclusive indicator to spot entries based on price action.
The OBOS Indicator is both effective and user friendly.
Indicator uses simple color codes and levels to indicate Overbought and Oversold conditions. No more headache.
The OBOS Indicator will only gives you indication when there are possible entries. Means you only get useful information.
Inputs of the indicator are:
MaxBars : number of bars to display in your chart Smoothing period : number of b

Tick imbalance bars (TIB), described in the book Advances in Financial Machine Learning (2018) by Marcos López de Prado. Indicator that show candlestick bars with an different sampling method than time fixed. Real time data is sourced to the indicator and it may be used as substitute of the default graph. Each bar is formed when a predefined tick balance is exceeded, showing in the graph the OHLC of this cluster of ticks. The input variable is the amount of ticks of each bar. The indicator may
FREE
Daily Pivots Multi Indicator Daily Pivots Multi is an exclusive indicator to draw your pivots levels and much more.
Most indicators draw daily pivots for the day. Daily Pivots Multi is able to draw levels for different days.
The indicator can do the calculation for unlimited number of days backward. It means that you can draw the levels for today but also for the past days.
This is very useful if you want to study a strategy with Pivots levels over a period of time.
Another problem is that e
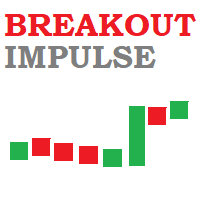
Breakout Impulse Indicator Breakout Impulse Indicator is a pattern recognition indicator for Forex, Stocks, Indices, Futures, Commodities and Cryptos.
The Breakout Impulse is a multi-bar pattern.
The purpose of the pattern is to identify a fast change in momentum.
This type of change can announce the start of a big directional move.
Inputs of the indicator are:
Distance : distance in pixel relative to top or bottom of candle to display the arrow symbol MaxBars : number of bars back used to
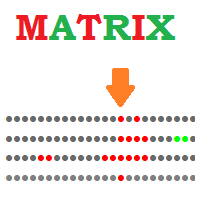
Matrix Indicator Matrix Indicator is a simple but effective indicator.
Matrix indicator displays usual oscillators indicators in a user friendly color coded indicator.
This makes it easy to identify when all indicators are aligned and spot high probability entries.
Inputs of indicator are:
Indicator: RSI, Stochastic, CCI, Bollinger Bands Param1/Param2/Param3: usual settings for the indicator ValueMin: Oversold level for oscillator ValueMax: Overbought level for oscillator The indicator can
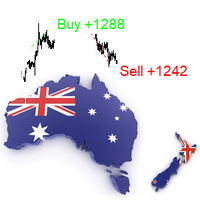
The indicator is a trading system for AUDUSD or NZDUSD currency pairs.
The indicator was developed for time periods: M15, M30.
At the same time, it is possible to use it on other tools and time periods after testing.
"Kangaroo Forex" helps to determine the direction of the transaction, shows entry points and has an alert system.
When the price moves in the direction of the transaction, the maximum length of the movement in points is displayed.
The indicator does not redraw, all actions occ
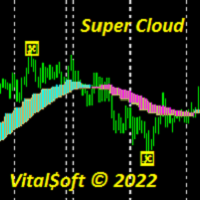
The Super Cloud indicator helps to determine the direction of the trend when trading. Shows on the chart signals about a possible upcoming trend change. The indicator provides an opportunity to detect various features and patterns in price dynamics that are invisible to the naked eye. Based on this information, traders can anticipate further price movement and adjust their strategy accordingly. Works on all timeframes except MN.

Trend Direction ADX indicator Trend Direction ADX is part of a serie of indicators used to characterize market conditions.
Almost any strategy only work under certain market conditions.
Therefore it is important to be able to characterize market conditions at any time: trend direction, trend strength, volatility, etc..
Trend Direction ADX is an indicator to be used to characterize trend direction:
trending up trending down ranging Trend Direction ADX is based on ADX standard indicator.
Tre

Trend Strength MA indicator Trend Strength MA is a part of a series of indicators used to characterize market conditions.
Almost any strategy only works under certain market conditions.
Therefore, it is important to be able to characterize market conditions at any time: trend direction, trend strength, volatility, etc.
Trend Strength MA is an indicator to be used to characterize trend strength:
Up extremely strong Up very strong Up strong No trend Down strong Down very strong Down extremely

Trend Direction Up Down Indicator Trend Direction Up Down is part of a series of indicators used to characterize market conditions.
Almost any strategy only works under certain market conditions.
Therefore it is important to be able to characterize market conditions at any time: trend direction, trend strength, volatility.
Trend Direction Up Down is an indicator to be used to characterize trend direction (medium term trend):
trending up trending down ranging Trend Direction Up Down is based

Hunt markets with Hunttern ZigZag . Easy to use with one parameter
You can use it for the following: -Classic patterns -Heads and shoulders -Harmonic patterns -Elliott Wave -Support and resistance -Supply and Demand
Single parameter: -Period (1-120)
Features: -Candle time -Single parameter -Light mode template
This is version 1 of Hunttern ZigZag. We are very happy to receive feedback from you.
FREE
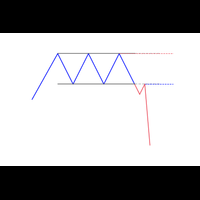
A new box will be added, if the closing price is higher than the maximum (lower than the minimum) of the current box series no less than for the specified value. Reversal will be made, if the closing price is higher (lower) than the last box on a value no less than the specified.
T his is a trend indicator and it can be used as an alternative for the trend definition instruments which use averaging.

KT Risk Reward shows the risk-reward ratio by comparing the distance between the stop-loss/take-profit level to the entry-level. The risk-reward ratio, also known as the R/R ratio, is a measure that compares the potential trade profit with loss and depicts as a ratio. It assesses the reward (take-profit) of a trade by comparing the risk (stop loss) involved in it. The relationship between the risk-reward values yields another value that determines if it is worth taking a trade or not.
Features
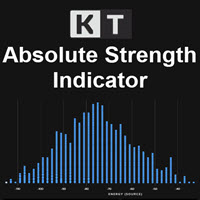
KT Absolute Strength measures and plots the absolute strength of the instrument's price action in a histogram form. It combines the moving average and histogram for a meaningful illustration. It supports two modes for the histogram calculation, i.e., it can be calculated using RSI and Stochastic both. However, for more dynamic analysis, RSI mode is always preferred.
Buy Entry
When the Absolute Strength histogram turns green and also it's higher than the previous red column.
Sell Entry
When th
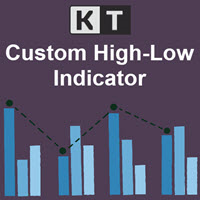
KT Custom High Low shows the most recent highs/lows by fetching the data points from multi-timeframes and then projecting them on a single chart. If two or more highs/lows are found at the same price, they are merged into a single level to declutter the charts.
Features
It is built with a sorting algorithm that declutters the charts by merging the duplicate values into a single value. Get Highs/Lows from multiple timeframes on a single chart without any fuss. Provide alerts when the current pri
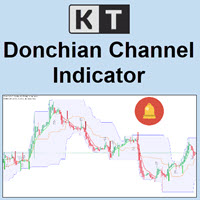
KT Donchian Channel is an advanced version of the famous Donchian channel first developed by Richard Donchian. It consists of three bands based on the moving average of last high and low prices. Upper Band: Highest price over last n period. Lower Band: Lowest price over last n period. Middle Band: The average of upper and lower band (Upper Band + Lower Band) / 2. Where n is 20 or a custom period value is chosen by the trader.
Features
A straightforward implementation of the Donchian channel ble
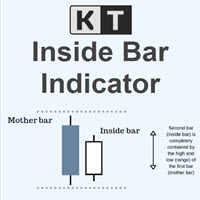
KT Inside Bar plots the famous inside bar pattern in which the bar carries a lower high and higher low compared to the previous bar. The last bar is also known as the mother bar. On smaller time-frames, the inside bar sometimes appears similar to a triangle pattern.
Features
Also plots entry, stop-loss, and take-profit levels with the inside bar pattern. No complex inputs and settings. Erase unwanted levels when the price reaches the entry line in either direction. All Metatrader alerts include
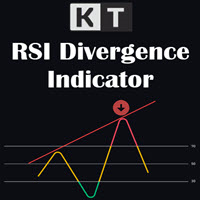
KT RSI Divergence shows the regular and hidden divergences built between the price and Relative Strength Index (RSI) oscillator. Divergence can depict the upcoming price reversal, but manually spotting the divergence between price and oscillator is not an easy task.
Features
Ability to choose the alerts only for the divergences that occur within an overbought/oversold level. Unsymmetrical divergences are discarded for better accuracy and lesser clutter. Support trading strategies for trend reve

Best indicator for MT5 providing accurate and sniper signals to enter a trade without repainting!
It can be applied to any financial assets: forex, synthetic, cryptocurrencies, metals, stocks, indices . It will provide pretty accurate trading signals and tell you when it's best to open a trade and close it. Most traders improve their trading results during the first trading week with the help of the Power Indicator Pro.
Benefits of the Power Indicator Pro
Entry signals without repaint

主要城市的时间。北京时间、东京时间、悉尼时间、惠灵顿时间、纽约时间、法兰克福时间、伦敦时间、迪拜时间。 城市时间可选择开启或者关闭。 点差变色提醒。设置点差提醒点数,例如,设置100点,点差大于100点,文字会变红色。 Time in major cities. Beijing time, Tokyo time, Sydney time, Wellington time, New York time, Frankfurt time, London time, Dubai time. City time can be turned on or off. Dot difference color change reminder. Set the point difference reminder points. For example, set 100 points. If the point difference is greater than 100 points, the text will turn red.
FREE

FX STEWARDS Trading Signals Alert (v5.00) – The Ultimate Hybrid Signal System (Heritage Edition) Built for traders. Engineered for precision. Designed to dominate. Harness the power of cutting-edge quantitative research with FX STEWARDS Trading Signals Alert, a professional-grade hybrid indicator that fuses a 73-feature neural network, a 30+ pattern candlestick engine, an institutional-style probability model, and full auto-timeframe intelligence into tiered BUY/SELL trade alerts — filtere
Automatic trend lines. Type 1. With two extremums. 1) From the current bar "go" to the left and look for the first (right) extremum point with the InpRightExmSide bars on both sides. 2) From the first point again "go" to the left and look for the second (left) extremum point with the InpLeftExmSide bars on both sides.

LT Easy Trend - La forza della confluenza in un unico indicatore Ti sei mai sentito confuso nel vedere un indicatore che segnala un acquisto mentre un altro, contemporaneamente, indica una vendita? Il LT Easy Trend è stato sviluppato per eliminare questa indecisione, fornendo segnali ad alta probabilità basati sul consenso matematico di 9 tra i più stimati indicatori tecnici al mondo. Invece di sovraccaricare il tuo grafico con decine di finestre, l'Easy Trend elabora tutto in tempo reale e most
Il MetaTrader Market è l'unico negozio online dove è possibile scaricare la versione demo gratuita di un robot di trading che consente di effettuare test e ottimizzazioni utilizzando dati statistici.
Leggi la descrizione dell'applicazione e le recensioni di altri clienti, scaricala direttamente sul tuo terminale e prova un robot di trading prima di acquistarlo. Solo sul MetaTrader Market è possibile testare un'applicazione in modo assolutamente gratuito.

Ti stai perdendo delle opportunità di trading:
- App di trading gratuite
- Oltre 8.000 segnali per il copy trading
- Notizie economiche per esplorare i mercati finanziari
Registrazione
Accedi
Accetti la politica del sito e le condizioni d’uso
Se non hai un account, registrati