SRL Edson Gould
- Indicateurs
- Grigorii Matsnev
- Version: 1.0
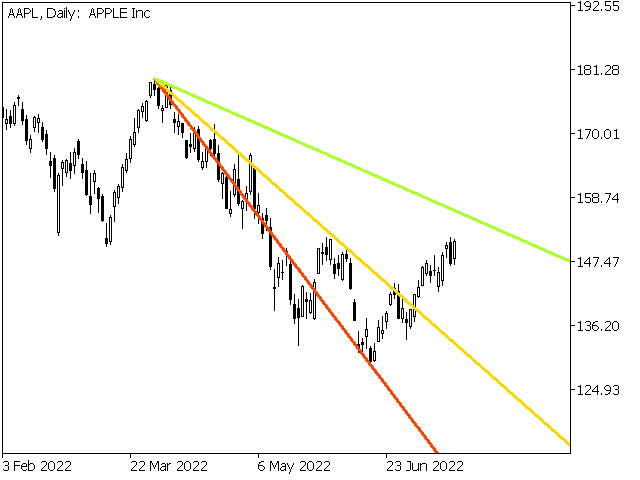
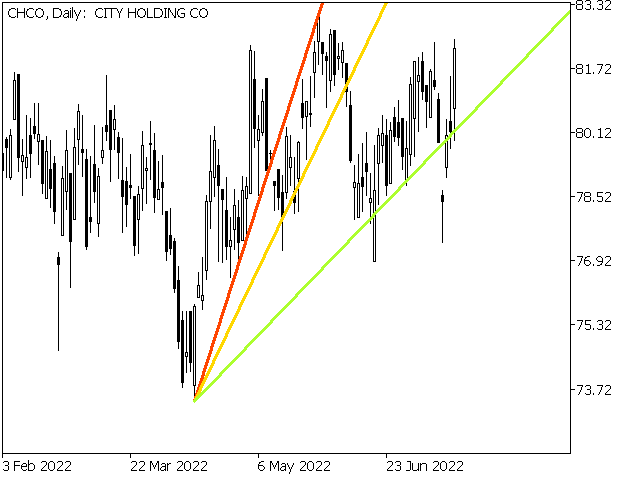
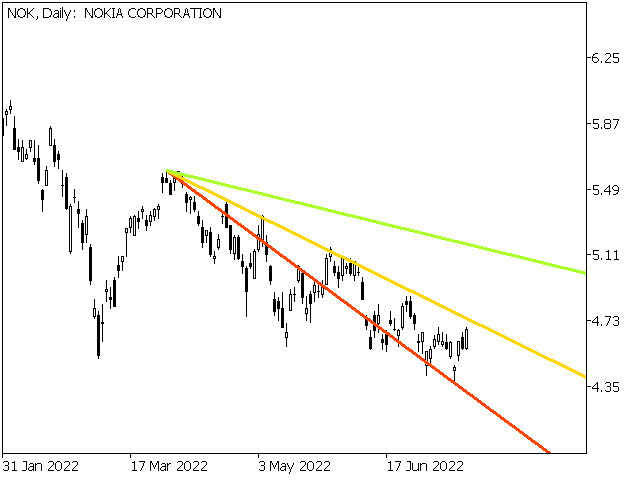
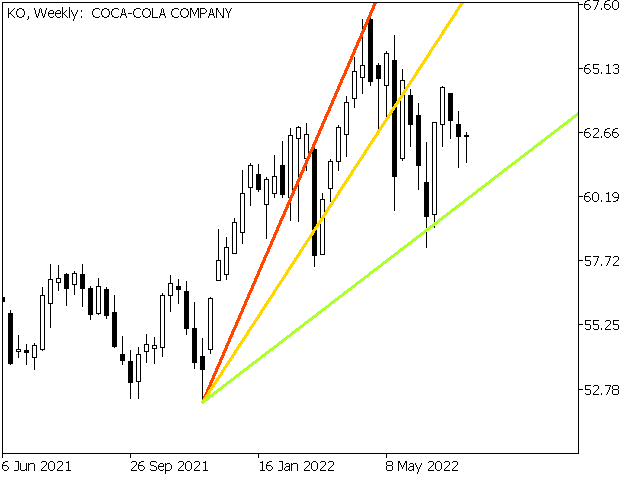
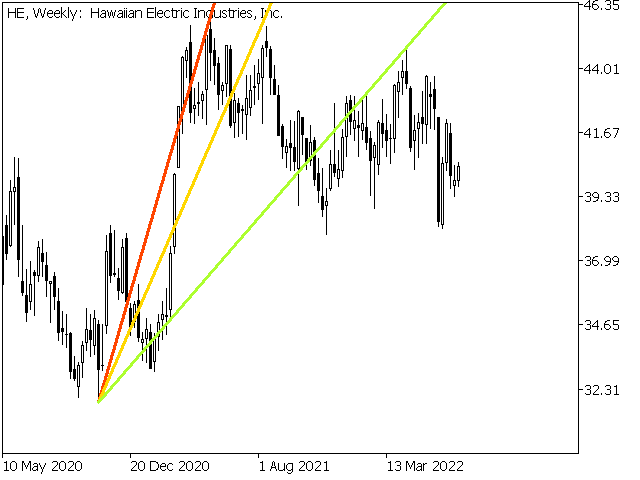
Les lignes de résistance de vitesse sont un outil puissant pour déterminer la tendance et les lignes de résistance. L'indicateur construit des lignes en utilisant des extrema graphiques et des formules Mathématiques spéciales. L'indicateur peut être utilisé pour déterminer la direction de la tendance et les points d'inversion.
<---------------------------->
Paramètres de l'indicateur:
"Depth of search" - profondeur (en barres) de la recherche extrema graphique
"Back step of search" - distance minimale (en barres) entre les extremums
"Deviation of price" - différence de prix admissible entre les extremums d'une espèce
"Line color" - couleur de la ligne avec l'index correspondant
"Line style" - style de ligne avec l'index correspondant
"Line width" - la largeur de la ligne avec l'index correspondant
<---------------------------->
Vous pouvez trouver plus d'informations dans le livre "a Collection of Rare Writings by Edson Gould" ou en me contactant dans des messages privés.
<---------------------------->
Merci d'avance à tous ceux qui sont intéressés, bonne chance dans la conquête du marché!

Very Brilliant indicator 👏 👌