SRL Edson Gould
- Indikatoren
- Grigorii Matsnev
- Version: 1.0
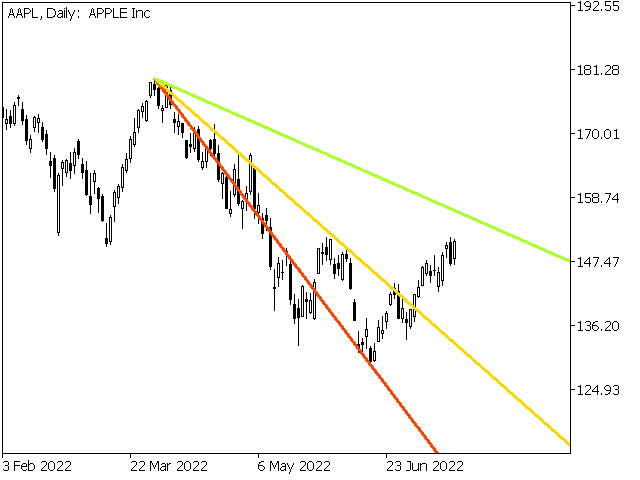
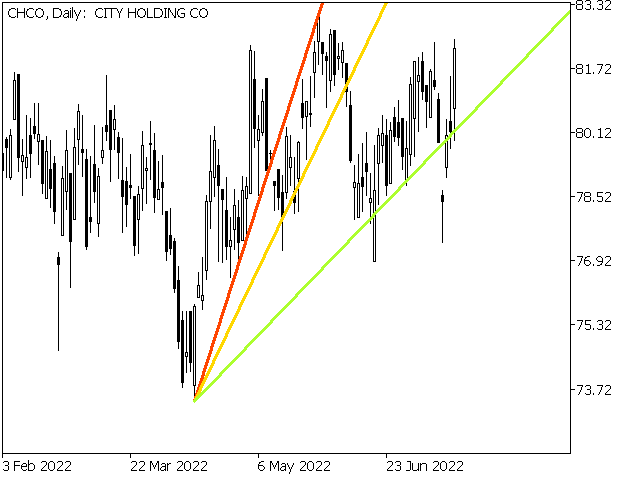
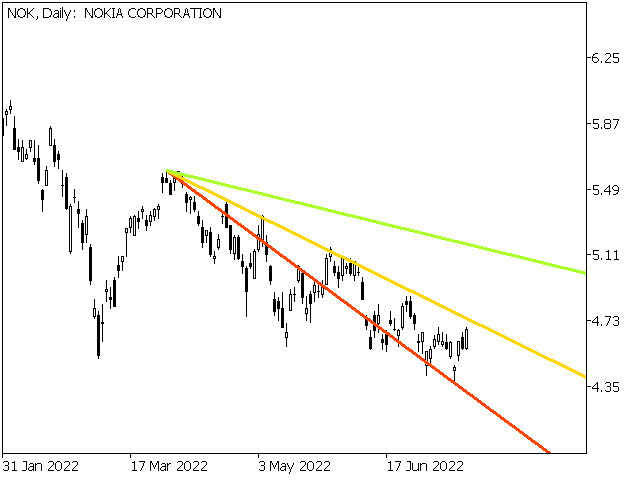
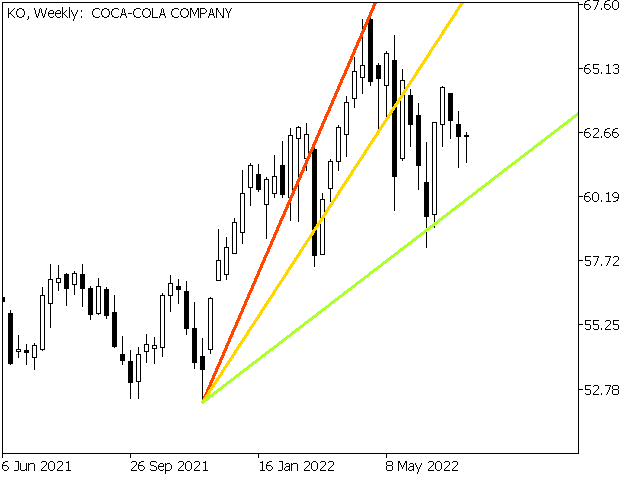
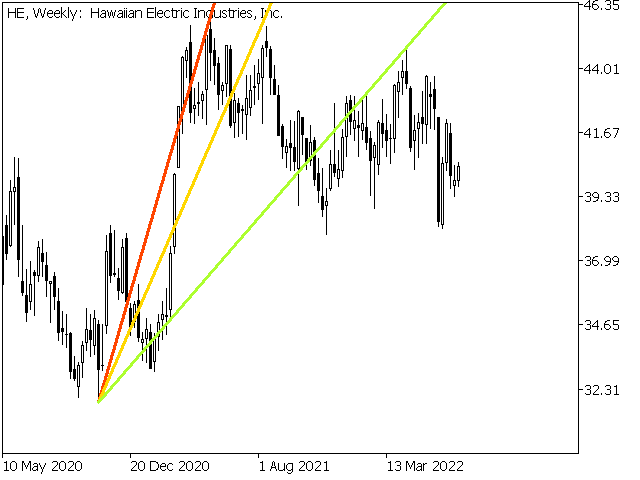
Geschwindigkeitswiderstandslinien sind ein leistungsfähiges Werkzeug zur Bestimmung von Trend- und Widerstandslinien. Der Indikator baut Linien mit extremen Grafiken und speziellen mathematischen Formeln. Der Indikator kann verwendet werden, um die Trendrichtung und die Umkehrpunkte zu bestimmen.
<---------------------------->
Parameter des Indikators:
"Depth of search" - die Tiefe (in Bars) der Suche nach den Extremen des Graphen
"Back step of search" - der Mindestabstand (in Bars) zwischen Extrema
"Deviation of price" - der zulässige Preisunterschied zwischen Extrema derselben Art
"Line color" - die Farbe der Linie mit dem entsprechenden Index
"Line style" - Der Linienstil mit dem entsprechenden Index
"Line width" - die Breite der Linie mit dem entsprechenden Index
<---------------------------->
Weitere Informationen finden Sie im Buch "A Collection of Rare Writings by Edson Gould" oder kontaktieren Sie mich in persönlichen Nachrichten.
<---------------------------->
Ich danke allen Interessierten im Voraus, viel Glück bei der Eroberung des Marktes!

Very Brilliant indicator 👏 👌