SRL Edson Gould
- Indicators
- Grigorii Matsnev
- Version: 1.0
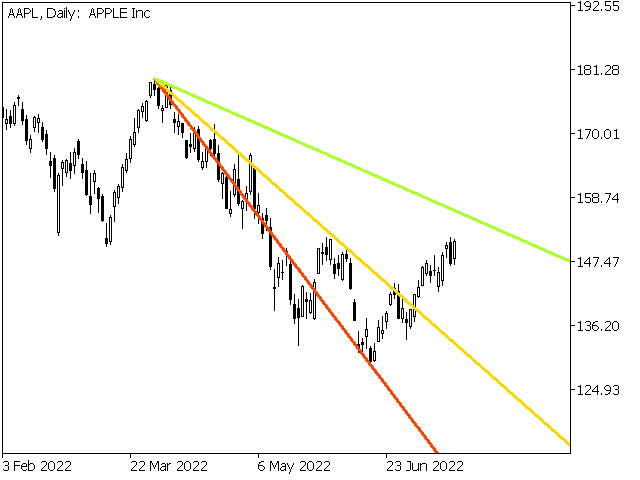
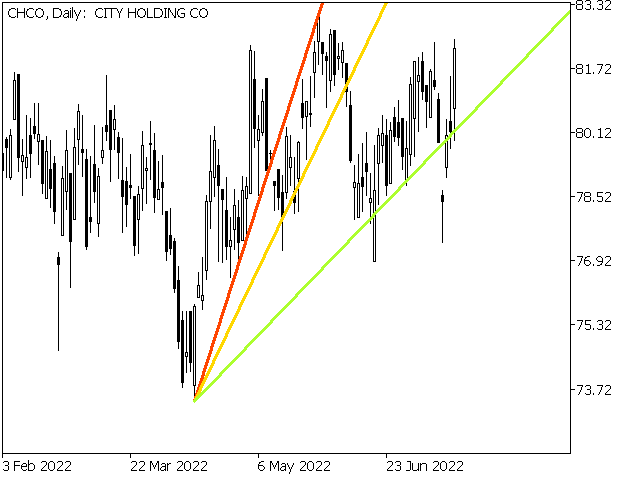
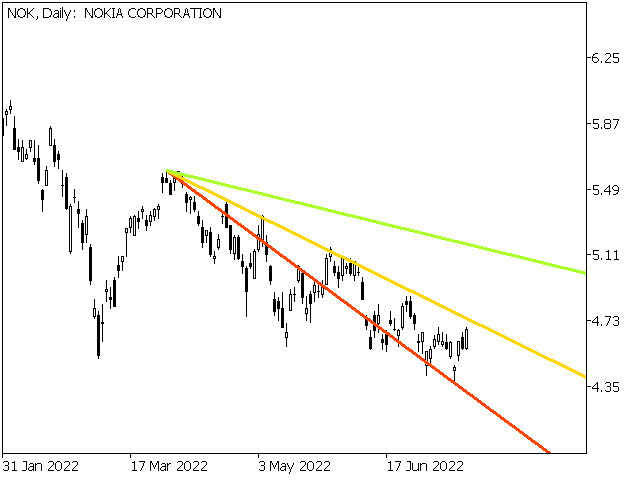
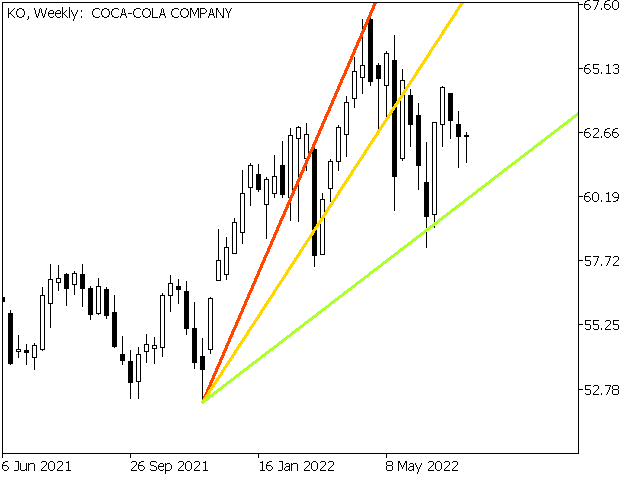
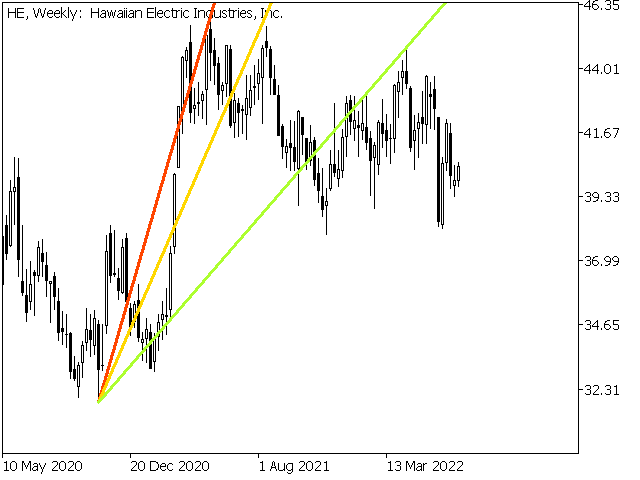
Speed resistance lines are a powerful tool for determining trend and resistance lines. The indicator builds lines using chart extremes and special mathematical formulas. The indicator can be used to determine the trend direction and pivot points.
<---------------------------->
Indicator Parameters:
"Depth of search" - depth (in bars) of the search for chart extremes
"Back step of search" - minimum distance (in bars) between extremes
"Deviation of price" - permissible price difference between extremes of the same type
"Line color" - line color with corresponding index
"Line style" - line style with corresponding index
"Line width" - line width with corresponding index
<---------------------------->
You can find more information in the book "A Collection of Rare Writings by Edson Gould" or by contacting me in private messages.
<---------------------------->
Thank you in advance to all those interested, good luck in conquering the market!

Very Brilliant indicator 👏 👌