Currency Power Meter Infinity mt4
FREE
Publié:
18 décembre 2020
Version actuelle:
1.4
Vous ne trouvez aucun robot qui vous convient ?
Commandez le vôtre
dans la section Freelance
Aller à la section Freelance
Commandez le vôtre
dans la section Freelance
Comment acheter un robot de trading ou un indicateur
Exécutez votre EA sur
hébergement virtuel
hébergement virtuel
Test un indicateur/robot de trading avant d'acheter
Vous voulez gagner de l'argent sur Market ?
Comment présenter un produit pour qu'il se vende bien
Vous manquez des opportunités de trading :
- Applications de trading gratuites
- Plus de 8 000 signaux à copier
- Actualités économiques pour explorer les marchés financiers
Inscription
Se connecter
Vous acceptez la politique du site Web et les conditions d'utilisation
Si vous n'avez pas de compte, veuillez vous inscrire
Question;
1. When I attach CMP indicators on 1 hour chart, it shows " CPM INFINITY 3.67 3.64 5.65 6.80 5.87 5.12 4.03 6.28"
What do you mean by its figures ( 3.67 3.64 ---- 6.28 ) ? Does it mean ( CPM ; 8 hours before, 7 hours before, ,,, 1 hour before) ?
2. I need more detailed explanation what means following table, and how to use it.
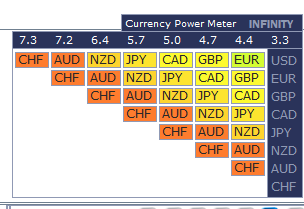
Hello. As you can see in the Power meter of currency panel (on the right) all currencies are ranked from the strongest to the weakest. Similarly, in the cross-rate Power meter panel (on the left), you can see the same values
This means that the strongest currency and the weakest currency AUDUSD according to calculations made in the last 6 days is the highest priority for buying
Switching to lower timeframes (M1-H4) you just need to find the entry point using other tools and indicators, for example: TrendLine PRO, TruePoints, ProfitZone indicators or TL GRID EA, Double Impact EA, Level Trend EA and TradeUtility EA
I just purchased the CPM tool. If you use CPM to determine the direction of the trend (so that you are trading "WITH the trend") how do you use it to determine when that "trend" is likely getting close to changing direction?
You have answered about my No.2 question, thanks.
How about No.1 question as following ?
When I attach CMP indicators on 1 hour chart, it shows " CPM INFINITY 3.67 3.64 5.65 6.80 5.87 5.12 4.03 6.28"
What do you mean by its figures ( 3.67 3.64 ---- 6.28 ) ? Does it mean ( CPM ; 8 hours before, 7 hours before, ,,, 1 hour before) ?
I just purchased the CPM tool. If you use CPM to determine the direction of the trend (so that you are trading "WITH the trend") how do you use it to determine when that "trend" is likely getting close to changing direction?
Hello. Thanks for your question.
1. I look for the maximum divergence of power. This is a signal the trend will be change soon. I use D1 calculation period
After that I use my other trend indicators to open a dial on the lower timeframes: (intraday M15-H1) by the trend directly (only Sell or only BUY)
Also, you can use the Auto or Manual trading mode of Expert Advisors to make a deal to the trend directly too
You have answered about my No.2 question, thanks.
How about No.1 question as following ?
When I attach CMP indicators on 1 hour chart, it shows " CPM INFINITY 3.67 3.64 5.65 6.80 5.87 5.12 4.03 6.28"
What do you mean by its figures ( 3.67 3.64 ---- 6.28 ) ? Does it mean ( CPM ; 8 hours before, 7 hours before, ,,, 1 hour before) ?
Hello. The CPM indicator calculates Power of currency. That means the numbers are power of each FX currency
How should we utilize the new features you've added to the Indicator (I see a new Buy or Sell rating in the upper left hand corner of the chart now) and I also see the UP and DOWN arrows. Can you let us know if there are any specific things we should know about them? I will notice that the current rating (in the upper left hand corner of the chart) might indicate a SELL STRONG rating while the last UP / Down arrow is indicating the opposite (i.e. the upper left hand corner reads: SELL STRONG but yet the last arrow is a blue UP arrow).
How should we interpret this?
thanks again,
David
Hello. Thanks for feedback
You should trade a signal which match the hint:
Hello. Thanks for feedback
You should trade a signal which match the hint:
Thanks for the quick response. I find that (most of the time) the "hint" often contradicts the up/down Arrow (not always though). So we should look for "agreement" between the "hint" and the "arrow". Do the specific timeframes (such as M5 / M15 versus H1 or H4) also give us an indication on about "how long" before the trend starts to head in the direction of the "arrow"? Also, does the timeframe that the "arrow" appears provide an indication of the overall "strength" of the move? (i.e. if an UP Arrow appears on the H4 and not the H1) - would that indicate that the strength and distance of the move will be stronger?
I have spent a lot of time looking at the charts and I like what I see so far (there appears to be correlation in 'most' cases) - thank you for adding this new feature (I think it added a lot of value to the indicator).
I will add a new review once I've had some more time with it (and can further validate its reliability). If you can add some additional information related to "How YOU use the indicator, that would also be very helpful.
Thanks again,
David
I also meant to ask what timeframe is the "Hint" using (I am referring to the "SELL" / "Strong SELL" / "Weak Sell" / "BUY" / "Wait" signal in the upper left hand corner) - is that "hint" based on the longer timeframe such as the D1 or ??
thanks again.
Look. If we set D1 higher timeframe, the CPM calculate power of all pair for last 6 candles (Days)
The strongest currency is AUD and the weakest is EUR. Then you need to choose a pair (EURAUD) to trade and click on it
After that you need to wait for a signal in the same direction on the current timeframe or switch to a smaller one
Make a trade in the direction of a strong trend and take profit on the opposite signal or at a fixed price
Also you cat trading Weak or undefined (Wait) signals to the both trade directions using smaller timeframes: M1-M30
If the indicator lines begin to converge, this may mean a change in the trend and a successful entry into the BUY trade for more risky traders. Despite the fact that there is still a weak SELL signal:
HI there,
I like this indicator a lot but I want to understand where the "hints" are coming from or how they are generated? I can't seem to figure our why I got a hint where I did on the charts and I don't like to follow indicators blindly. I want to know what is causing the hints so I can have confidence in that signal.
Thanks
April
Thanks for your indicator. One question: if I trade the 15M chart, which time frame would you advise to consider as reference ? H4 ? D1?
Thanks
Alex
Hi,
Thanks for your indicator. One question: if I trade the 15M chart, which time frame would you advise to consider as reference ? H4 ? D1?
Thanks
Alex
Hi. Yes. You can use H4 and D1 as HTF filter
Hallo, bei der Einstellung 6 und einem Timeframe D1 bezieht sich der Indikator auf die letzen 6 Tage.
Beim Timeframe H4 sind das dann die letzten 24 Stunden und beim Timeframe H1 die letzten 6 Stunden.
Meine Frage, handeln Sie mit dem Wert 6 oder hat sich ein anderer Wert bestätigt.
Vielen Dank, Peter
Hello,
Many thanks for your professionnaly made indicator which you make free.
I have been playing with it a few hours on different currency pair. I
As regards the user inputs:
1. I understand the user input "Bars Range to calculate Power" determines how many lookback bars the indicator will use to compute the power, e.g. if the M15 timeframe is selected and an input of 10 , it will use the previous then M15 bars to calculate the power. Please conform the correct understanding.
2. I have been trying to understand the use of the other input "Amplitude" and noticed that any change of the input has a strong effect on the calculation of the relative power of the pairs. Moreover, it makes the timeframe selection jump back to D1 ? So, will you please give a bit of information as to how to use this input ?
Thanks in advance,
Roberto
Hello. Thanks for feedback
You should trade a signal which match the hint:
is it possible to update to make it hide the signal (arrow + colored rectangle) ? thank you!
bad product
You are a scammer, you stole my money with an account
BE53 6717 9579 5953
Edres Abu libda