Smart Candle Analyzer pro
- Indicateurs
- Version: 1.20
- Activations: 5

Advanced Candlestick Pattern Recognition, Liquidity Analysis & Signal Quality Evaluation for MetaTrader 5
Smart Candle Analyzer Pro is a technical analysis indicator developed for MetaTrader 5 (MT5).
It combines Japanese candlestick pattern recognition, price action analysis, liquidity sweep detection, relative tick-volume activity, and signal quality evaluation into a single indicator.
The indicator helps traders identify potential bullish and bearish trading opportunities while providing additional information about market conditions and historical signal outcomes.
KEY FEATURES
1. Advanced Candlestick Pattern Recognition
Smart Candle Analyzer Pro analyzes price action and recognizes the following candlestick patterns:
-
Morning Star
-
Evening Star
-
Three White Soldiers
-
Three Black Crows
-
Bullish Engulfing
-
Bearish Engulfing
-
Bullish Harami
-
Bearish Harami
-
Hammer Shape
-
Shooting Star Shape
-
Marubozu
-
Doji (Neutral Pattern)
Each pattern is identified using programmed candlestick geometry and price conditions.
2. Bullish and Bearish Trading Signals
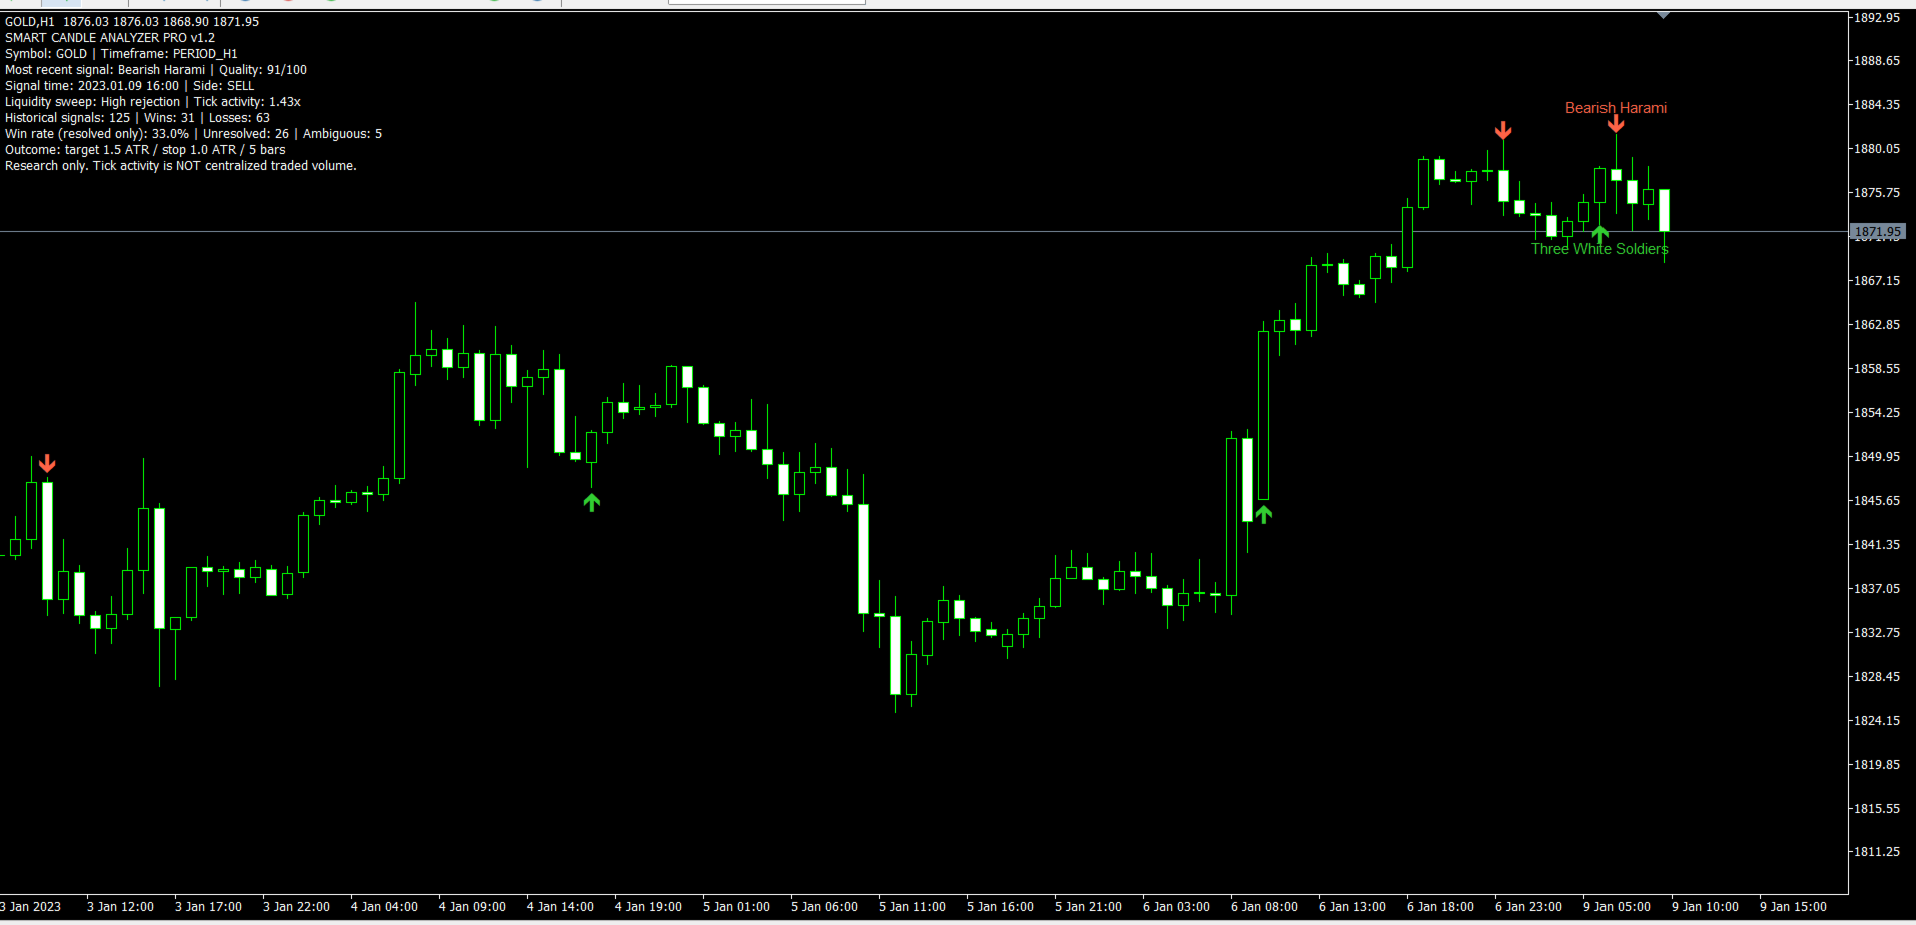
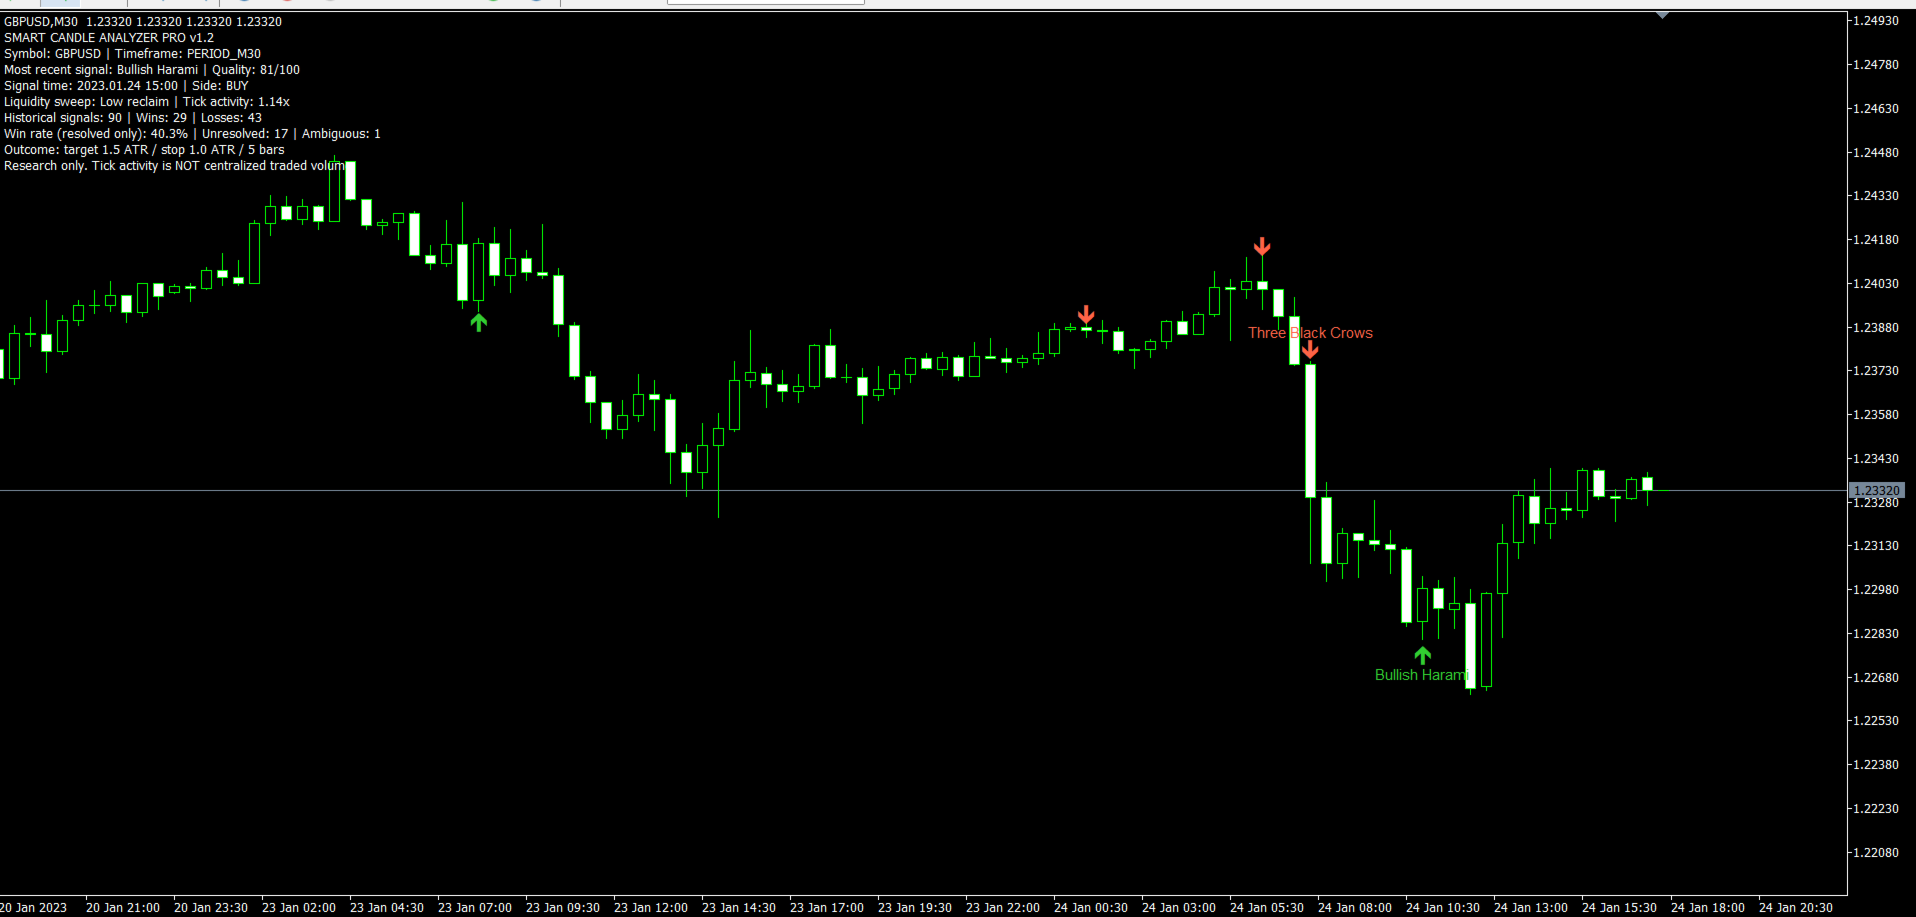
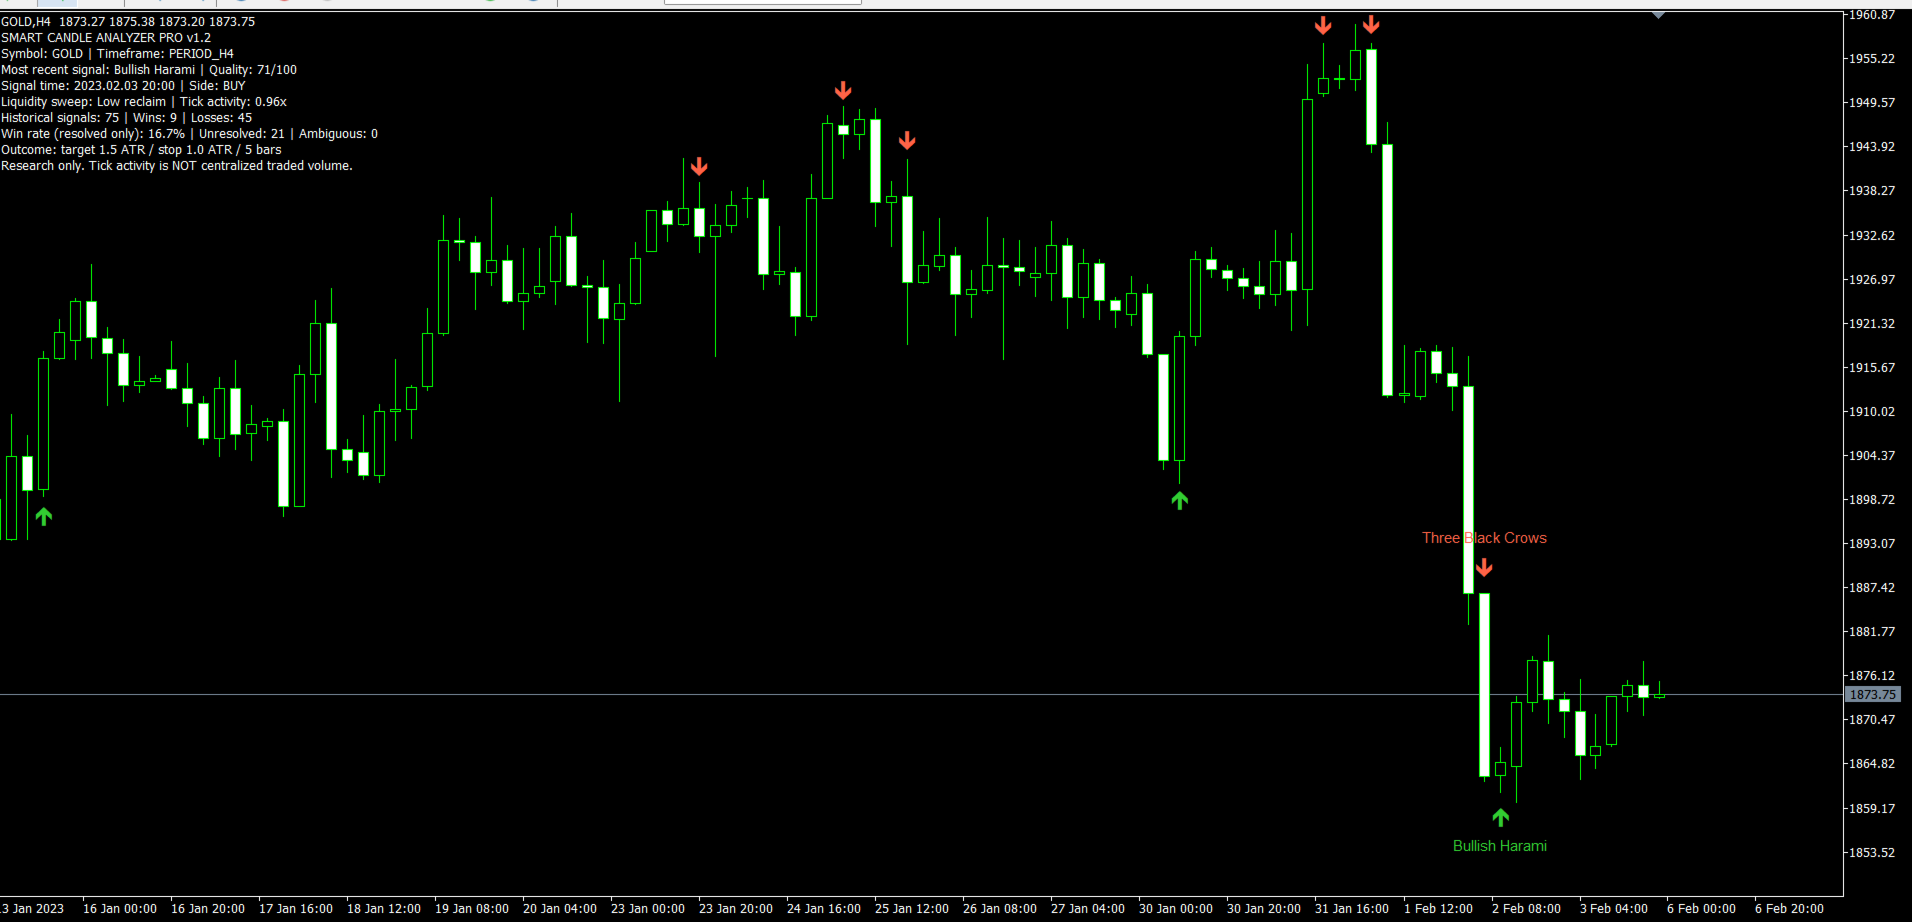
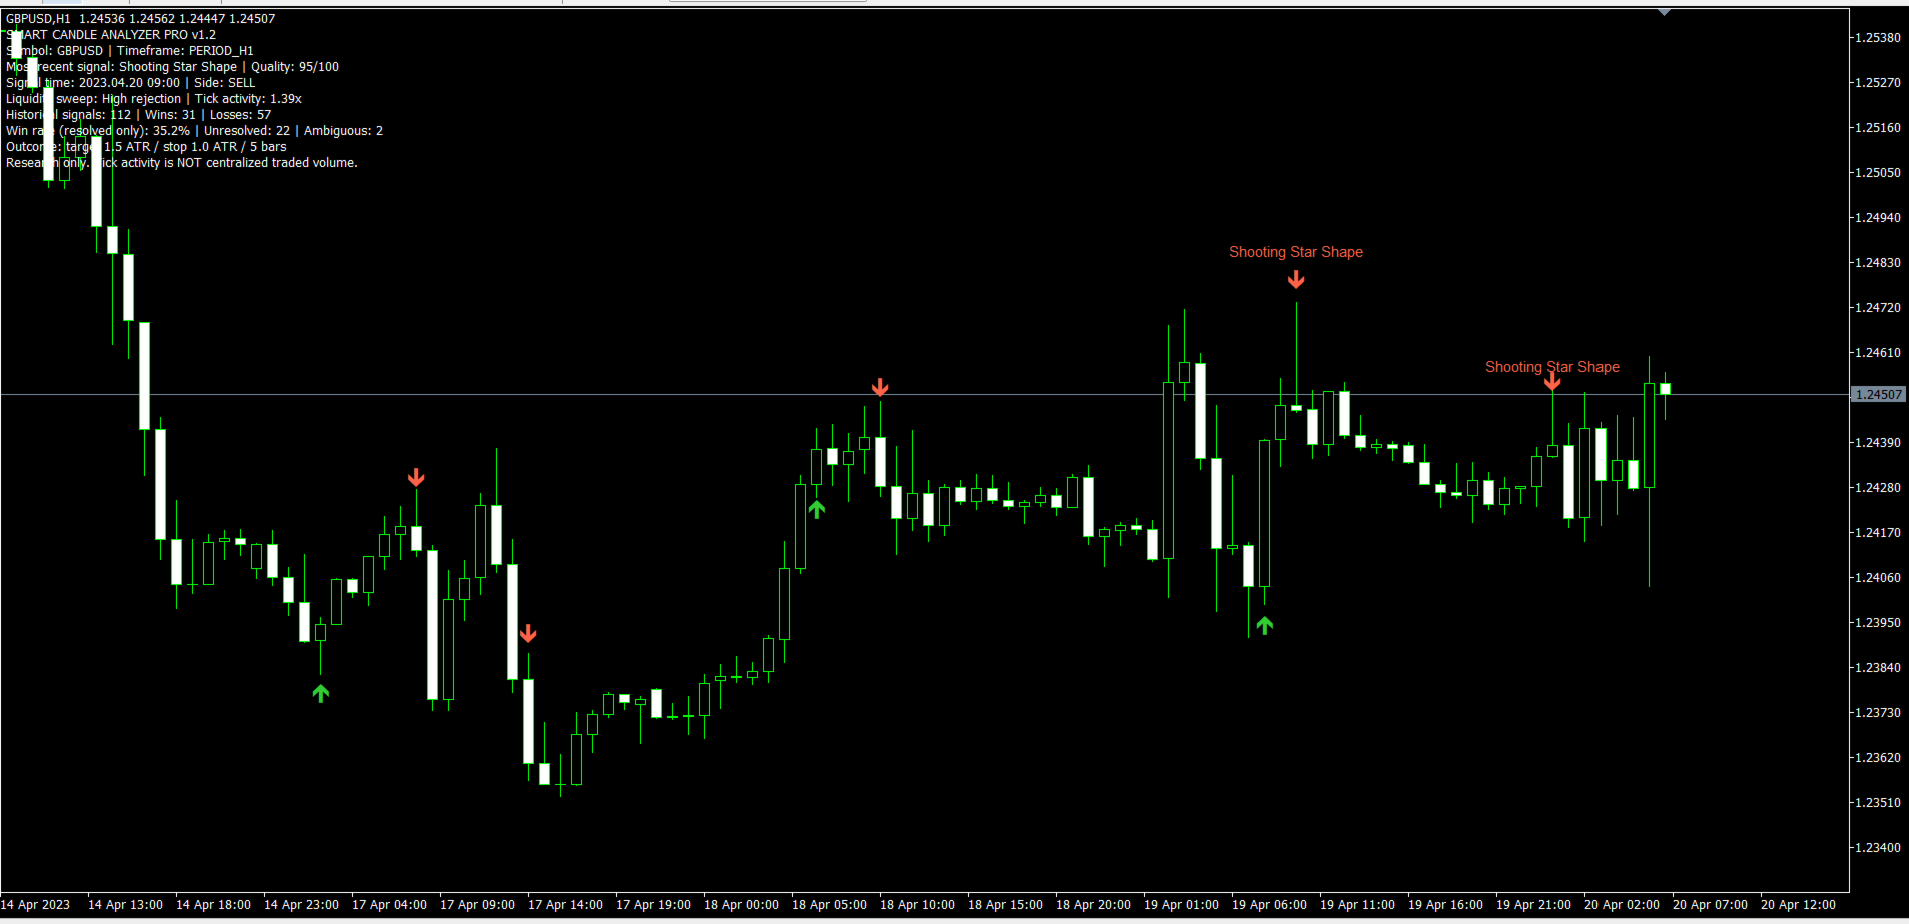
The indicator displays visual signals directly on the trading chart.
Green arrows: Potential bullish opportunities.
Red arrows: Potential bearish opportunities.
Signals are calculated using completed candles to avoid relying on unfinished candle patterns.
Historical signal arrows remain associated with their original candles during normal operation.
3. Signal Quality Scoring (0–100)
Each qualifying trading signal receives a quality score based on several factors:
-
Candlestick pattern characteristics.
-
Previous market direction.
-
Liquidity sweep conditions.
-
Relative tick-volume activity.
Traders can customize the minimum acceptable signal score to filter trading opportunities.
A higher score indicates stronger agreement among the indicator's programmed conditions. It does not represent a guaranteed probability of success.
4. Liquidity Sweep Detection
The indicator examines previous price highs and lows to identify potential liquidity sweep conditions.
It analyzes situations where price moves beyond a previous high or low and subsequently returns within the earlier price range.
These conditions are incorporated into the signal evaluation process.
5. Relative Tick-Volume Analysis
Smart Candle Analyzer Pro compares current tick-volume activity with historical tick-volume averages.
This helps identify periods of relatively elevated market activity.
Important: Tick volume represents price-update activity and should not be interpreted as centralized traded volume.
6. Historical Signal Performance Statistics
The indicator includes a historical evaluation system based on configurable ATR target and stop distances.
The information panel displays:
-
Total historical signals.
-
Historical target hits.
-
Historical stop hits.
-
Win rate for resolved signals.
-
Unresolved outcomes.
-
Ambiguous outcomes.
These statistics are calculated using historical price movements and predefined evaluation rules.
They are descriptive research statistics, not actual trading results or a guarantee of future performance.
7. On-Chart Information Dashboard
A convenient dashboard displays important analytical information, including:
-
Trading symbol and timeframe.
-
Most recent qualifying signal.
-
Signal direction.
-
Candlestick pattern name.
-
Signal quality score.
-
Liquidity sweep information.
-
Relative tick-volume activity.
-
Historical signal statistics.
-
ATR-based evaluation settings.
8. Customizable Candlestick Pattern Labels
Traders can choose how candlestick pattern names appear on the chart.
Available options include:
Show Pattern Names: Enable or disable pattern labels.
Keep Historical Pattern Names: Retain previous pattern names on the chart.
Maximum Pattern Labels: Configure the maximum number of historical labels displayed.
When historical label retention is disabled, the indicator displays only the two most recent qualifying pattern names.
This feature allows traders to choose between a cleaner chart and more detailed historical analysis.
9. Configurable ATR-Based Evaluation
The indicator uses Average True Range (ATR) to evaluate historical signal outcomes.
Traders can customize:
-
ATR calculation period.
-
Target distance multiplier.
-
Stop distance multiplier.
-
Number of candles used for outcome evaluation.
These settings are used for historical signal analysis and do not automatically place stop-loss or take-profit orders.
10. Customizable Signal Alerts
The indicator supports alerts for qualifying signals detected on completed candles.
Alerts can be enabled or disabled through the indicator settings.
11. Flexible Trading Applications
Smart Candle Analyzer Pro can be applied to different financial instruments and chart timeframes supported by MetaTrader 5, including:
-
Forex currency pairs.
-
Gold and other metals.
-
Market indices.
-
Other supported trading instruments.
Signal frequency and performance may vary significantly between instruments, timeframes, and market conditions.
HOW TO USE
-
Open MetaTrader 5.
-
Select your preferred financial instrument and timeframe.
-
Attach Smart Candle Analyzer Pro to the chart.
-
Configure the minimum signal quality score.
-
Enable or disable pattern names and historical labels.
-
Monitor bullish and bearish signals.
-
Review signal quality and market activity before making trading decisions.
-
Apply independent risk management and additional confirmation when appropriate.
MAIN INPUT PARAMETERS
InpLookbackBars: Number of historical bars analyzed.
InpMinimumScore: Minimum signal quality score required.
InpTrendPeriod: Historical period used for trend analysis.
InpSwingLookback: Lookback period for liquidity sweep detection.
InpVolumePeriod: Period used to calculate average tick-volume activity.
InpHighActivityRatio: Threshold for elevated tick-volume activity.
InpOutcomeBars: Number of subsequent candles used to evaluate historical signals.
InpTargetATR: ATR multiplier for the historical target level.
InpStopATR: ATR multiplier for the historical stop level.
InpATRPeriod: ATR calculation period.
InpEnableAlerts: Enable or disable signal alerts.
InpShowDashboard: Show or hide the information dashboard.
InpShowPatternNames: Show or hide candlestick pattern labels.
InpKeepHistoryNames: Enable or disable historical pattern name retention.
InpLabelCount: Maximum number of historical pattern labels when retention is enabled.
IMPORTANT INFORMATION
Smart Candle Analyzer Pro is a technical analysis indicator, not an automated trading robot.
It does not open, manage, or close trading positions.
The indicator does not guarantee profitable signals or predict future market movements with certainty.
Historical statistics are based on simulated price-level evaluations and do not include all real trading costs, such as commissions, spreads, or execution slippage.
Users are encouraged to evaluate the indicator in the MetaTrader 5 Strategy Tester and on a demo account before using it for live trading.
Platform: MetaTrader 5
Product Type: Technical Indicator
Version: 1.2