Snipersmc
- Indicateurs
-
Emmanuel Chinedu Ifechukwu
 Developer/ Circuit Technician
 - Version: 10.10
- Mise à jour: 28 septembre 2026
- Activations: 5
SNIPERSMC MT5 INDICATOR Complete User Guide
1. What SniperSmc Is
SniperSmc is a MetaTrader 5 chart indicator designed to identify
potential Buy and Sell opportunities using Smart Money Concepts, market
structure, price gaps, liquidity behavior, volume information and
higher-timeframe direction.
It does not automatically open trades.
When a valid setup is found, the indicator can show a Buy arrow, a Sell
arrow, the suggested entry price, the type of order that should be used,
important market areas, market structure, Fair Value Gaps, Fibonacci
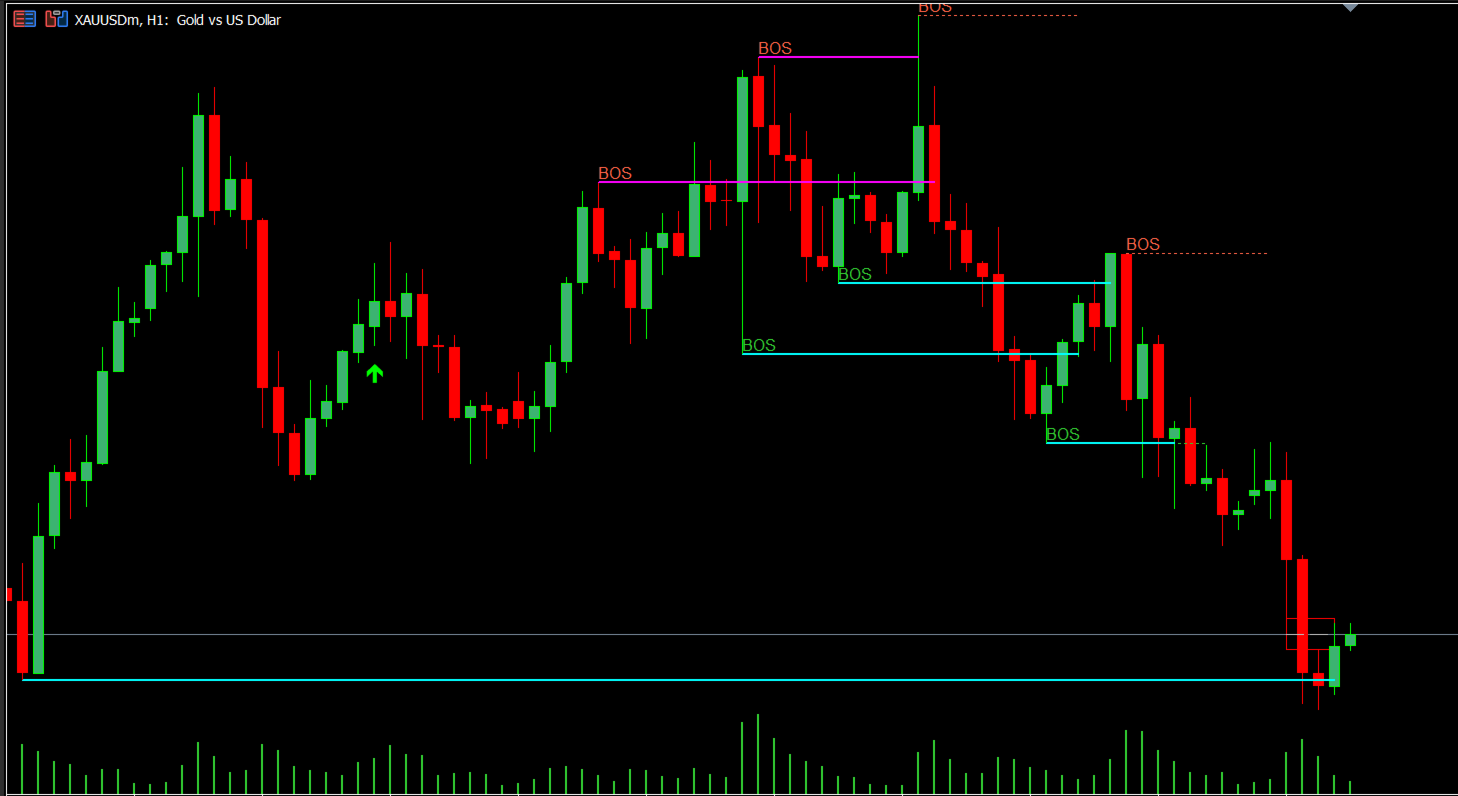
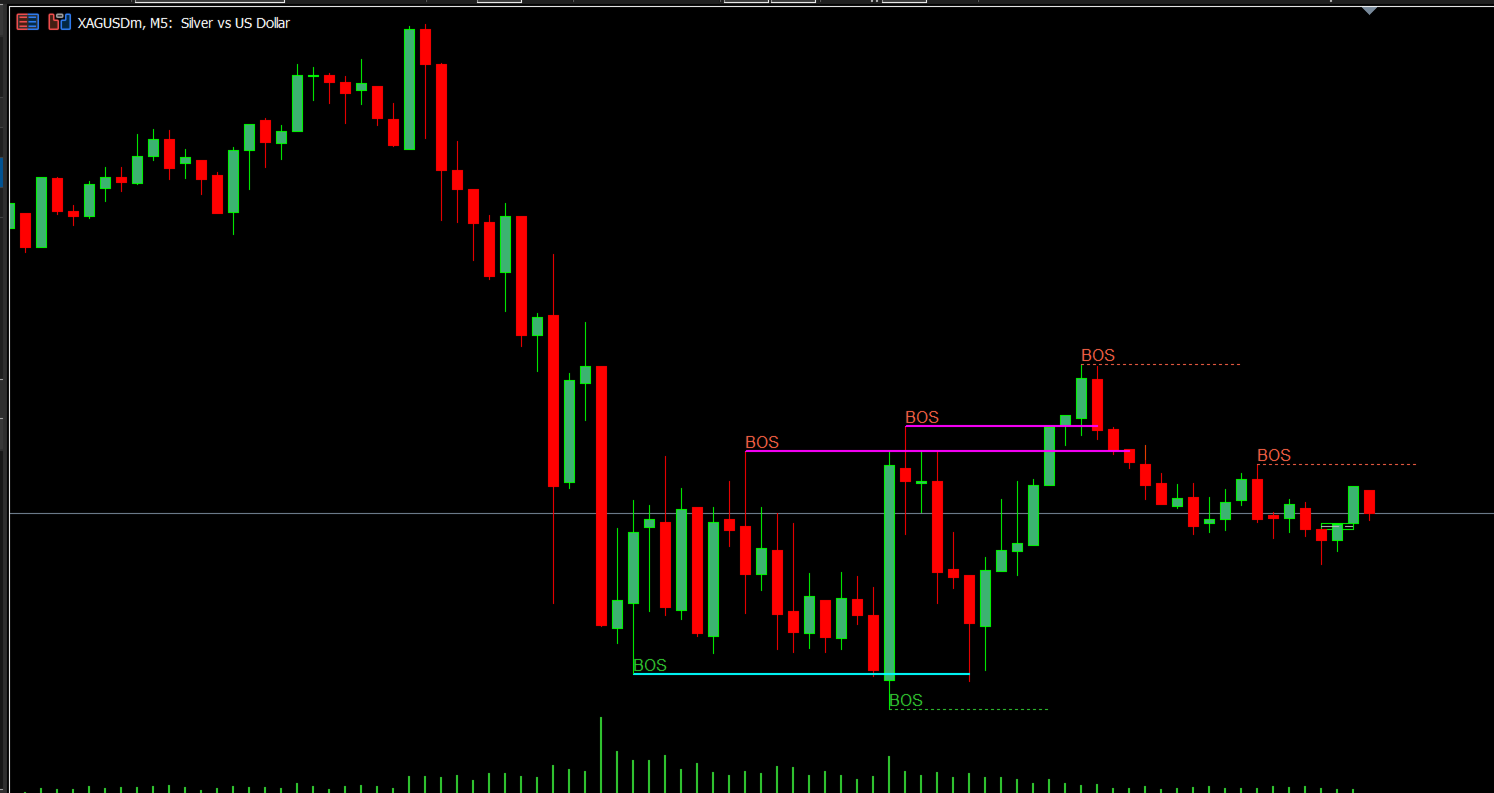
areas, Fibonacci extension targets, optional Order Blocks, optional
support and resistance, optional volume-profile information, EMA lines,
alerts and notifications.
2. How SniperSmc Works
SniperSmc looks at several pieces of market information before
displaying a signal.
It considers: - Higher-timeframe market direction. - Market structure. -
Major swing points. - Minor swing points. - Breaks of structure. -
Changes in market structure. - Fair Value Gaps. - Inverse Fair Value
Gaps. - Liquidity sweeps. - Fibonacci areas. - Volume information. - CVD
information. - ATR-based market movement. - Spread. - Trading session. -
Minimum signal score.
The indicator combines these factors into a score. A signal is displayed
only when the setup reaches the minimum score you selected.
3. Minimum Signal Score
Setting: Minimum Score to Fire Signal
Default: 14 Maximum: 25
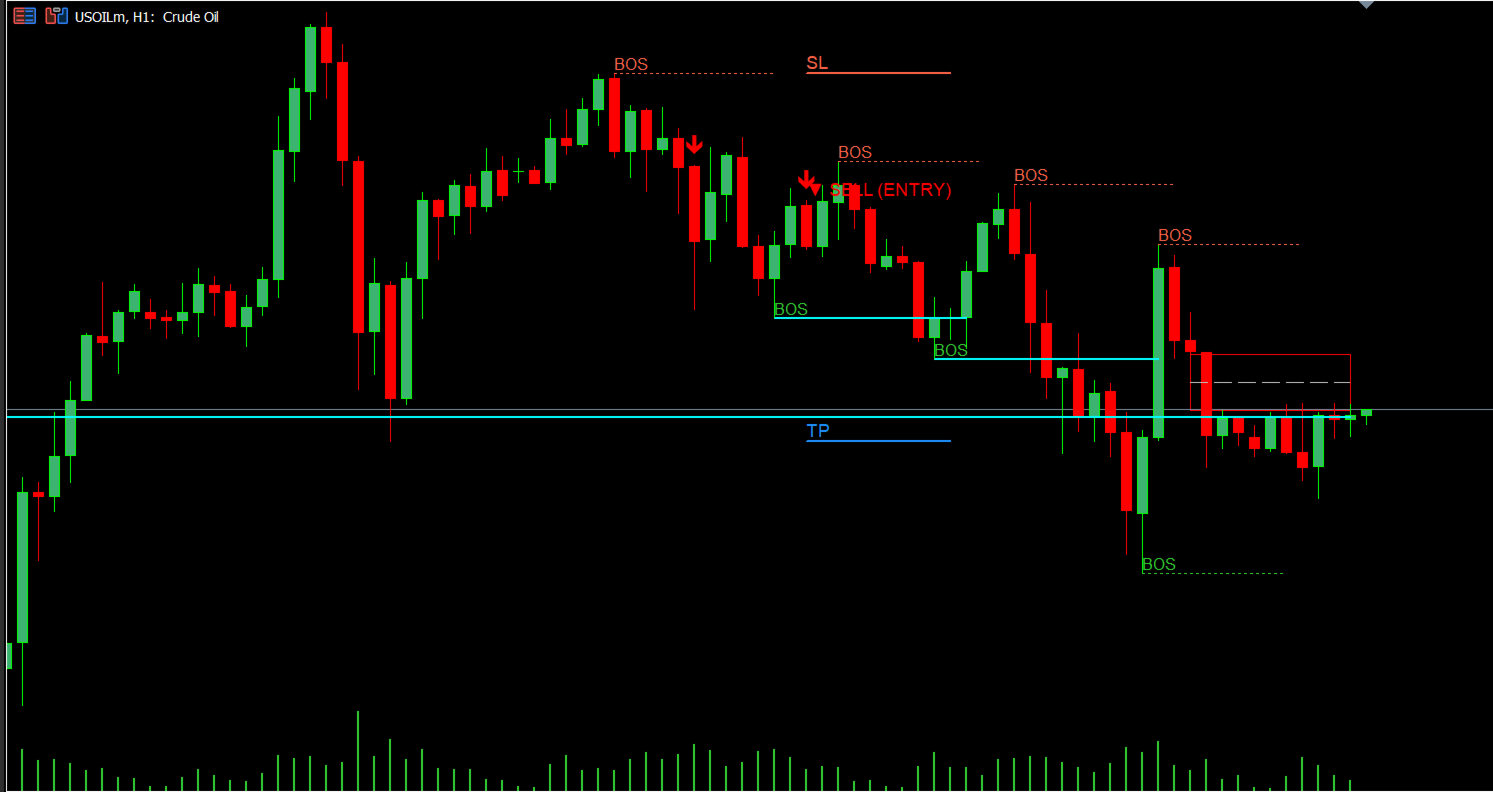
A lower value allows more setups to qualify. A higher value requires
stronger confirmation.
4. Higher-Timeframe Direction
Macro Direction default: 4 Hour (H4) Structure default: 15 Minute (M15)
The indicator therefore uses H4 for overall direction and M15 for market
structure. These timeframes can be changed.
5. Higher-Timeframe EMA Period
Default: 20
This applies to the selected H4 and M15 timeframes.
6. Major Swing Length
Default: 5
This controls how the indicator identifies major swing highs and swing
lows.
7. Minor Swing Length
Default: 2
Minor swings are used for shorter-term structure changes.
8. Important Swing Setting Rule
The Minor Swing Length must always be smaller than the Major Swing
Length.
9. Showing Only the Latest Signal
Default: ON
When enabled, the chart is kept clean by showing only the latest active
signal.
10. Maximum Active Zones
Default: 1
This controls the maximum number of active Fair Value Gap and Order
Block areas displayed.
11. Filling the Zones
Default: OFF
When OFF, zones are displayed as clean outlines. When ON, the rectangles
are filled.
12. Fair Value Gaps
Default: ON
SniperSmc can display Fair Value Gaps on the chart. Bullish and bearish
gaps are displayed separately. The indicator also tracks whether these
areas have been filled or mitigated.
13. Bullish Fair Value Gap Color
Default: Lime
14. Bearish Fair Value Gap Color
Default: Red
15. Order Blocks
Default: OFF
SniperSmc can display Order Blocks. If enabled, bullish and bearish
Order Block areas can be shown and monitored for mitigation.
16. Bullish Order Block Color
Default: Deep Sky Blue
17. Bearish Order Block Color
Default: Magenta
18. BOS and CHoCH Display
Default: ON
The indicator can display BOS (Break of Structure) and CHoCH (Change of
Character) markings.
19. Understanding BOS
BOS means Break of Structure. It indicates that price has broken an
important previous swing level.
20. Understanding CHoCH
CHoCH means Change of Character. It is used when the identified swing
relationship suggests a change in the previous market structure.
21. Fibonacci Golden Zone
Default: ON
The indicator can display a Fibonacci retracement area known as the
Golden Zone.
22. Fibonacci Extension Targets
Default: ON
The indicator can display Fibonacci extension levels including 1.272 and
1.618.
23. Support and Resistance
Default: OFF
SniperSmc can display support and resistance lines.
24. Volume Profile POC
Default: OFF
The indicator can display the Point of Control, or POC, from its
volume-profile calculation.
25. Volume Profile Sections
Default: 50
The indicator uses 50 sections for its volume-profile calculation.
26. CVD Confirmation
Default: ON
SniperSmc can use live tick-based CVD information as part of its signal
confirmation.
27. CVD Confirmation Threshold
Default: 100
This is the minimum CVD difference used for confirmation.
28. Spread Protection
Default: 20 points
The indicator checks the current spread before allowing a setup to be
displayed. If the spread is above the maximum value selected, the setup
is not displayed.
29. Trading Session
Default Start: 07:00 Default End: 18:00
The times are based on broker time.
30. Changing the Trading Session
You can change the Session Start Hour and Session End Hour.
31. Session Setting Rule
The start time must be earlier than the end time.
32. Historical Chart Information
The indicator processes historical candles so that previous market
structures, zones and signals can be displayed.
Default historical processing limit: 500 bars.
33. Removing Old Chart Markings
Default: 50 bars
Objects older than the selected number of bars can be cleaned from the
chart.
34. Buy Signals
When the indicator identifies a valid Buy setup that reaches the
required conditions, it places a Buy arrow on the chart and calculates
the appropriate entry price.
35. Sell Signals
When the indicator identifies a valid Sell setup that reaches the
required conditions, it places a Sell arrow on the chart and calculates
the appropriate entry price.
36. Entry Price
SniperSmc calculates an entry price based on the detected setup. The
entry can be associated with the appropriate order type for that setup.
37. Order Type
The indicator is designed to identify the appropriate native order class
for the detected setup, including immediate market entry and
pending-order classes when applicable.
38. Buy Limit
A Buy Limit is used when the intended Buy entry is below the current
market price.
39. Sell Limit
A Sell Limit is used when the intended Sell entry is above the current
market price.
40. Buy Stop
A Buy Stop is used when the intended Buy entry is above the current
market price.
41. Sell Stop
A Sell Stop is used when the intended Sell entry is below the current
market price.
42. No Automatic Change of Order Type
If a pending setup is invalid at the calculated price, it is not simply
converted into another order type. The setup is not displayed.
43. Current Market Price
For the current signal area, the indicator attempts to use the live Bid
and Ask prices. For historical candles, it uses candle price together
with recorded spread to create a consistent reference.
44. EMA Lines
The indicator can display three EMA lines: - EMA 200 - EMA 50 - EMA 21
45. EMA 200
Default: 200
46. EMA 50
Default: 50
47. EMA 21
Default: 21
48. Turning EMA Lines Off
Setting: Show EMA Lines Default: ON
49. Alerts
Default: ON
The indicator can display an on-screen alert when a signal is generated.
50. Mobile Push Notifications
Default: ON
SniperSmc can send push notifications through MetaTrader 5 when the
required notification settings are configured.
51. Email Notifications
Default: OFF
The indicator can also send email notifications when MetaTrader email
settings are configured.
52. Recommended Basic Setup
The file’s default configuration provides: - Minimum score: 14 - Macro
timeframe: H4 - Structure timeframe: M15 - Major swing length: 5 - Minor
swing length: 2 - Latest signal only: ON - Maximum active zones: 1 -
Fair Value Gaps: ON - Order Blocks: OFF - BOS/CHoCH: ON - Fibonacci
Golden Zone: ON - Fibonacci extensions: ON - Support/resistance: OFF -
POC: OFF - CVD: ON - CVD threshold: 100 - Maximum spread: 20 points -
Session: 07:00–18:00 broker time - Historical processing: 500 bars -
Alerts: ON - Push notifications: ON - Email: OFF - EMA lines: ON - EMA
200: 200 - EMA 50: 50 - EMA 21: 21
53. How to Read a Buy Signal
When you see a Buy arrow: 1. Look at the candle where the signal
appeared. 2. Look at the displayed entry price. 3. Check which order
type is indicated. 4. Look at the nearby market structure. 5. Check the
Fair Value Gap or other visible areas. 6. Check the higher-timeframe
direction. 7. Check the spread. 8. Make sure the entry is still relevant
before placing a trade.
54. How to Read a Sell Signal
When you see a Sell arrow: 1. Look at the signal candle. 2. Check the
displayed entry price. 3. Check the indicated order type. 4. Examine the
nearby structure. 5. Look for relevant Fair Value Gaps or other
displayed areas. 6. Check the higher-timeframe direction. 7. Check the
current spread. 8. Confirm that the setup is still relevant before
entering.
55. Why a Signal May Not Appear
A setup may fail to produce a signal because the score is below the
minimum, the spread is too high, it is outside the selected trading
session, required market structure is not present, the order price fails
the entry check, the pending-order relationship is invalid, there is not
enough historical information, or the market has not produced the
required setup.
56. Why an Old Zone Disappears
Fair Value Gaps and Order Blocks are monitored after they appear. When
price reaches the relevant area and the zone is considered mitigated,
the indicator removes that active zone from the chart.
57. What the Indicator Shows on the Chart
Depending on your settings, the chart can contain: - Buy arrows - Sell
arrows - Entry information - Fair Value Gaps - Fair Value Gap midpoint
information - Order Blocks - BOS markings - CHoCH markings - Fibonacci
retracement - Fibonacci extension levels - Support/resistance -
Volume-profile POC - EMA 200 - EMA 50 - EMA 21
58. Keeping the Chart Clean
For a cleaner chart, useful settings include: - Only Latest Signal =
ON - Maximum Active Zones = 1 - Fill Zones = OFF - Order Blocks = OFF -
Support/Resistance = OFF - POC = OFF
59. If You Want More Market Information
You can turn on: - Order Blocks - Support/Resistance - POC - More active
zones
This gives you more information but can make the chart more crowded.
60. Understanding the Indicator’s Main Process
In simple terms: 1. It looks at the available market candles. 2. It
identifies important highs and lows. 3. It studies market structure. 4.
It looks for Fair Value Gaps and other important price areas. 5. It
checks liquidity activity. 6. It considers higher-timeframe direction.
7. It considers volume and CVD information when enabled. 8. It checks
the trading session. 9. It checks the spread. 10. It calculates the
setup score. 11. If the setup reaches the required score, it determines
the appropriate entry. 12. It checks whether that entry is valid. 13. If
the entry is valid, the Buy or Sell signal is displayed.
61. What SniperSmc Does Not Do
SniperSmc is an indicator. It does not automatically open a market trade
simply because an arrow appears.
62. Important Point About Signals
A signal is a market setup, not a guarantee. A Buy signal means the
indicator found conditions that met its selected requirements. A Sell
signal means the indicator found conditions that met its selected
requirements.
63. Beginner Glossary
Buy — A trade expecting price to rise. Sell — A trade expecting price to
fall. Buy Limit — A Buy entry below the current market price. Sell Limit
— A Sell entry above the current market price. Buy Stop — A Buy entry
above the current market price. Sell Stop — A Sell entry below the
current market price. BOS — Break of Structure. CHoCH — Change of
Character. MSS — A shorter-term market-structure shift. FVG — Fair Value
Gap. IFVG — Inverse Fair Value Gap. OB — Order Block. CVD — Cumulative
Volume Delta. EMA — Exponential Moving Average. ATR — Average True
Range. POC — Point of Control. Spread — The difference between Bid and
Ask. Broker Time — The time used by your MetaTrader broker.
64. Simple Beginner Workflow
Before trading, check the correct symbol, timeframe, current spread, H4
direction, M15 structure, visible FVG, BOS/CHoCH, displayed entry, and
order type.
When a signal appears, do not immediately assume the trade must be
taken. First check whether the displayed entry is still relevant and
whether the market has already moved away from the setup.
When using pending orders, make sure the pending order is placed at the
exact entry price indicated by the indicator. Do not manually change a
Buy Limit into a Buy Stop or a Sell Limit into a Sell Stop simply
because the market moved.
65. Final Beginner Checklist
☐ Correct trading symbol is open. ☐ Indicator is running normally. ☐
Signal is recent. ☐ Buy or Sell direction is clear. ☐ Displayed entry
price is visible. ☐ Indicated order type is understood. ☐ Spread is
acceptable. ☐ H4 direction has been checked. ☐ M15 structure has been
checked. ☐ Nearby FVG/structure areas have been checked. ☐ Trading
session is active. ☐ You understand whether the entry is immediate or
pending. ☐ You have decided where your Stop Loss and Take Profit should
be. ☐ You understand that the indicator does not guarantee a winning
trade.
66. In Simple Words
SniperSmc is designed to help you find structured Buy and Sell
opportunities.
It combines higher-timeframe direction, market structure, Smart Money
Concept information, price gaps, liquidity information, volume/CVD
information and other confirmations.
When enough conditions come together, it displays a signal and the
corresponding entry information.
The most important things for a beginner to understand are:
Direction → Structure → Confirmation → Score → Entry → Order Type