Fibo And ZigZag

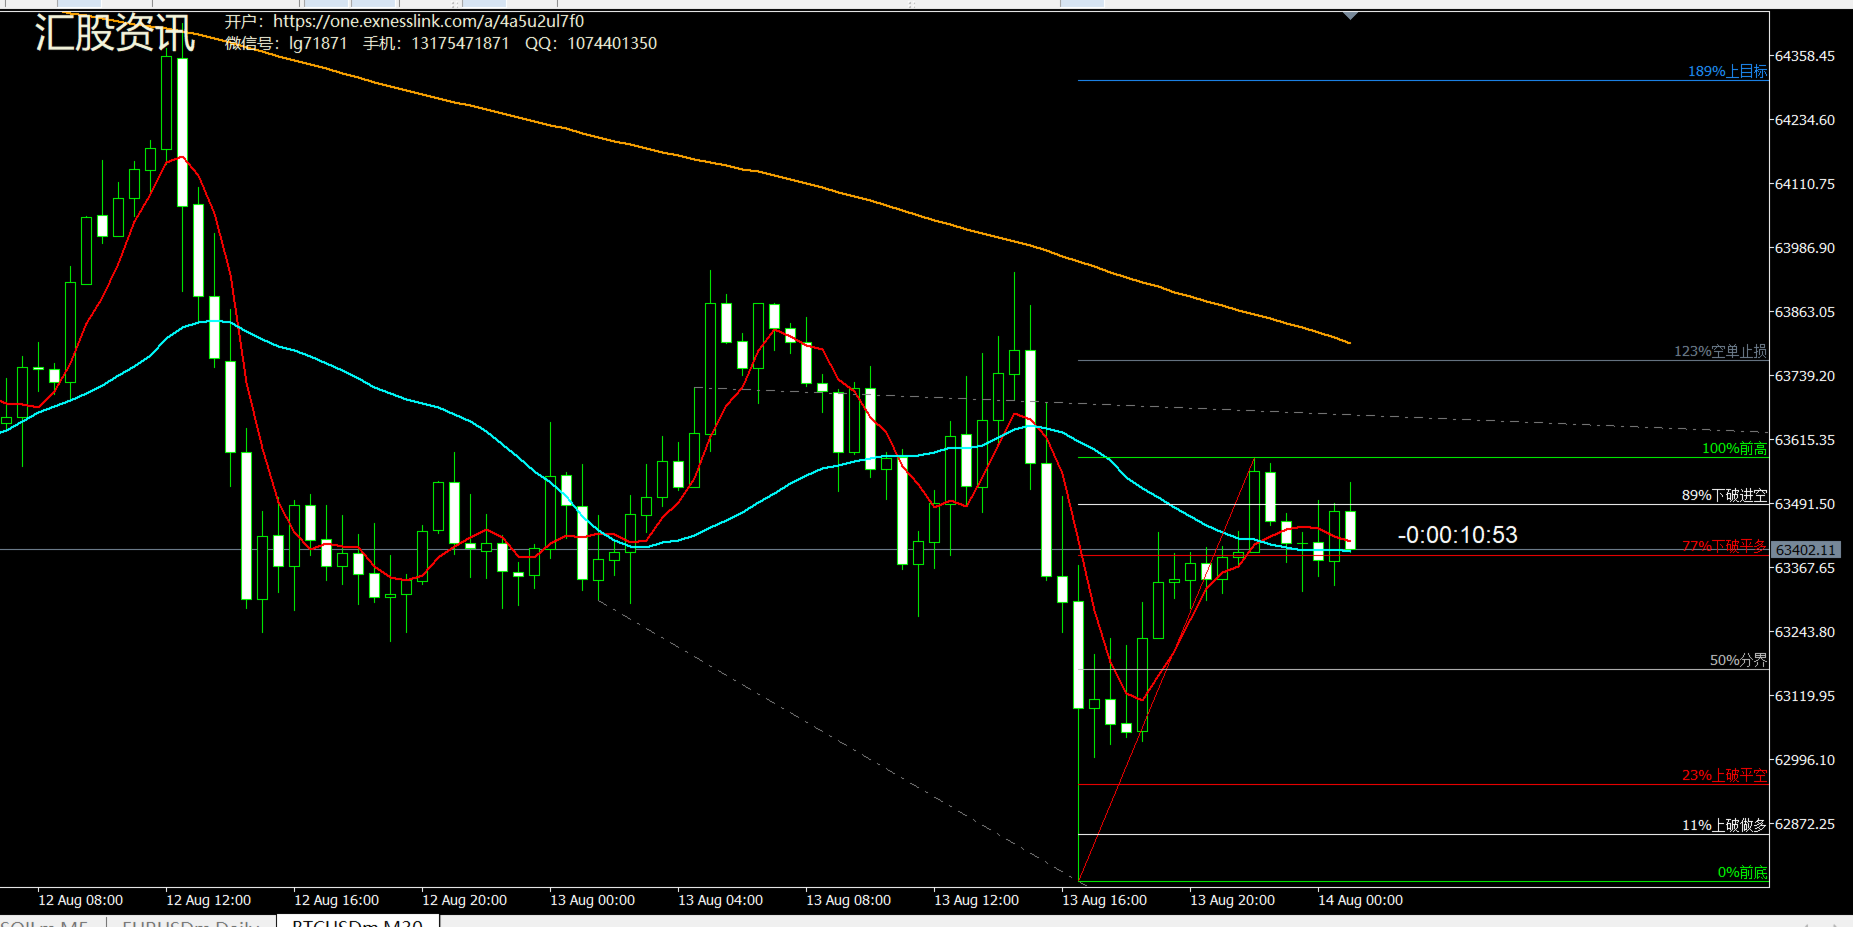
此指标组合了三根MA(5,26,180)移动平均线,倒计时显示,趋势线,和在ZigZag基础上的修改版的斐波那契扩展线,使得画面一个指标展现多重技术画线。你可以根据三根移动均线判断阻力支撑和价格运动空间,利用趋势线判断价格运动方向,利用fibo线预测未来可能的目标,如果再结合多周期分析,你就能精准分析预测市场走向。是一款绝对好用的技术指标。

//+------------------------------------------------------------------+
//|                                                  Z字新指标_均线版.mq5
//|                                            Converted from MQL4 to MQL5
//+------------------------------------------------------------------+
#property copyright "汇股资讯·投资李哥"
#property link "https://one.exness-track.com/a/4a5u2ul7f0"
#property version "1.00"
#property indicator_chart_window

// 缓冲区总数(含计算缓冲区)
#property indicator_buffers 19
// 可视化图形数量
#property indicator_plots  17

//--- Plot 0: Zigzag
#property indicator_label1  "Zigzag"
#property indicator_type1   DRAW_NONE
#property indicator_color1  clrGreen

//--- Plot 1: 极限上
#property indicator_label2  "极限上"
#property indicator_type2   DRAW_NONE
#property indicator_color2  clrGreen

//--- Plot 2: 目标上
#property indicator_label3  "目标上"
#property indicator_type3   DRAW_NONE
#property indicator_color3  clrGreen

//--- Plot 3: 空单止损
#property indicator_label4  "空单止损"
#property indicator_type4   DRAW_NONE
#property indicator_color4  clrGreen

//--- Plot 4: 前高
#property indicator_label5  "前高"
#property indicator_type5   DRAW_NONE
#property indicator_color5  clrGreen

//--- Plot 5: 下破进空
#property indicator_label6  "下破进空"
#property indicator_type6   DRAW_NONE
#property indicator_color6  clrGreen

//--- Plot 6: 下破平多
#property indicator_label7  "下破平多"
#property indicator_type7   DRAW_NONE
#property indicator_color7  clrGreen

//--- Plot 7: 分界
#property indicator_label8  "分界"
#property indicator_type8   DRAW_NONE
#property indicator_color8  clrGreen

//--- Plot 8: 上破平空
#property indicator_label9  "上破平空"
#property indicator_type9   DRAW_NONE
#property indicator_color9  clrGreen

//--- Plot 9: 上破做多
#property indicator_label10 "上破做多"
#property indicator_type10  DRAW_NONE
#property indicator_color10 clrGreen

//--- Plot 10: 前底
#property indicator_label11 "前底"
#property indicator_type11  DRAW_NONE
#property indicator_color11 clrGreen

//--- Plot 11: 多单止损
#property indicator_label12 "多单止损"
#property indicator_type12  DRAW_NONE
#property indicator_color12 clrGreen

//--- Plot 12: 目标下
#property indicator_label13 "目标下"
#property indicator_type13  DRAW_NONE
#property indicator_color13 clrGreen

//--- Plot 13: 极限下
#property indicator_label14 "极限下"
#property indicator_type14  DRAW_NONE
#property indicator_color14 clrGreen

//--- Plot 14: MA5
#property indicator_label15 "MA5"
#property indicator_type15  DRAW_LINE
#property indicator_style15 STYLE_SOLID
#property indicator_width15 2
#property indicator_color15 clrRed

//--- Plot 15: MA26
#property indicator_label16 "MA26"
#property indicator_type16  DRAW_LINE
#property indicator_style16 STYLE_SOLID
#property indicator_width16 2
#property indicator_color16 clrCyan

//--- Plot 16: MA180
#property indicator_label17 "MA180"
#property indicator_type17  DRAW_LINE
#property indicator_style17 STYLE_SOLID
#property indicator_width17 2
#property indicator_color17 clrOrange

//--- 参数
input int InpDepth = 12;
input int InpDeviation = 5;
input int InpBackstep = 3;
input int RequiredWaveHeight=40;//波浪高度
input int MA_value1=5;
input int MA_value2=26;
input int MA_value3=180;
input int MA_Width=2;

input color Resistance_Color=clrGray;
input ENUM_LINE_STYLE Resistance_Style=STYLE_DASHDOT;
input int Resistance_Width=1;
input color Support_Color=clrGray;
input ENUM_LINE_STYLE Support_Style=STYLE_DASHDOT;
input int Support_Width=1;
input ENUM_TIMEFRAMES ZigFT=PERIOD_CURRENT;
input color Countdown_Color=clrWhite;

//--- 指标缓冲区(可视化)
double ExtZigzagBuffer[];
double buffer1[],buffer2[],buffer3[],buffer4[],buffer5[],buffer6[],buffer7[];
double buffer8[],buffer9[],buffer10[],buffer11[],buffer12[],buffer13[];
double MA5_Buffer[];
double MA26_Buffer[];
double MA180_Buffer[];

//--- 计算缓冲区(不可见)
double ExtHighBuffer[];
double ExtLowBuffer[];

//--- 普通数组
double LowerPrice_1_m15[];
double LowerPrice_2_m15[];
double UpperPrice_1_m15[];
double UpperPrice_2_m15[];
int Lower_1_m15[];
int Lower_2_m15[];
int Upper_1_m15[];
int Upper_2_m15[];
int ExtLevel=3;
bool downloadhistory = false;

enum DisplayPosition
  {
   CommentDisplay = 0, // 显示在评论栏
   ChartCorner = 1,    // 显示在图表角落
   NearPrice = 2,      // 显示在价格附近
  };
input DisplayPosition InpTimerPosition = NearPrice;      // 显示位置
input color InpTextColor = clrWhite;                     // 文字颜色
input int InpFontSize = 12;                              // 字号
input ENUM_ANCHOR_POINT InpAnchorPoint = ANCHOR_LEFT_LOWER; // 锚点
input ENUM_BASE_CORNER InpCornerPosition = CORNER_LEFT_LOWER; // 角落位置(仅ChartCorner模式)
input int OffsetKlines = 3;                             // 右移K线根数(NearPrice模式)
input int OffsetPoints = 30; 
string countdownLabel = "倒计时";  
//--- MA 和 ZigZag 指标句柄
int ma5_handle = INVALID_HANDLE;
int ma26_handle = INVALID_HANDLE;
int ma180_handle = INVALID_HANDLE;
int zigzag_handle = INVALID_HANDLE;

Produits recommandés
Matreshka
Dimitr Trifonov
5 (2)
Matreshka self-testing and self-optimizing indicator: 1. Is an interpretation of the Elliott Wave Analysis Theory. 2. Based on the principle of the indicator type ZigZag, and the waves are based on the principle of interpretation of the theory of DeMark. 3. Filters waves in length and height. 4. Draws up to six levels of ZigZag at the same time, tracking waves of different orders. 5. Marks Pulsed and Recoil Waves. 6. Draws arrows to open positions 7. Draws three channels. 8. Notes support and re
The Expert Advisor and the video are attached in the Discussion tab . The robot applies only one order and strictly follows the signals to evaluate the indicator efficiency. Pan PrizMA CD Phase is an option based on the Pan PrizMA indicator. Details (in Russian). Averaging by a quadric-quartic polynomial increases the smoothness of lines, adds momentum and rhythm. Extrapolation by the sinusoid function near a constant allows adjusting the delay or lead of signals. The value of the phase - wave s
Elliott Wave Trend was designed for the scientific wave counting. This tool focuses to get rid of the vagueness of the classic Elliott Wave Counting using the guideline from the template and pattern approach. In doing so, firstly Elliott Wave Trend offers the template for your wave counting. Secondly, it offers Wave Structural Score to assist to identify accurate wave formation. It offers both impulse wave Structural Score and corrective wave Structure Score. Structural Score is the rating to sh
Introduction to X3 Chart Pattern Scanner X3 Cherart Pattern Scanner is the non-repainting and non-lagging indicator detecting X3 chart patterns including Harmonic pattern, Elliott Wave pattern, X3 patterns, and Japanese Candlestick patterns. Historical patterns match with signal patterns. Hence, you can readily develop the solid trading strategy in your chart. More importantly, this superb pattern scanner can detect the optimal pattern of its kind. In addition, you can switch on and off individu
AMD Nexus Prime - Market Structure & Liquidity Indicator AMD Nexus Prime is a professional market structure indicator for MetaTrader designed to identify and visualize Accumulation, Manipulation, and Distribution (AMD) sequences directly on the chart.  The indicator processes confirmed bars, tracks range development, detects liquidity sweeps, and builds a reference trade model when a Distribution phase is confirmed.  Note: This is an analysis tool only. It does not open, modify, or close trad
Overview Harmonic Patterns MT5 is a technical analysis indicator designed for the MetaTrader 5 platform. It identifies and displays harmonic price patterns, such as Butterfly, Cypher, Crab, Bat, Shark, and Gartley, in both bullish and bearish directions. The indicator calculates key price levels, including entry, stop loss, and three take-profit levels, to assist traders in analyzing market movements. Visual elements and customizable alerts enhance usability on the chart. Features Detects six ha
All Harmonics 26 demo
Alexey Isavnin
4.25 (4)
This is the demo version of "All Harmonics 26" indicator . "All Harmonics 26" searches for 26 types of harmonic patterns and outputs them in a convenient way. You can check out the documentation here . This demo version has the following limitations: The indicator searches only for one type of harmonic patterns out of 26:- Gartley. The indicator outputs new patterns with a lag of 10 bars.
FREE
Filigrane de graphique style TradingView Transformez vos graphiques MetaTrader 5 pour qu'ils soient aussi élégants et professionnels que sur TradingView. Êtes-vous fatigué de l'aspect par défaut et simpliste de MetaTrader ? WaterMark MT5 est un indicateur léger et entièrement personnalisable conçu pour améliorer votre expérience de cartographie en ajoutant des filigranes élégants et modernes directement dans votre terminal de trading. Cet indicateur comble le fossé visuel entre les graphiques Me
FREE
Key level wedge MT5
Presley Annais Tatenda Meck
The   Key level wedge MT5   indicator automatically draws rising wedge pattern and falling wedge pattern for you on the chart. This pattern is really good when used as a confirmation entry at key support & resistance, supply & demand and reversal zones. Advantages  The   Key level wedge MT5   block DOES NOT RE-PAINT, giving you confidence when a signal appears and also helps when looking back.  The   Key level wedge MT5   includes an on/off button on the chart to easily keep the charts clean
Wave Volume Structure
Ahmed Hamed Hamed Eadwan
Wave Volume Structure Wave Volume Structure est un indicateur MetaTrader 5 qui affiche la structure de marché, les vagues ZigZag, le volume relatif des vagues, les zones d'offre et de demande, ainsi que des flèches optionnelles de retournement. Son tableau de bord combine les lectures du graphique avec des vues sur plusieurs unités de temps et plusieurs symboles. Il s'agit d'un outil d'analyse et de visualisation. Il ne passe aucun ordre, ne gère aucune position et ne garantit aucun résultat de
Détecteur intelligent multicouche de cassure et de retracement pour MetaTrader 5 « Intelligent. Simple. Rapide ! » Vous en avez assez de rater des entrées sur cassure à haute probabilité ? Passez-vous des heures à analyser de nombreux graphiques pour aligner les cassures avec la direction de la tendance et le momentum des devises — pour finalement manquer le mouvement ? Break Pullback résout tout cela en un seul indicateur. Qu'est-ce que Break Pullback ? Break Pullback est un indicateur MetaTr
Basic Harmonic Pattern MT5
Mehran Sepah Mansoor
4.78 (98)
Cet indicateur identifie les   modèles harmoniques   les plus populaires qui prédisent les points d'inversion du marché. Ces modèles harmoniques sont des formations de prix qui se répètent constamment sur le marché des changes et suggèrent des mouvements de prix futurs possibles /   Version MT4 gratuite En outre, cet indicateur dispose d'un signal d'entrée sur le marché intégré, ainsi que de différents take profits et stop losses. Il convient de noter que, bien que l'indicateur de configuratio
FREE
Trade smarter, not harder: Empower your trading with Harmonacci Patterns This is arguably the most complete harmonic price formation auto-recognition indicator you can find for the MetaTrader Platform. It detects 19 different patterns, takes fibonacci projections as seriously as you do, displays the Potential Reversal Zone (PRZ) and finds suitable stop-loss and take-profit levels. [ Installation Guide | Update Guide | Troubleshooting | FAQ | All Products  ] It detects 19 different harmonic pric
Harmonic Patterns Osw MT5
William Oswaldo Mayorga Urduy
Manuel d'utilisation : Harmonic Patterns OSW MT5 1. Introduction et objectif Harmonic Patterns OSW est un outil d'analyse algorithmique avancé conçu pour détecter automatiquement les structures géométriques des prix basées sur les niveaux de Fibonacci. L'indicateur utilise un moteur de recherche associé à l'algorithme ZigZag pour filtrer le bruit du marché et localiser les zones à forte probabilité de retournement des prix. Son objectif est d'identifier des figures telles que Gartley, Bat, But
This indicator looks for 3 rather strong patterns: Spinning Top pattern Hammer or Hanging Man Inverted Hammer or Shooting Star These patterns may indicate a trend continuation or its reversal, depending on the location of the patterns. Input parameters Distance - distance between the signal and the formed signal Note: the higher the timeframe, the greater the value should be used in Distance to display the signal correctly Indicator Features Suitable for any currency pair Operating timeframe:
FREE
PZ Penta O MT5
PZ TRADING SLU
3.8 (5)
The Penta-O is a 6-point retracement harmonacci pattern which usually precedes big market movements. Penta-O patterns can expand and repaint quite a bit. To make things easier this indicator implements a twist: it waits for a donchian breakout in the right direction before signaling the trade. The end result is an otherwise repainting indicator with a very reliable trading signal. The donchian breakout period is entered as an input. [ Installation Guide | Update Guide | Troubleshooting | FAQ | A
FREE
WAPV Weis Wave Chart Forex
Eduardo Da Costa Custodio Santos
Le Weis Wave Chart Forex pour MT5 est un indicateur de prix et de volume. La lecture du prix et du volume a été largement diffusée par Richard Demille Wyckoff sur la base des trois lois qu'il a créées : l'offre et la demande, la cause et l'effet et l'effort contre le résultat. En 1900 R.Wyckoff utilisait déjà le wave chart dans ses analyses. De nombreuses années plus tard, vers 1990, David Weis a automatisé le diagramme d'onde de R. Wyckoff et aujourd'hui nous vous apportons l'évolution du diagr
Bullish Consecutive Signal — Consecutive Bullish Candle Buy Signal with Alerts & P&L Simulation Bullish Consecutive Signal automatically detects consecutive bullish candle patterns and marks high-probability buy entries directly on the chart. Each signal comes with an ATR-calculated Stop Loss and Take Profit level, drawn as reference lines so you can assess risk at a glance. A built-in P&L back-simulation lets you evaluate strategy performance without leaving the chart.   IMPORTANT — DEFAULT
FREE
Introduction This indicator detects volume spread patterns for buy and sell opportunity. The patterns include demand and supply patterns. You might use each pattern for trading. However, these patterns are best used to detect the demand zone (=accumulation area) and supply zone (=distribution area). Demand pattern indicates generally potential buying opportunity. Supply pattern indicates generally potential selling opportunity. These are the underlying patterns rather than direct price action. T
FREE
OrderFlow Supply and Demand Pro: Institutional Liquidity Engine The OrderFlow Supply and Demand Pro is a high-performance analytical engine designed to pinpoint institutional footprint on your charts. By combining algorithmic price action filters with a real-time pressure engine, this tool identifies high-probability liquidity zones where large-scale market participants are likely to re-enter the market. Core Institutional Logic Our proprietary detection system filters out market "noise" by enfo
Apex Point
Marco Engstermann
Apex Point is a trend-following indicator for MetaTrader 5, transforming complex market data into signals for traders. It displays blue dots for uptrends, red dots for downtrends, and yellow crosses at potential reversals, helping users identify momentum shifts quickly. Key features include a confirmation system requiring multiple bars (default: 3) to validate changes, reducing false signals; dynamic ATR-based offsets for adaptive trailing, with instant ratcheting in the trend direction and smo

FREE
Phantom Edge SMC
Nattapon Chuekamhod
Phantom Edge SMC — The Ultimate Smart Money Indicator for MT5 Tired of manually drawing structures while trading SMC or ICT concepts? Let Phantom Edge SMC do the heavy lifting for you. Key Features Internal & Swing Structure: Automatically detects BOS and CHoCH across two structural levels. Order Blocks (OB): Identifies Internal and Swing OBs with automated mitigation tracking. Equal Highs / Lows: Highlights EQH / EQL to pinpoint Liquidity pools. Fair Value Gaps (FVG): Displays FVGs with
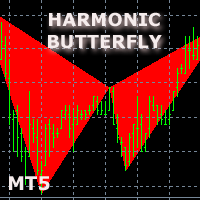
The indicator detects and displays М. Gartley's Butterfly pattern. The pattern is plotted by the extreme values of the ZigZag indicator (included in the resources, no need to install). After detecting the pattern, the indicator notifies of that by the pop-up window, a mobile notification and an email. The pattern and wave parameters are displayed on the screenshots. The default parameters are used for demonstration purposes only in order to increase the amount of detected patterns. Parameters z
Enhanced Volume Profile: The Ultimate Order Flow & Liquidity Analysis Tool Overview Enhanced Volume Profile is an indicator for MetaTrader 5 that displays the traded volume at specific price levels over a defined period. It separates the total volume into buy and sell components, presenting them as a side-by-side histogram on the chart. This allows users to observe the volume distribution and the proportion of buy and sell volumes at each price level. Graphics Rendering The indicator uses the
FREE
MercariaPattern1-2-3 відстежує рух ціни, знаходить трьоххвильові структури 1-2-3 та підсвічує момент, коли сценарій підтверджується пробоєм ключового рівня. MercariaPattern1-2-3 tracks price movement, detects three-leg 1-2-3 structures and highlights the moment when the scenario is confirmed by a key level breakout. Індикатор збирає локальні свінги в компактну фігуру 0–1–2–3 , чекає підтвердженого пробою та будує стрілку входу з готовими рівнями SL/TP. The indicator combines local swings into a
Hunttern ZigZag MT5
Hassan Gh Fakhraei
5 (1)
Hunt markets with Hunttern ZigZag . Easy to use with one parameter    You can use it for the following:       -Classic patterns       -Heads and shoulders       -Harmonic patterns       -Elliott Wave       -Support and resistance       -Supply and Demand Single parameter:      -Period (1-120) Features:        -Candle time        -Single parameter        -Light mode template This is version 1 of Hunttern ZigZag. We are very happy to receive feedback from you.
FREE
Zone Structure Scanner Panel for MT5 Find better setups faster — without scanning charts for hours. The Zone Structure Scanner Panel for MT5 helps you automatically scan multiple symbols, detect key weekly and daily support/resistance zones, read market structure, highlight confluence, and flag H4 rejection-confirmed setups from one powerful panel. Instead of jumping from chart to chart, you get ranked opportunities in one place so you can focus on the setups that matter most. Why it stands
STRBTV Pro MTF — Detailed Description STRBTV stands for "Sell The Rally, Buy The Valley" — an MT5 indicator (v2.10, by Marian Beceanu) built around multi-timeframe MACD convergence/divergence , with a "sniper entry" logic based on Support/Resistance and a built-in risk-management dashboard. General Concept The indicator works on two levels: Higher timeframe (HTF) — looks for convergence between price and MACD on the swing highs/lows of that timeframe. A confirmed HTF convergence is treated as t
Harmonic Pattern Hunter
Shingidzano Lesetedi
5 (1)
Harmonic Pattern Hunter Harmonic Pattern Hunter is a technical indicator for MetaTrader 5 that automatically identifies and draws high-probability harmonic patterns directly on the chart. It is designed to assist traders who use harmonic analysis as part of their trading methodology. How It Works The indicator scans historical and live price data for completed XABCD harmonic structures using Fibonacci ratio validation. When a valid pattern is detected, it draws the full pattern geometry, marks t
Fibo Pivot Optimus
Syamsurizal Dimjati
5 (1)
Ritz Smart FIBOPIVOT Optimus Pro Advanced Multi-Timeframe Fibonacci Trading System SMART PREDICTION & ACCURATE FORECAST Revolutionary Fibonacci Pivot Technology combines traditional pivot points with advanced Fibonacci extensions, creating a powerful predictive tool for professional traders. Our algorithm intelligently detects significant price levels across multiple timeframes, delivering laser-accurate support and resistance zones before the market moves . INTELLIGENT VOLUME-VALIDATED SIGNALS
FREE
Les acheteurs de ce produit ont également acheté
Boba Analysis Suite
Trade Ready Solutions LLC
5 (1)
Boba Analysis Suite Boba Analysis Suite est un indicateur d’analyse pour MetaTrader 5. Il réunit la structure du marché, les zones de prix pertinentes et le contexte général du marché dans une même vue graphique. Développé à partir de l’expérience pratique d’un trader et formateur en trading, il accompagne une démarche d’analyse structurée : évaluer la direction du marché, identifier les niveaux importants et analyser plusieurs unités de temps conjointement. Une analyse en contexte La significat
ARIPoint
Temirlan Kdyrkhan
1 (4)
ARIPoint is a powerful trading companion designed to generate high-probability entry signals with dynamic TP/SL/DP levels based on volatility. Built-in performance tracking shows win/loss stats, PP1/PP2 hits, and success rates all updated live. Key Features: Buy/Sell signals with adaptive volatility bands Real-time TP/SL/DP levels based on ATR Built-in MA Filter with optional ATR/StdDev volatility Performance stats panel (Success, Profit/Loss, PP1/PP2) Alerts via popup, sound, push, or email Cu
AriFocus
Temirlan Kdyrkhan
AriFocus - Non-Repainting Buy/Sell Signals AriFocus - one clear signal. AriFocus marks buy and sell signals directly on the chart and suggests a stop-loss level for each one. Every signal is confirmed on bar close and never repaints. - Buy/sell arrows, confirmed on bar close - Suggested stop-loss level for every signal - Trend band and candle coloring to show direction at a glance - 10 ready-made presets, or your own settings (14 calculation methods) - Pop-up, push and email alerts with entr
ARICoins
Temirlan Kdyrkhan
ARICoin is a powerful trading companion designed to generate high-probability entry signals with dynamic TP/SL/DP levels based on volatility. Built-in performance tracking shows win/loss stats, PP1/PP2 hits, and success rates all updated live. Key Features: Buy/Sell signals with adaptive volatility bands Real-time TP/SL/DP levels based on ATR Built-in MA Filter with optional ATR/StdDev volatility Performance stats panel (Success, Profit/Loss, PP1/PP2) Alerts via popup, sound, push, or email Cust
Meravith Scanner
Ivan Stefanov
5 (3)
MERAVITH SCANNER est un indicateur professionnel pour les marchés financiers sur MetaTrader 5, qui regroupe plusieurs outils d’analyse en un seul système intégré. Il effectue tous les calculs automatiquement en utilisant une méthodologie propriétaire de prix moyen pondéré par le volume (VWAP), éliminant ainsi toute interprétation subjective. Cet indicateur fonctionne sur toutes les classes d’actifs (Forex, actions, indices, matières premières, cryptomonnaies) et sur toutes les périodes, de M1 au
TrendMaestro5
Stefano Frisetti
note: this indicator is for METATRADER4, if you want the version for METATRADER5 this is the link:  https://www.mql5.com/it/market/product/108106 TRENDMAESTRO ver 2.5 TRENDMAESTRO recognizes a new TREND from the start, he never makes mistakes. The certainty of identifying a new TREND is priceless. DESCRIPTION TRENDMAESTRO identifies a new TREND in the bud, this indicator examines the volatility, volumes and momentum to identify the moment in which there is an explosion of one or more of these da
Cycles Plotter
Edoardo Centorame
Cycles Plotter Indicateur de Cycles Personnalisables avec Moyennes Mobiles et Date de Début Le Cycles Plotter est un indicateur technique avancé qui trace deux cycles sinusoïdaux entièrement personnalisables, uniquement sur input de l’utilisateur. Il ne génère pas de cycles automatiquement: tous les cycles sont calculés exclusivement en fonction des paramètres définis par l’utilisateur, offrant aux traders un outil visuel pour étudier les oscillations de prix et les changements potentiels de ten
AriX
Temirlan Kdyrkhan
1 (4)
AriX Indicator for MT5 A powerful trend-following and signal-evaluation tool AriX is a custom MT5 indicator that combines Moving Averages and ATR-based risk/reward logic to generate clear buy/sell signals. It visualizes dynamic SL/TP levels, evaluates past trade outcomes, and displays win/loss statistics in a clean on-chart panel. Key features include: Buy/Sell signals based on MA crossovers ATR-based SL/TP1/TP2/TP3 levels with visual lines and labels Signal outcome tracking with real-time stat
Indicateur MT5 Voyez ce que le marché fait vraiment.   Visualisez les 3 phases de marché en direct devant vous (Contraction, Expansion, Tendance) et prenez de meilleures entrées dès le   début de la phase de Tendance.      Arrêtez de deviner. Commencez à lire le marché comme le font les institutions et le smart money.   Apex Market Structure Pro pour MT5 est un outil d'analyse smart-money de précision qui élimine le bruit et vous révèle la   véritable structure sous chaque bougie : liquidité
Title:FX-AIEA Supply and Demand Zone Indicator (MT5) — Technical Overview Version: 2.51 | Platform: MetaTrader 5 Introduction Supply and demand zones are considered a core manifestation of institutional order flow, providing a more direct reflection of buying and selling pressure than traditional support/resistance levels. This indicator attempts to automate the identification of high-probability supply and demand zones using an adaptive ZigZag algorithm, reducing the subjectivity and time asso
ORB Seeker MT5
Marcela Goncalves De Oliveira
Prix spécial pour limiter la disponibilité et maintenir la rareté du produit ! Seulement 599 $ ! Après votre achat, contactez-moi pour obtenir le bonus ORB Seeker EA et les fichiers de configuration optimisés personnalisés. Réussissez vos sessions de mixage en toute confiance ! ORB Seeker MT5 est un indicateur professionnel de cassure de la plage d'ouverture (ORB) conçu pour les traders qui recherchent précision, simplicité, flexibilité et une structure de graphique claire. Il trace automatiqu
Volume Arrow Signal Product Description Volume Arrow Signal is a smart trading indicator designed to help traders identify potential buy and sell opportunities using price action, volume behavior, and directional arrow signals. The indicator places clear arrows directly on the chart, making it easy to spot possible market reversals, trend continuations, and entry opportunities without spending hours analyzing charts manually. Whether you are trading Gold (XAUUSD) , Forex pairs, Indices, or Crypt
Gold Xausd Hunter
Metin Erkamoglu
5 (2)
MATADOR GOLD XAUUSD M5 Scalp Signals for MT5 MATADOR GOLD is a decision-support indicator for MetaTrader 5, designed for traders who analyze short-term Gold movement on the M5 timeframe. The indicator does not open, close, or manage trades automatically. It provides buy and sell signal guidance so the user can make their own trading decisions according to their risk plan, broker conditions, and trade management rules. Main purpose MATADOR GOLD is built to help traders avoid noisy signal flow and
KenKem Master Volume Profiler - Brief Introduction A Display-only volume-profile cockpit for XAUUSD, BTCUSD and other liquid symbols. Draws profile structure, multi-timeframe flow, EMA trend and study-only setup markers. Places no orders. Not a signal service.  It maps where the market has actually traded and reads recent order flow, so you can see structure and lean at a glance.  What it shows: Master and local volume profiles (POC and value-area high/low) - the price shelves that matter. A liv
VTrende Pro
Andrii Diachenko
5 (1)
VTrende Pro - MTF indicator for trend trading with a display panel for MT5 *** Videos can be translated into any language using subtitles (video language - Russian) Although the signals of the VTrende Pro indicator can be used as signals of a full-fledged trading system, it is recommended to use them in conjunction with the Bill Williams TS. VTrende Pro is an extended version of the VTrende indicator. Difference between Pro version and VTrende: - Time zones - Signal V - signal 1-2 waves -    S
En bref Cet indicateur combine deux experts — le RSI et le MACD — en un seul système. Au lieu de regarder deux graphiques séparés et de faire des suppositions, il prend la décision pour vous : lorsque les deux indicateurs sont d'accord, il dessine une flèche (achat ou vente). Le plus important : les flèches ne sont pas repeintes . Une fois apparues, elles restent là où elles sont. Vous pouvez backtester et trader en direct en toute confiance. Que signifie "Combo" Normalement, un trader regarde l
MasterTrend
Temirlan Kdyrkhan
MasterTrend Indicator for MT5 A powerful trend-following and signal-evaluation tool MasterTrend   is a custom MT5 indicator that combines Moving Averages and ATR-based risk/reward logic to generate clear buy/sell signals. It visualizes dynamic SL/TP levels, evaluates past trade outcomes, and displays win/loss statistics in a clean on-chart panel. Key features include: Buy/Sell signals based on MA crossovers ATR-based SL/TP1/TP2/TP3 levels with visual lines and labels Signal outcome tracking wit
SMC Sweep Fvg MT5
Daniil Sleptsov
5 (1)
SMC Sweep Fvg MT5 — voyez le marché comme le smart money, directement sur votre graphique Vous connaissez ce sentiment : le prix prend votre stop, se retourne et part exactement là où vous l’attendiez. Vous aviez raison sur la direction. Vous n’avez eu tort que sur l’entrée. Cet indicateur existe pour que cela arrive moins souvent. Il prend en charge la partie la plus lourde de l’analyse — le marquage du graphique — et vous laisse l’essentiel : la décision. Ce que vous voyez sur le graphique
PrimeScalping
Temirlan Kdyrkhan
PrimeScalping is a powerful trading companion designed to generate high-probability entry signals with dynamic TP/SL/DP levels based on volatility. Built-in performance tracking shows win/loss stats, PP1/PP2 hits, and success rates — all updated live. Key Features: Buy/Sell signals with adaptive volatility bands Real-time TP/SL/DP levels based on ATR Built-in MA Filter with optional ATR/StdDev volatility Performance stats panel (Success, Profit/Loss, PP1/PP2) Alerts via popup, sound, push, or e
Классификатор силы тренда. Показания на истории не меняет. Изменяется классификация только незакрытого бара. По идее подобен полной системе ASCTrend, сигнальный модуль которой, точнее его аппроксимация в несколько "урезанном" виде, есть в свободном доступе, а также в терминале как сигнальный индикатор SilverTrend . Точной копией системы ASCTrend не является. Работает на всех инструментах и всех временных диапазонах. Индикатор использует несколько некоррелируемых между собой алгоритмов для класси
FFx Universal Strength Meter PRO is more than a basic strength meter. Instead of limiting the calculation to price, it can be based on any of the 19 integrated strength modes + 9 timeframes. With the FFx USM, you are able to define any period for any combination of timeframes. For example, you can set the dashboard for the last 10 candles for M15-H1-H4… Full flexibility! Very easy to interpret... It gives a great idea about which currency is weak and which is strong, so you can find the best pai
The FFx Universal MTF alerter shows on a single chart all the timeframes (M1 to Monthly) with their own status for the chosen indicator. 9 indicators mode (MACD-RSI-Stochastic-MA-ADX-Ichimoku-Candles-CCI-PSAR). Each can be applied multiple times on the same chart with different settings. Very easy to interpret. Confirm your BUY entries when most of the timeframes are showing green color. And confirm your SELL entries when most of the timeframes are showing red color. 2 Alert Options : input to s
The FFx Watcher PRO is a dashboard displaying on a single chart the current direction of up to 15 standard indicators and up to 21 timeframes. It has 2 different modes: Watcher mode: Multi Indicators User is able to select up to 15 indicators to be displayed User is able to select up to 21 timeframes to be displayed Watcher mode: Multi Pairs User is able to select any number of pairs/symbols User is able to select up to 21 timeframes to be displayed This mode uses one of the standard indicators
FFx Patterns Alerter gives trade suggestions with Entry, Target 1, Target 2 and StopLoss .... for any of the selected patterns (PinBar, Engulfing, InsideBar, OutsideBar) Below are the different options available: Multiple instances can be applied on the same chart to monitor different patterns Entry suggestion - pips to be added over the break for the entry 3 different options to calculate the SL - by pips, by ATR multiplier or at the pattern High/Low 3 different options to calculate the 2 TPs -
MetaTrader 4 version available here : https://www.mql5.com/en/market/product/24881 FFx Basket Scanner is a global tool scanning all pairs and all timeframes over up to five indicators among the 16 available. You will clearly see which currencies to avoid trading and which ones to focus on. Once a currency goes into an extreme zone (e.g. 20/80%), you can trade the whole basket with great confidence. Another way to use it is to look at two currencies (weak vs strong) to find the best single pairs
MetaTrader 4 version available here: https://www.mql5.com/en/market/product/25793 FFx Pivot SR Suite PRO is a complete suite for support and resistance levels. Support and Resistance are the most used levels in all kinds of trading. Can be used to find reversal trend, to set targets and stop, etc. The indicator is fully flexible directly from the chart 4 periods to choose for the calculation: 4Hours, Daily, Weekly and Monthly 4 formulas to choose for the calculation: Classic, Camarilla, Fibonac
Le niveau Premium est un indicateur unique avec une précision de plus de 80 % des prédictions correctes ! Cet indicateur a été testé par les meilleurs Trading Specialists depuis plus de deux mois ! L'indicateur de l'auteur que vous ne trouverez nulle part ailleurs ! À partir des captures d'écran, vous pouvez constater par vous-même la précision de cet outil ! 1 est idéal pour le trading d'options binaires avec un délai d'expiration de 1 bougie. 2 fonctionne sur toutes les paires de devises
ClassicSBA
Umri Azkia Zulkarnaen
this indicator very simple and easy if you understand and agree with setup and rule basic teknical sba you can cek in link : please cek my youtube channel for detail chanel : an for detail info  contact me  basicly setup buy (long) for this indicator is Magenta- blue and green candle or magenta - green  and green candlestik and for setup sell (short) is Black - yellow - and red candle or black - red  and red candlestik
WanaScalper
Isaac Wanasolo
1 (1)
A scalping indicator based on mathematical patterns, which on average gives signals with relatively small SL, and also occasionally helps to catch big moves in the markets (more information in the video) This indicator has three main types of notifications: The first type warns of a possible/upcoming signal on the next bar The second type indicates the presence of a ready signal to enter the market/open a position The third type is for SL and TP levels - you will be notified every time price re
Индикатор Coefficient Of Determination (COD) представляет собой значение коэффициента детерминации или квадрат коэффициента корреляции между зависимой переменной — ценой и объясняющей переменной — тиковым объемом. Что это дает нам на практике? COD отлично распознает кульминацию трендовых движений, что позволяет подбирать оптимальные точки и ловить развороты рынка. Как использовать индикатор: Наиболее популярная торговая стратегия строится совместно с трендовым индикатором Moving Average (MA), пе
Filtrer:
Aucun avis
Répondre à l'avis