TG Ponto de Cobertura
- Indicateurs
- Version: 1.1
- Mise à jour: 21 février 2024

TG Ponto de Cobertura (Point d'Équilibre/Breakeven)
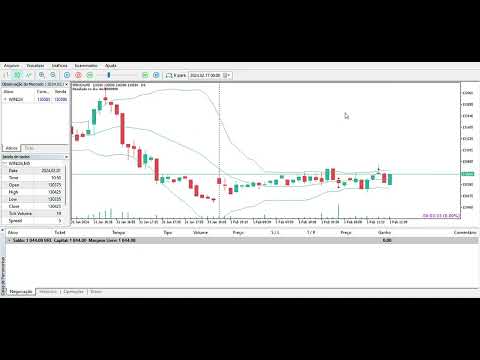
Cet indicateur analyse vos résultats de trading journaliers par rapport à l'actif affiché sur le graphique et ajoute une ligne au prix correspondant au point d'équilibre (point d'équilibre) de la position ouverte, en tenant compte du prix d'entrée et de la taille du lot. Le point d'équilibre sera recalculé après de nouvelles entrées, en fonction du prix moyen de l'opération ouverte et de la taille du lot.
Si le résultat journalier est nul, une ligne s'affichera au prix de la transaction en cours.
Si le résultat journalier est positif (profit), une ligne s'affichera dans le prix, indiquant le point d'équilibre de l'opération.
Si le résultat journalier est négatif (perte), une ligne s'affichera dans le prix, indiquant le point de recouvrement de l'opération.
Testé pour les comptes de type Netting
Veuillez noter cet indicateur et laisser un commentaire.