Regardez les tutoriels vidéo de Market sur YouTube
Comment acheter un robot de trading ou un indicateur
Exécutez votre EA sur
hébergement virtuel
hébergement virtuel
Test un indicateur/robot de trading avant d'acheter
Vous voulez gagner de l'argent sur Market ?
Comment présenter un produit pour qu'il se vende bien
Nouveaux utilitaires de trading pour MetaTrader 4 - 42

This is a very simple indicator that mixes the Sunday session with the Monday one. This is useful because the Sunday session is a partial session mostly with only Australian and Asian sessions included, so the analysis of the Monday's daily session if mixed with Sunday tends to be more comprehensive. This indicator plots a candle with the following values: Open - the Friday's Close or Sunday's Open (depending on your choice). High - the highest High of Sunday and Monday. Low - the lowest Low of
FREE
The indicator that helps you by plotting a reference to easily determine if a scalping trade (or intraday trade) has chances to work out in your favor. One of the most common issues intraday traders have is the lost of reference to know if a movement is big or small due to the scaling of the chart. With this indicator, you have 3 visual aids on your chart that will help you: "Screener" : Please set the normal stop loss size that you usually apply in your strategy. This will plot a rectangle afte
This indicator plots a crosshair pointer in all charts of the terminal in the position relative to the active chart. To activate the Pointer Sync, just press the "+" button that will appear in one of the 4 corners of the chart where the indicator is added. To deactivate the Pointer Sync, just press the "+" button again. Once Pointer Sync is deactivated, the cross lines will disappear in all charts as well. You can adjust the color of the pointers and the button, the corner where the button appea

If you like trading by candle patterns and want to reinforce this approach by modern technologies, this script is for you. In fact, it is a part of a toolbox, that includes a neural network engine implementing Self-Organizing Map (SOM) for candle patterns recognition, prediction, and provides you with an option to explore input and resulting data. The toolbox contains: SOMFX1Builder - this script for training neural networks; it builds a file with generalized data about most characteristic pric
FREE

Trades Viewer is a trading helper app for a serious trader. It offers several important data like day range, 22 days average range and predefined PL. It draws trades history and current open positions on a chart. It has a detail panel for viewing a particular trade with just a click on that trade. All these make it very convenient and straightforward to view your entry/exit positions and thus improve your trading system.
Features Profit/loss of the current symbol, counting all trades of the sy

Auto Trade Copier is designed to copy trades between multiple MT4/MT5 accounts/terminals with 100% accuracy. The provider and receiver accounts must be on the same PC/VPS. With this tool, you can copy trades to receiver accounts on the same PC/VPS. All trading actions will be copied from the provider to the receiver with no delay. This version can be used on MT4 accounts only. For MT5 accounts, you must use Auto Trade Copier for MT5. Reference: For MT4 receiver, please download "Trade Receiver F
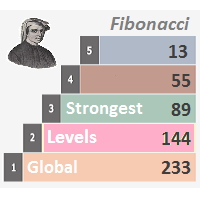
Description Strongest Levels Global is a colored multicurrency/multisymbols indicator that automatically plots a system of the nearest levels of strongest resistance and support in the separate window on one of nine different indicators of the current timeframe in accordance with user's choice. Repeated usage of the indicator with various number of bars creates an extended and confirmed system of support and resistance! The indicator calculates and plots levels based on the number of bars set b
This is a technical indicator that put on strategy tester the buttons of the expert adviser "Control adora". Usually when applied the controladora to the strategy tester, the buttons do not appear and therefore its functions (like directly buy, sell, close orders or place stop loss indicator) can't be used. But now you can if have the Manual Backtest indicator. If you don't have Control adora, you can get it from here . This indicator get on the chart the buttons that can be of use in strategy t
FREE

This is a simple script that places a defined number of lines above and below a given price. The script lets you set the number of lines, the separation in pips and the color. Instructions:
Drop the script on a chart to draw the level lines If the last parameter is set to false, the script will delete the lines previously placed by it.
Parameters:
English? Turn it yes to use English language, false will turn language to Spanish Separation Set the pips distance among lines From Price
FREE
Ce conseiller offre les fonctionnalités suivantes : Position ouverte : ouvrez un ordre long ou court lorsque le prix franchit la ligne de tendance. Liquidation : Liquidez les positions longues ou courtes lorsque le prix franchit la ligne de tendance. Trailing Stop Loss – L'EA suit la ligne de tendance et continue d'augmenter le stop loss pour les ordres à long terme ou de réduire le stop loss pour les ordres à court terme. La ligne peut être une ligne de tendance ou une ligne horizontale.
BreakEven shows the location of the average price level of the orders in the symbol, to which the indicator is attached. This information allows you to find the break-even. The indicator is helpful if you manage several positions, since it allows you to evaluate the performance of your open trades in a glance. If you trade a single order, it allows you to evaluate the effect of your stop loss and the profit or loss during the time your trade is open. Apart from drawing a break-even level line (w

Description Fibo Levels Custom is a color multicurrency/multi-symbol indicator that automatically plots Fibonacci levels on the Market Mood Oscillator in a separate window below the chart of the main financial instrument. It can be used with any broker, regardless of the name of a financial instrument used because the symbol name must be entered manually as an input parameter. If you enter a non-existent or invalid name of a financial instrument, you will receive an error message sayin
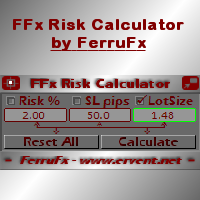
FFx Risk Calculator panel will help you to calculate very easily your trades size, SL or the risk directly on the chart. All features are described below: Option to select which parameter to calculate: Risk, Stop Loss or Lot Size The panel will show if the lot size is allowed according to the current account free margin Button to maximize/minimize the panel Drag and Drop the panel anywhere on the chart How to use it? Select the parameter you want to be calculated. It will be based on the 2 other
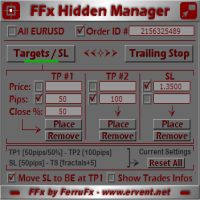
The FFx Hidden Manager panel will help you to manage easily your orders directly on the chart. Below all features described: TP, SL and TrailingStop are hidden Each order has its own lines on chart Drag & Drop any line to change the TP/SL as per your need Option to move automatically the SL line at breakeven when TP #1 is reached Option to choose the TP/SL type (by pips or price) Option to choose the TrailingStop type (by pips, MA, Fractals, PSAR or ATR) Define which order(s) you want to manage

Description Fibo Retracement is an indicator that automatically plots Fibonacci levels in the main chart based on Close prices , which distinguishes it from the Fibo Levels indicator that plots levels based on High/Low prices. Thus, using both indicators provides the trader with the opportunity of determining support and resistance zones by Fibonacci! The levels are calculated and plotted over a certain interval using the number of bars specified by the user. The user can display Fibonacci l
The new version of MirrorSoftware 2021 has been completely rewriten and optimized.
This version requires to be loaded only on a single chart because it can detect all actions on every symbol and not only the actions of symbol where it is loaded.
Even the graphics and the configuration mode have been completely redesigned. The MirrorSoftware is composed of two components (all components are required to work): MirrorController (free indicator): This component must be loaded into the MAST
FREE

Vous voulez devenir un trader forex 5 étoiles constamment rentable ? 1. Lisez la description de base de notre système de trading simple et de sa mise à jour stratégique majeure en 2020 2. Envoyez une capture d'écran de votre achat pour obtenir votre invitation personnelle à notre chat de trading exclusif
Ce gestionnaire de trades est le complément idéal pour tous les utilisateurs de FX Trend qui souhaitent utiliser une gestion des trades entièrement automatisée.
Il détecte immédiatement

This is a reduced version, demo if you like, of the published Elliott Wave Tool 7Pasos . The limitations for this tool vs Elliott Wave Tool 7pasos are the following: Only one account possible, the original tool has 1 principal and 4 alternative accounts. Only one degree (Primary) is available, in the original tool 12 different degrees (6 in micro) are at your disposition. As only one degree is available, the functions to upgrade and downgrade the degree of the selected wave are disabled. Fixed c
FREE

Description Strongest Level is an indicator that automatically plots the nearest levels of strongest resistance and support in the main chart based on prices of the current timeframe. Repeated usage of the indicator with various number of bars creates a system of support and resistance! The indicator calculates and plots levels based on number of bars set by the user. It is recommended to set numbers from a golden ratio according to Fibonacci (13, 21, 34, 55, 89, 144, 233, 377, 610 etc.). Users

Free Hand Drawer is a small app that runs as technical indicator and the only thing that does is that it draws continuous line. To activate it, after adding the indicator to the chart just press the D on your keyboard and click where you want to start drawing. Then every click you make on your chart will be the next nod in your drawing. Use it to draft Elliott waves, or to illustrate ideas on your chart. If you like to draw manually your Gann line you’ll find it handy as well. Each time you want

Description Strongest Higher Level is an indicator that automatically plots the nearest level of strongest resistance and support in the main chart based on prices of the higher timeframe that differs it from Strongest Level indicator. Repeated usage of the indicator with various number of bars creates a system of support and resistance! The indicator calculates and plots levels based on number of bars set by the user. It is recommended to set numbers from a golden ratio according to Fibonacci

I like trading manually, so I created this tool to make my trade more easier and faster.
Features Money management. Click for place order ( Buy/Sell/BuyStop/BuyLimit/SellStop/SellLimit). Many buttons for control your account (Close All, Remove Pendings, Breakeven, Hedging). Auto hide if not use for 2 minutes. See profit on current symbol. Free to move panel to where you want. Save your settings for using on next time. Special: It's work on backtest mode! You can use this for training yourself.

This is a semi-automatic Expert Advisor. A user draws a support or a resistance line in the form of a horizontal line or a trendline on a chart. A command in the format of UP|DN_xxxx:yyyy is specified in the line name; the Expert Advisor understands it as a signal to buy or sell setting a stop loss and a take profit. EA settings include a parameter with a lot size and a value for moving stop loss to breakeven. If stop loss = 0, the EA does not use breakeven. If this parameter is greater than zer

Auto Trade Driver is an automatic powerful tool (run as Expert Advisor) that helps you to manage risk and control orders and maximize your profit in multi-protect/trailing-stop rules. This tool is very useful for both scalpers and trend followers. It not only calculates the trade risk exactly, but also protects and maximizes your profits in real-time. With this tool, the only thing you have to do is to enter trade by your own strategy, then it will auto-drive your position with exit strategy you

Controladora means in Spanish controller, this is a simple yet powerful Expert Advisor that allows you to control your trading easily and precisely. Do you want to stop your trade when the price cross a trend line? Don't worry, Controladora can do it. Do you want to take profit when the price reaches the top of a channel? Controladora can do it as well. Calculating the exact proportion of your account by opening a trade, which size represents in case of loss a percentage of your balance, is time

Did you have to start again the very same analysis because the original one, from where you want to modify, just have so much information that no longer fits? Have you ever wanted to change some in one of your charts and make this new line, Fibo or channel automatically appear in some or the rest of your set of charts? Object Copier is the solution to replicate any object into one or several charts at your desire. No matter if you changed an object, or made it from the scratch. With Object Copie

Description Impulse Smart is an indicator impulse trading system based on Moving Average and MACD Classic Smart with sound notification . The idea of the impulse system based on Moving Average and MACD Histogram was first offered by Dr. Alexander Elder in his book "Come Into My Trading Room" . The system allows users to choose the calculation method ( Moving Average and MACD Classic Smart ) based on a single, double or triple moving average with identification of primary signal of pr

The Expert Advisor notifies that a price has crossed a line on the chart. It handles two types of lines - horizontal line and a trendline. The number of lines is unlimited. Parameters: prefix of signal line - prefix of object (line) names processed by the indicator. If the parameter is empty, it handles all object types: horizontal lines and trendlines. price Mode - price type (bid or ask). timeout - crossing alert timeout. number of repeats - the limit of crossing alert repeats. number of comme

When you combine short term fibos with the long term, your chart get missed up with a lot of lines that hardly make sense at first view. The best way to improve the clearness and there for the easiness to read your chart is by deleting the fibo levels that you no longer need, for example those levels that the price proved didn’t work as support or resistance. With Fibo Pro, you can activate or deactivate from a set of fibo levels pre-settled by you, without miss with the default fibo configurati

CorExTi is a tool that will save you literally hours in your daily routine to draw lines and other graphic elements in your charts. With a temporary panel discreetly displayed on your screen at the touch of a graphic element as trendline: Changes the object between 4 favorite line styles (with color, line thickness and style) Cuts trendlines, when are extended, just at the point where you touch them Extends trendlines (active property of Ray) which are not extended Or deactivates visualizat

Description Impulse Grand Global is an indicator impulse trading system based on Moving Average and MACD Classic Global . The idea of the impulse system based on Moving Average and MACD Histogram was first offered by Dr. Alexander Elder in his book "Come Into My Trading Room". The system allows users to choose the calculation method ( Moving Average and MACD Classic Global ) based on a single, double or triple moving average with identification of primary signal of probable reverse of

Description Impulse System Global is an indicator impulse trading system based on Moving Average and MACD Histo Global . The idea of the impulse system which is based on Moving Average and MACD Histogram was first offered by Dr. Alexander Elder in his book "Come Into My Trading Room". The system allows users to choose the calculation method ( Moving Average and MACD Histo Global ) based on a single, double or triple moving average with identification of primary signal of probable reve

This script allows you to close all orders and delete all pending orders. Set to true order type you want to close and cancel. Parameters:
AllCurrency = set true to close position and cancel order in all pair, set false for current pair. CloseBUY = set true to close buy position. CloseSELL = set true to close sell position. DeleteBUYSTOP = set true to cancel buy stop order. DeleteSELLSTOP = set true to cancel sell stop order. DeleteBUYLIMIT = set true to cancel buy limit order. DeleteSEL

The best way to monitor multiple pairs within little workspace. RotaGrafico sequentially displays up to 6 different pairs. It has buttons to set a pair more time for observation. Normal exposure time adjustable. Broad exposure time adjustable. Combine in a profile, Rotagrafico and use the rest of your workspace to the pair that you want to analyze in detail.

Description Impulse Pro Global is an indicator's impulse trading system based on Moving Average and MACD Line Global . The idea of the impulse system based on Moving Average and MACD Histogram was first offered by Dr. Alexander Elder in his book "Come Into My Trading Room". The system allows users to choose the calculation method ( Moving Average and MACD Line Global ) based on a single, double or triple moving average with identification of primary signal of probable reverse of the previ
Description The indicator determines the appearance of internal bars on the chart, and paints them in accordance with the bullish and/or bearish mood. The indicator is different from Inside Bar in the same way as Tendency Reversal Bars is different from Reversal Bars . In other words, the indicator defines the appearance of internal bars during a bullish or bearish trend rather than defining their single appearance. The indicator can notify of the appearance of a formed internal bar by playi

Description Impulse Pro is an impulse system based on two indicators - Moving Average and MACD-Histogram . The impulse system was first designed by A. Elder and is featured in his book "Come Into My Trading Room: A Complete Guide to Trading". The system is based on the Moving Average and MACD-Histogram. This product is distinct in that it allows the user to choose the system calculation method (Moving Average and MACD-Histogram) based on a single, double or triple moving average. There is pos
Description Impulse Pro is an indicator's impulse trading system based on Moving Average and MACD Line . The idea of the impulse system based on Moving Average and MACD Histogram was first offered by Dr. Alexander Elder in his book "Come Into My Trading Room". The system allows users to choose the calculation method (Moving Average and MACD Line) based on a single, double or triple moving average. You can color bullish and bearish moods.
Inputs Calc_Method - Moving Average and MACD Line calcul

Description Fibo Levels is a color multicurrency/multi-symbol indicator that automatically plots Fibonacci levels on a candlestick chart in a separate window below the chart of the main financial instrument. It can be used with any broker, regardless of the name of a financial instrument used because the symbol name must be entered manually as an input parameter. If you enter a non-existent or invalid name of a financial instrument, you will receive an error message saying that the specified f
Description Fibo Levels is a color multicurrency/multi-symbol indicator that automatically plots Fibonacci levels on any of the following six standard indicators ( AD, OBV, MA, Momentum, ATR and StdDev ) in a separate window below the chart of the main financial instrument. It can be used with any broker, regardless of the name of a financial instrument used because the symbol name must be entered manually as an input parameter. If you enter a non-existent or invalid name of a financial ins

Description Fibo Levels is a color multicurrency/multi-symbol indicator that automatically plots Fibonacci levels on a Heiken Ashi chart in a separate window below the chart of the main financial instrument. It can be used with any broker, regardless of the name of a financial instrument used because the symbol name must be entered manually as an input parameter. If you enter a non-existent or invalid name of a financial instrument, you will receive an error message saying that the specified

Overview With Account details info script you will get the following account info: Account Number Account Name Account Currency Company (Broker) of the Account Server you are using Account Leverage Stop Out Level Account Balance Account Equity Account Margin Account Free Margin Symbol of the chart you dropped the script on Lot Size Min Lot allowed Lot Step Max Lot allowed Tick Value Tick Size Spread Stop Loss Level Swap Long Swap Short Initial Margin Maint Margin Required Margin is the Trading A
FREE

The Expert Advisor for increasing (or opening) market positions. Allows specifying the desired risk, target and searching for the best open price and trade volume.
Configurable Parameters: lots - directly the volume of the position increase.
% equity - the amount of growth as a percentage of the amount of funds.
stop loss - directly the level of the stop loss order.
loss - the level of the stop loss order depending on the allowable loss.
take profit - directly the take profit level of
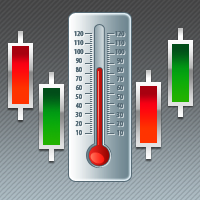
Some trading strategies are suitable for the quiet market with less volatility, while others are suitable for the volatile and violent market. Either way, traders should have a clear measure of how hot or cold the market is. This product is convenient for traders to compare the degree of cold heat of different trading varieties, or the trading heat of the same trading variety in different time periods. You can put it on different charts to get the intuition. It's easy to see which is more hot an

The EA performs trade operations of closing position groups. Positions are grouped by type. It is possible to select orders by the profit (loss) value. It is possible to form the closure groups manually. You can set a value for automatic closure of a positions group after reaching a certain profit/loss level or price level. The additional functions of the EA are called using the hot keys: SHIFT+A - show/hide Auto exit options. SHIFT+S - show/hide Settings panel. SHIFT+V - sound ON/OFF. SHIFT+I -
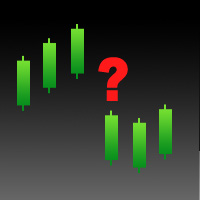
This product is used to check the foreign exchange market history datas. Good quality historical datas is important for traders to perform market analysis or back testing. But the quality of historical datas provided by various foreign exchange brokers is uneven. Sometimes we notice missing k-line sequences, but sometimes it is not easy to detect them. This product helps users locate these missing locations.If there are many gaps in a given period of time on a chart, you need to be careful about
This very new indicator is able to unlock all advanced features of MetaTrader 4 (above build 600). This indicator can graphically represent the main data of the current account (balance, equity, free margin, current Profit/Loss, total Profit/Loss, amount of open position(s) & size, etc.) in an elegant way. On the chart AccountInfo graphically shows the account balance of recent days. Also all data can be filtered with MagicNumber, Order Comment, and symbol for the professional evaluation of a sp
FREE
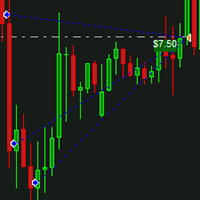
IceFX DrawProfit indicator can efficiently help those traders who want to see on the chart all closed positions output: profit or loss. If you set DrawProfit on your chart managed by an Expert Advisor (EA), you will clearly see its performance by its profits & losses.
Main Features: Draws closed order lines Draws profit/loss of closed orders in currency Sums orders by candles MagicNumber filter for EAs Comment filter
Input parameters: ShowProfitLabels : show profit of orders with a label Pro
FREE

The script creates account summary report in a separate window. The report can be created for all deals and for deals on selected financial instruments.
It is possible to specify a time interval of calculation and save report to an htm file.
Script inputs
report starting date - initial report generation date. symbols selection for report - select a method of choosing tools for a report generation. allSymbol - report is generated for deals performed on all symbols. onlyCurrentSymbol - report

Smart Trend Line Alert is a unique professional Trend Line, Support Line and Resistance Line Touch and Break out Alert with awesome Alert History feature, designed to help traders easily manage many charts and symbols without staring at the monitor.
Features Candle Break Out Alert, Price Touch Alert and Time Line Alert; 1 click for converting any drawn line into an alert line (Trend line and Horizontal line or Trend Line By Angle); Alerts History able to re-open closed charts or re-draw delete
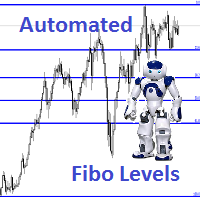
Description Fibo Levels is an indicator that automatically plots Fibonacci levels. The levels are calculated and plotted over a certain interval using the number of bars specified by the user . When the price achieve one of the target levels (23.6%, 38.2%, 50% or 61.8%) the indicator at the request of the user gives a sound signal and/or sends the message by e-mail. Example of the e-mail notification: Subject: Fibo Up Signal Message: Signal,H1 - Correction of EURUSD reached 23.6% - 2014
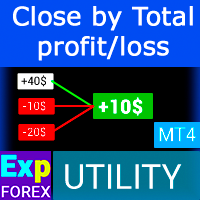
Clôture des positions dans MetaTrader 4 après avoir atteint le bénéfice/perte total avec la fonction de suivi des bénéfices. Vous pouvez activer les arrêts virtuels (ordre séparé) , Calcul et clôture des positions ACHAT et VENTE séparément (ACHETER VENTE séparé) , Fermeture et calcul de tous les symboles ou du symbole courant uniquement (Tous les symboles) , Activer le suivi pour le profit ( Trailing Profit) Clôture sur le total des profits et pertes sur la devise de dépôt, les

The Expert Advisor modifies the Stop Loss order position opened for the instrument of the current chart based on indicator values. Uses indicators Parabolic SAR , NRTR (Nick Rypock Trailing Reverse) , Moving Average or linear regression channel.
Switchable modes: Trailing stop only when in profit; Trailing stop only following the price; On every teak or on formed bars; Trailing for each order separately or for a total position. Has an option of "hidden stop", also you can exclude individual
The Synchronized Charts script allows comparing bars of different symbols or different periods of the same symbol. Attach the script to a chart and move bars or change the scale, all opened chart will move synchronously with the current one. The bars on different charts aligned to the border according to their open time. Please be sure the relevant history datas have been downloaded before synchronize charts. 。。。。。。。。。。。。。。。。。。。。。。。。。。。。。。。。。。。。。。。。。。。。。。。。。。

Panneau de trading pour trader en 1 clic. Travailler avec des positions et des commandes! Trading à partir du graphique ou du clavier.
En utilisant notre panel de trading, vous pouvez trader en un clic à partir du graphique et effectuer des opérations de trading 30 fois plus rapidement que le contrôle MetaTrader standard. Des calculs automatiques de paramètres et de fonctions qui facilitent la vie d'un trader et aident un trader à mener ses activités de trading beaucoup plus rapidement et p

EA peut clôturer des positions non rentables en recherchant et en fermant des positions rentables .
Cet assistant recherche , parmi tous les postes, le poste le moins rentable du terminal. De plus, en recherchant les positions rentables restantes, il calcule une série de positions pouvant couvrir la perte lorsque le profit d'une ou plusieurs positions est supérieur à la perte d'une autre position. Si un ensemble de telles positions est trouvé, le conseiller les ferme. Une série d
FREE
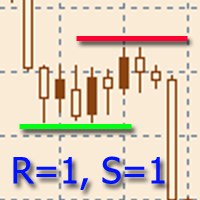
L'indicateur est conçu pour construire des niveaux de support et de résistance horizontaux. L'algorithme de recherche de niveau est basé sur le regroupement des extrêmes. Il est possible d'afficher des informations statistiques pour chaque niveau, de filtrer l'affichage des niveaux par un certain nombre de propriétés, d'ajuster le jeu de couleurs en fonction du type de niveau (support ou résistance). Particularités: L'indicateur est prêt à fonctionner et dans la plupart des cas ne nécessite pas

TimeFilter indicator allows you to visually select bit masks (GoodHourOfDay, BadHoursOfDay, GoodDayOfWeek, BadDaysOfWeek) for the Intraday Time Filter module of trading signals of the Standard Library. The use of time filters allows you to take into account the particulars of each trading session in performing trading operations.

The indicator is an inter-week hourly filter. When executing trading operations, the indicator allows considering time features of each trading session. Permissive and restrictive filter intervals are set in string form. The used format is [first day]-[last day]:[first hour]-[last hour]. See the screenshots for examples. Parameters: Good Time for trade - intervals when trading is allowed. Bad Time for trade - intervals when trading is forbidden.
time filter shift (hours) - hourly shift. percent

ChartWall is intended for displaying and automatic changing of wallpapers on a chart. It supports JPG and BMP formats. A file and a display style are selected via the built-in panel, which can be opened by clicking on the application icon (hidden button) that appears in the bottom left corner of the chart (main window) as you move the cursor to that area. Using the built-in panel you can also set a period for the rotation of images in minutes. Image files are selected randomly from the folder t
FREE
The goal of this indicator is to give you a quick & comprehensive view of your current profit. IceFX’s ProfitInfo is a utility indicator which displays the profit which is calculated from the actual trades on the chart(s). The indicator displays on a daily / weekly / monthly and yearly breakdown and shows the profit in pips / currency and percentage.
Main features: You can easily adjust IceFX’s ProfitInfo to display profit on the current open chart / current trade or even the profit of the ent
FREE
IceFX’s TradeInfo is an utility indicator which displays the most important information of the current account and position.
Displayed information: Information about the current account (Balance, Equity, Free Margin). Current spread, current drawdown (DD), planned profit, expected losses, etc. Number of open position(s), volume (LOT), profit. Today’s and yesterday’s range. Remaining time to the next candle. Last day profit information (with integrated IceFX ProfitInfo indicator). Risk-based LO
FREE
Description Keltner's colored multicurrency/multisymbol channel indicator, also called STARC band, drawn in a separate window below the chart of the main financial symbol. The indicator uses the calculation technique of the three drawing options: basic, improved and modified . The first two were proposed by Keltner, the third one - by a successful trader L. Rakshe. You can also search for your own best parameters of the indicator. The upper, middle and lower bands can be colored. The indicator
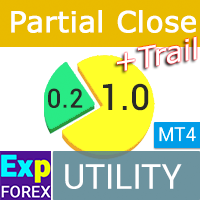
Fermeture partielle et sentier - assistant EA. Ferme une partie d'une position (Ferme une partie du lot) pendant le rollback. EA ferme une position rentable lors de clôtures partielles lorsque le prix évolue d'abord dans le sens des bénéfices, puis revient. Description complète +PDF Comment acheter
Comment installer
Comment obtenir des fichiers journaux Comment tester et optimiser Tous les produits de Expforex EA surveille la position. Si le prix évolue dans le sens des bénéfice
FREE
Exp-Averager est conçu pour faire la moyenne de vos transactions qui ont reçu un certain retrait en ouvrant des transactions de moyenne.
Le conseiller a la possibilité d'ouvrir de nouvelles positions en tendance ou à contre-courant. Il comprend également une fonction intelligente de stop suiveur qui s'applique à une série de positions. Le conseiller peut augmenter ou diminuer la taille du lot des positions. Il s'agit d'une stratégie largement utilisée pour ramener les positions perdantes au

Description Keltner's colored channel indicator,also called STARC band, drawn in the main chart window. The indicator uses the calculation technique of the three drawing options: basic, improved and modified . The first two were proposed by Keltner, the third one - by a successful trader L. Rakshe. You can also search for your own best parameters of the indicator. The upper, middle and lower bands can be colored. The indicator includes the basic analytical tool of the market moods by Keltner. Th

Overview The Expert Advisor sends notifications to a mobile phone, via e-mail or activates an audio alarm in case any changes are detected on the trading account: opening/closing positions, changing order parameters, balance or leverage. Also, the Expert Advisor can inform that Equity on the trading account has dropped below a specified value or Free Margin is small compared to Margin. The Expert does not trade, it only monitors your account.
Launching the Expert Advisor For the Expert Advisor

Overview The Expert Advisor sends notifications to a mobile phone, via e-mail or activates an audio alarm in case a position is opened or closed on the trading account. The Expert does not trade, it only monitors your account and orders.
Launching the Expert Advisor For the Expert Advisor to work, place the file NotifyMe_free.ex4 in terminal_folder/experts (probably it will be placed there automatically). NotifyMe_free should appear in the Expert Advisors section of the Navigator window. If no
FREE

Overview The script displays information about the trade account: Account - account number and type (Real or Demo); Name - name of the account owner; Company - name of a company that provide the access to trading; Server - trade server name; Connection State - connection state; Trade Allowed - shows whether trading is allowed on the account at the moment; Balance - account balance; Equity - account equity; Credit - amount of credit; Profit - profit size; Free Margin - free margin on the account;
FREE

Overview The script displays information about the trade account and the current financial instrument. Information about the trade account: Account - account number and type (Real or Demo); Name - name of the account owner; Company - name of a company that provide the access to trading; Server - trade server name; Connection State - connection state; Trade Allowed - shows whether trading is allowed on the account at the moment; Balance - account balance; Equity - account equity; Credit - amount
Le MetaTrader Market est un site simple et pratique où les développeurs peuvent vendre leurs applications de trading.
Nous vous aiderons à publier votre produit et vous expliquerons comment préparer la description de votre produit pour le marché. Toutes les applications de Market sont protégées par un cryptage et ne peuvent être exécutées que sur l'ordinateur de l'acheteur. La copie illégale est impossible.
Vous manquez des opportunités de trading :
- Applications de trading gratuites
- Plus de 8 000 signaux à copier
- Actualités économiques pour explorer les marchés financiers
Inscription
Se connecter
Si vous n'avez pas de compte, veuillez vous inscrire
Autorisez l'utilisation de cookies pour vous connecter au site Web MQL5.com.
Veuillez activer les paramètres nécessaires dans votre navigateur, sinon vous ne pourrez pas vous connecter.