 MetaTrader 5
 Experts
 Indicateurs
 Bibliothèque
 Utilitaires
 Widgets
 Règles
Regardez les tutoriels vidéo de Market sur YouTube
Comment acheter un robot de trading ou un indicateur
Exécutez votre EA sur
hébergement virtuel
hébergement virtuel
Test un indicateur/robot de trading avant d'acheter
Vous voulez gagner de l'argent sur Market ?
Comment présenter un produit pour qu'il se vende bien
Expert Advisors et indicateurs pour MetaTrader 4 - 232
 Les robots de trading effectuent automatiquement les transactions sur le marché, tandis que les indicateurs vous permettent de mieux analyser les cotations et de prédire le comportement des prix. Grâce à ces applications, vous serez en mesure d'effectuer des transactions dans MetaTrader 4 de manière plus avisée, tout en saisissant davantage d'opportunités.

Leave a review for this product, and receive another "Free" product that you want. You can see my other products here: https://www.mql5.com/en/users/zakri/seller
Grid Wizard EA has 4 built-in strategies that are really powerful. This EA is a winner EA. It can work on every symbol and timeframe, preferably H1.
Tests show it was profitable since 2010.
Entry Mode:
Both Directions, Same Basket - This strategy opens buy and sell trades at the same time, they are closed together.
Both Directions, S

Time frame: M1
Leverage : Higher the better
Spread: Lower the better
Account type : All types
(EA may enter hedge positions, if you want to disable this feature deactivate either Buy, or Sell from the setting)
Please please do not take unnecessary risks. (Trading is risky, and there are no guarantees for winning)
We wish you successful trading. (Trading is risky, and there are no guarantees for winning
Night scalping trading in the horizontal Bollinger channel. No risky strategies. All trades are protected by a stop loss. Accounting for the features of real accounts. It is possible to work with a minimum initial deposit of $10. Strategy. At night, near the rollover, market movements usually slow down, since at this time there are no strong disturbing factors. Price movements become small, but quite predictable. As a rule, they have the form of harmonic fluctuations. These movements can be used

Pythagorean — Indicateur de changement de direction de la tendance Présentation Pythagorean affiche la direction actuelle de la tendance directement sur le graphique des prix, sous la forme d'une rangée de points colorés qui suivent le prix. Les points verts indiquent un mouvement haussier, les points rouges un mouvement baissier. Un changement de couleur des points signale un changement de direction de la tendance. L'indicateur fonctionne sur tous les instruments et toutes les unités de temps.
Starkiller Grid Trader Starkiller Grid Trader is a MT4 trading robot which specializes in the management of grid trading systems. A very large variety of customizable settings are included to make sure that you are able to place grid trades on any currency pair, stock, index or commodity automatically according to your own liking. Starkiller is accurate, versatile and robust. - Includes numerous grid trading settings - Includes the ability to select open/close indicators - Includes color coded
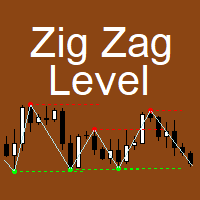
The indicator implements the author's approach to the construction of the popular "Zig-Zag" indicator.
The advantages of the "ZIgZag Level" indicator is that it filters out market noise and shows levels.
"ZIg Zag Level" is based on peaks and troughs, displays levels.
These levels can be disabled and configured.
The indicator displays the price of the level, the price tag can be disabled.
The "zigzag" line between the points can also be disabled.
The indicator has a built-in notification s

Time frame: M1
Leverage : Higher the better
Spread: Lower the better
Account type : All types
(EA may enter hedge positions, if you want to disable this feature deactivate either Buy, or Sell from the setting)
Please please do not take unnecessary risks. (Trading is risky, and there are no guarantees for winning)
We wish you successful trading. (Trading is risky, and there are no guarantees for winning

The market eagle - it is a Secure Automated Software for trade Forex market and indices. This EA takes perspective of the market looking like an eagle. From a distance, observe the entire market amphitheater detecting the entry points and the best points to implement the algorithm based on the set that we indicate in the input.This system allows us to use the key points of the market to adapt them to our algorithms, trend and countertrend.The system uses multiple lot depending on the algorith

Eakao is a trending following EA. This EA uses some custom indicators to detect entry signal. There are 2 trades opened per signal, one trade has fixed take profit, EA will use breakeven and trailing stop for another trade. The fixed stop loss and take profit are always set for each trade. Beside stop loss, this EA uses an exit indicator to exit the trade before stop loss or take profit are triggered. This EA has smart money management. Users only need to determine the accepted loss for each tr

Time frame: M1
Leverage : Higher the better
Spread: Lower the better
Account type : All types
(EA may enter hedge positions, if you want to disable this feature deactivate either Buy, or Sell from the setting)
Please please do not take unnecessary risks. (Trading is risky, and there are no guarantees for winning)
We wish you successful trading. (Trading is risky, and there are no guarantees for winning
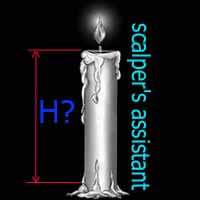
Индикатор "TakeOver" простой в использовании, создавался он для удобства определения разницы между открытием и закрытием текущей свечи. "TakeOver" рекомендуется применять в скальпинге с различными стандартными индикаторами МТ4, к примеру Envelopes, ZigZag, RSI и т.д. В настройках по умолчанию установлены уровни 200 и -200, но вы можете самостоятельно изменить. Один из примеров обнаружения входа в открытие сделки изображено на скриншоте, SELL если свеча закрылась выше уровня Envelopes и гистогра
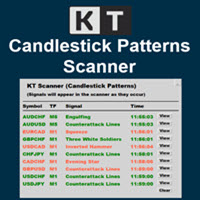
KT Candlestick Patterns Scanner is a Multi-Symbol and Multi-Timeframe scanner that fetches and shows various candlestick patterns on 28 currency pairs and 9 time-frames concurrently . The scanner finds the candlestick patterns by loading the KT Candlestick Patterns indicator as a resource in the background.
Features
The scanner can find the candlestick patterns on 252* combinations of symbols and time-frames from a single chart. Open the signal's chart loaded with a predefined template with a s

Je voudrais vous présenter un robot efficace que j'utilise depuis plusieurs années. Il peut être utilisé en mode semi-automatique, comme en mode totalement automatique. >>> Chat <<<
Le programme comporte des paramètres souples pour le commerce sur les nouvelles du calendrier économique. Il est impossible de le vérifier dans le testeur des stratégies. Ce qu’il faut, c’est le travail réel. Il faut ajouter à la liste des URL autorisées, dans les paramètres du terminal, un site d'actualités. Cliqu

TrendMMK is an extremely simple indicator. The Buy and Sell signal changes as soon as the indicator flips over the closing price. When the TrendMMK closes below the Price, a Buy signal is generated, and when the TrendMMK closes above the Price, a Sell signal is generated.
TrendMMK is a trending indicator, and like all trending indicators it works well in trending markets. However, it does give lesser false signals than a lot of other indicators and hence if you are an intraday trader who want
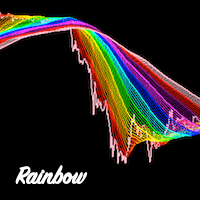
Rainbow Ribbon - Rainbow MA bands - Useful for spotting trend changes - Useful for spotting trend slopes - Useful for spotting trend acceleration - Ability to choose ribbon colors, moving averages, and distances - Provides colorful rainbow ribbons to show an array of moving averages
Rainbow Ribbon is an extremely useful indicator, it has been designed to make it easy to spot the trend and also changes within the trend before they occur. It can be used many different ways and provides the abili
MACD Pro - Features a built-from-scratch overhauled MACD indicator - Signals Buy and Sell Zones - Uses an exceptional noise cancelling filter - Signals up trends and down trends - Precise and accurate signals
MACD Pro is an indicator built from the ground up and is designed to signal optimal buy and sell zones. Take buy trades in the buy zones and sell trades in the sell zones. It includes a noise cancelation feature which rivals the best products on the market.
An indicator for you follow the trend candles.
We are providing a group of indicators that can support your decisions...
At this one you are having access to the candle trend indicator. Please review the others indicators for trend availables...
That you give you the ability to understand the market flow and also you will be developing your pacience... Trend the market as professional...
We are using the Average True Range Indicator! Hope you enjoy.
An indicator for you follow the trend. We are providing a group of indicators that can support you decisions...
At this one you are having access to the trend indicator. Please review the others indicators for trend availables... That you give you the ability to understand the market flow and also you will be developing your pacience...
Trend the market as professional... We are using the Average True Range Indicator! Hope you enjoy.
PV Super Trend Signals
- Detects Key Points of Reversals - Enters Trades at Key Points - Closes Trades at Accurate Levels
- Extremely accurate - Great for almost every currency - Amazing for EURUSD H1 - Backtested across many currencies over many years on many timeframes - H1 is the best timeframe - Can be used to make stable profit - Can be used to hedge other trading robots - ReInvest with Risk and Leverage features if desired - Backtested accurately across many currencies using tick data -

Time frame: M1
Leverage : Higher the better
Spread: Lower the better
Account type : All types
(EA may enter hedge positions, if you want to disable this feature deactivate either Buy, or Sell from the setting)
Please please do not take unnecessary risks. (Trading is risky, and there are no guarantees for winning)
We wish you successful trading. (Trading is risky, and there are no guarantees for winning

The Expert Advisor Risk Manager for MT4 is a very important tools for every trader, to manage his trading risk and keep the Balance safe.more than 60% of the Trader lose their investment because they don`t manage the risk very well. With the Risk Manager Expert Advisor, you will be able to control your risk in your trading account. Risk and profit control can be carried out both in monetary terms and in percentage terms.
For the Expert Advisor to work, simply attach it to the currency pa
Stratégie de trading prête. L'indicateur montre les points d'inversion des prix sur le graphique. Aux endroits d'un renversement possible des prix, l'indicateur dessine une flèche. Si l'indicateur dessine une flèche verte, le prix augmentera. Si l'indicateur dessine une flèche rouge, le prix baissera. L'indicateur dessine également une ligne moyenne sur le graphique. Il s'affiche en jaune. Avec une probabilité de 95%, si l'indicateur dessine une flèche verte et que le prix est inférieur à la li

Super Turbo AI is a Multi Currency Trading Robot which has been carefully designed and rigorously tested for successful and consistent long term trading activities with each trade been potentially profitable. The over twelve years Optimization and back testing stages have both been well completed and default setting is best suited to the EURUSD pair. Attached also is the same EURUSD setting which can continually be used for months and even years to come (please visit the Comments section to dow

ATR Scanner Pro is a multi symbol multi timeframe volatility scanner that monitors and analyzes Average True Range indicator value in up to 28 symbols and 9 timeframes in 3 modes : ATR value: As a volatility dashboard it shows the ATR indicator value in all pairs and timeframes and signals when the ATR value reaches a maximum or minimum in a given duration. Short term ATR/Long term ATR ratio: It shows ratio of 2 ATRs with different periods. It's useful in detecting short term volatility and e

Time frame: M1
Leverage : Higher the better
Spread: Lower the better
Account type : All types
(EA may enter hedge positions, if you want to disable this feature deactivate either Buy, or Sell from the setting)
Please please do not take unnecessary risks. (Trading is risky, and there are no guarantees for winning)
We wish you successful trading. (Trading is risky, and there are no guarantees for winning

EA only work XAGUSD symbol Slow trading, low risk low return strategy open position only buy no stoploss , option ea : close equity target, stop equity target. Take profit step by step. For minimum blance please download excel file, and try ea in demo account before purchase link download forex robot ea xagusd miner forex robot to generate profits with very low risk, such as owning a mine but does not require high-spec hardware which is very expensive, rather than buying mining hardware, it is

Slow trading, low risk low return strategy open position only buy no stoploss , option ea : close equity target, stop equity target. Take profit step by step. For minimum blance please download excel file, and try ea in demo account before purchase link download how our ea works is * Recommended free swap account (islamic account) * trading with own money * ea will open buy, the price goes down will buy again and so on ea will stop when the highest price is according to settings * floating min

Levels Pro System рассчитывает канал движения цены, учитывая волатильность инструмента, бары и тренд, - и на основании расчетных данных показывает тренд и чертит уровни поддержки/сопротивления в очень удобном визуальном представлении. В индикатор встроена система определения критических точек (критических баров), которая позволяет трейдеру значительно проще выявлять истинный пробой уровня, ложный пробой, отскок от уровня, возможный сигнал на ранней стадии движения цены итд. Таким образом, торгов

Grid trading is executed when orders are placed above or below a set price, creating a grid of orders with rising and falling prices. Our patented trader makes it possible to open new grids at the average price, thereby increasing the chances of recovering a negative floating balance.
Unlike other trading strategies, our focus is on decreasing Bollinger bands. This means that if the market has abruptly moved into a region and is weakening, it is more vulnerable to a reversal. This innovative a
Fibo + Elliott + CME
The Expert Adviso r is designed as an assistant for manual trading. Ready-made trading system based on Elliott waves and Fibonacci retracement levels . It is simple and affordable. Display of the marking of Elliott waves (main or alternative option) on the chart. Construction of horizontal levels, support and resistance lines, a channel. Superposition of Fibonacci levels on waves 1, 3, 5, A Display data from CME (CME - Chicago Mercantile Exchange Chicago Mercantile Excha

DayNight moving averages along with support and resistance make a remarkable difference if properly utilized This indicator detects trade direction and sends notification to your mobile phone so that you can enter/exit a trade without having to be seated in front of desktop computer all day and night. Although you have to execute/send an order yourself, you can setup rules through the setting made available for proper lots size base on the available balance/fund you are trading with. The opport
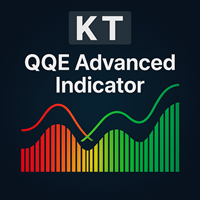
Le KT QQE Advanced est une version modifiée du célèbre oscillateur QQE, offrant une représentation plus précise grâce à un histogramme coloré doté de lignes de suivi (Trailing Line) rapide et lente.
Contrairement au QQE classique, KT QQE Advanced se compose d’un histogramme intégrant des niveaux de surachat/survente.
Applications
Repérez rapidement des signaux d’achat/vente sur tous les horizons grâce au scanner MTF. Déterminez la direction de la tendance avec plus de précision. Détectez les
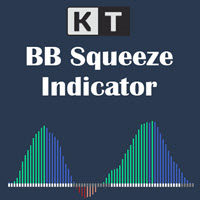
Repérez la contraction de volatilité avant l'expansion du momentum KT BB Squeeze réunit l'état de la volatilité et la direction du momentum dans un oscillateur clair. Il compare Bollinger Bands à Keltner Channels pour montrer si le marché est comprimé ou en expansion, tandis que l'histogramme révèle l'évolution du momentum autour de la ligne zéro. Points gris: Bollinger Bands se trouve à l'intérieur de Keltner Channels et signale une phase de compression. Points blancs: Bollinger Bands se trouve

DayNight HighLow is base on support and resistance levels, as well as averages of highs and lows. It detects trade direction and sends notification to your mobile phone so that you can enter/exit a trade without having to be seated in front of desktop computer all day and night. Although you have to execute/send an order yourself, you can setup rules through the setting made available for proper lots size base on the available balance/fund you are trading with. The opportunity to take a profit

KT Forex Volume affiche le volume d'achat et de vente d'une paire de devises sous forme d'histogramme coloré. Le volume est composé des transactions d'achat et de vente sur un actif. Sur le marché des changes (Forex) : Si le volume d'achat dépasse le volume de vente, le prix de la paire de devises augmente. Si le volume de vente dépasse le volume d'achat, le prix de la paire de devises diminue.
Fonctionnalités Évitez les mauvaises transactions en les confirmant avec les données de volume par ti

KT Fractal Channel Breakout draws a continuous channel by connecting the successive Up and Down fractals. It provides alerts and also plots the Up and Down arrows representing the bullish and bearish breakout of the fractal channel.
Features
If you use Bill Williams fractals in your technical analysis, you must also include it in your trading arsenal. It can be very effective and useful for stop-loss trailing. A new market trend often emerges after a fractal channel breakout in a new direction.
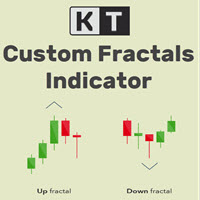
KT Custom Fractals is a personal implementation of the Fractal indicator first introduced by Bill Williams. With KT Custom Fractals you can choose a custom number of bars to allow to the left and right side of the fractal. For example, you can display the fractals that have "three" successive bars with the highest high in the middle and one lower high on both sides , or you can display the fractals that have "Eleven" consecutive bars with the lowest low in the middle and five higher lows on bot

The Vortex Indicator was first presented by Douglas Siepman and Etienne Botes in January 2010 edition of Technical Analysis of Stocks & Commodities. Despite its based on a complex implosion phenomenon, the vortex is quite simple to interpret. A bullish signal is generated when +VI line cross above the -VI line and vice versa. The indicator is mostly used as a confirmation for trend trading strategies. The Vortex was inspired by the work of Viktor Schauberger, who studied the flow of water in tur

Time frame: M1
Leverage : Higher the better
Spread: Lower the better
Account type : All types
(EA may enter hedge positions, if you want to disable this feature deactivate either Buy, or Sell from the setting)
Please please do not take unnecessary risks. (Trading is risky, and there are no guarantees for winning)
We wish you successful trading. (Trading is risky, and there are no guarantees for winning

Suivre la direction du marché en un coup d'œil KT Trend Filter transforme sa méthode affinée d'analyse de tendance en une ligne claire et colorée directement sur le graphique des prix. Il aide à reconnaître rapidement si le marché monte, baisse ou évolue latéralement sans superposer plusieurs indicateurs. Avec la valeur par défaut 200 pour Trend Period, vous obtenez une vue directionnelle générale tout en gardant l'état actuel facile à repérer. Transformer la tendance en contexte visuel clair Up
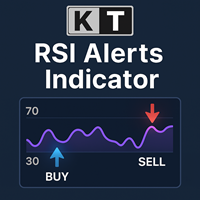
KT RSI Alerts est une version personnalisée de l’oscillateur RSI (Relative Strength Index) qui génère des signaux et des alertes sur la base de quatre événements personnalisés : Lorsque le RSI entre en zone de surachat. Lorsque le RSI sort de la zone de surachat. Lorsque le RSI entre en zone de survente. Lorsque le RSI sort de la zone de survente.
Fonctionnalités Un excellent choix pour les traders qui spéculent sur les mouvements du RSI dans les zones de surachat/survente. Indicateur léger con
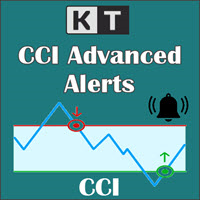
KT CCI Alerts is a personal implementation of the Commodity Channel Index (CCI) oscillator that provide signals and alerts on four custom events: When CCI enter in an overbought zone. When CCI exit from an overbought zone. When CCI enter in an oversold zone. When CCI exit from an oversold zone.
Features A perfect choice for traders who speculate the CCI movements within an overbought/oversold zone. Lightly coded without using extensive memory and resources. It implements all Metatrader alerts.
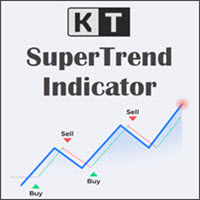
KT SuperTrend affiche une ligne directionnelle claire sur le graphique des prix. Pendant une tendance haussière, la ligne progresse sous le prix et peut servir de repère de suivi. Pendant une tendance baissière, elle passe au-dessus du prix et accompagne le marché vers le bas. Comme la distance repose sur l'Average True Range, la ligne s'adapte lorsque la volatilité augmente ou diminue. La direction change après la clôture d'une bougie de l'autre côté de la ligne SuperTrend. Une clôture au-dessu
Je vous apporte Don frappe un expert en trading agressif, c'est un système multidirectionnel, il couvre tous les temps et toutes les devises, avec un contrôle Drawdown ce système utilise une de mes logiques Martingale avec un suivi de ce qui se passe dans un temps inférieur et dans un temps plus long, il sera également décidé s'il faut intervenir dans le Drawdown, je sais que beaucoup n'aiment pas le martin ou système Edge car ils sont habitués à graver des comptes, mais croyez-moi, mes système
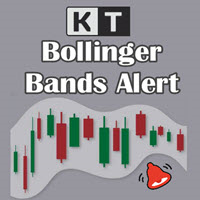
Surveillez chaque contact avec les Bandes de Bollinger depuis le graphique KT Bollinger Bands Alert affiche les bandes supérieure, médiane et inférieure, puis surveille si la bougie actuelle touche une bande sélectionnée. Activez les événements utiles à votre méthode et laissez l'indicateur attirer votre attention au bon moment pendant que vous observez le reste du marché. Gardez les valeurs des trois bandes sous les yeux Des étiquettes de prix facultatives suivent les valeurs actuelles des band
Simple indicator that supports decision makers. You will have the candles directions for different timeframes on your screen. That will allowed you to be one more scenario to analyze before you open your orders. In case you would like to have more details, just let me know.. so we can add it to the chart. Multicurrency that in inform you the directions for multi-timeframes!

The Week7D indicator helps traders identify the day of the week on a price chart. It simply marks each period or each candle as the day of the week at the start of a new trading day. This allows traders to watch how prices move on any given day.
The Week7D indicator has several customization options that traders can use to change the visual representation of the indicator.
The variable "BarCount" changes the number of days during which the indicator will indicate the day of the week in each d
FREE

This Expert Advisor is used in tandem with the FiboMagic Pro indicator https://www.mql5.com/ru/market/product/64978?source=Site +Profile
The FiboMagic Pro indicator shows you:
1) Which way to trade 2) Clear entry point criteria for breaking the counter-trend line in the Fibonacci structure 3) Clear exit criteria based on levels
The FiboMagic Auto Expert Advisor provides you with automatic trading based on the signals of the FiboMagic Pro indicator, namely:
- analyzes the breakout of the cou
A really simple strategy for be trading using M15 for EURUSD. Really impressive results... you just need to care your risk managment according to your account balance. Just one order at once... We suggest London and US opening hours. As you will see we are using GMT-3 for our operations... and a little volume and price action with Average True Range indicator in order to make decisions. Any additional question, just let me know.
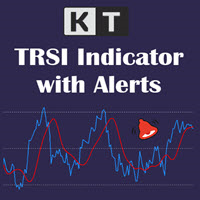
KT TRSI est un oscillateur basé sur une combinaison du RSI (Indice de Force Relative), de l’EMA (Moyenne Mobile Exponentielle) et de la SMA (Moyenne Mobile Simple). Comparé au RSI classique, le TRSI est moins sujet aux faux signaux grâce à l’effet de lissage de la SMA. Il prend également en charge tous les types d’alertes MetaTrader.
Règles d'entrée simples
Achat : lorsque la ligne bleue (RSI) croise au-dessus de la ligne rouge (TRSI). Vente : lorsque la ligne bleue (RSI) croise en dessous de l
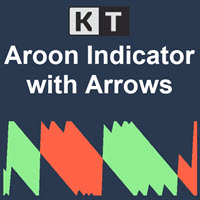
Le KT Aroon Oscillator est une version modifiée de l’oscillateur Aroon original, initialement développé par Tushar Chande en 1995. Il mesure l’intervalle de temps entre les récents sommets et creux, et utilise ces données pour calculer la direction et la force de la tendance du marché. Il repose sur l’idée que, pendant une tendance haussière, le prix établira de nouveaux sommets successifs, tandis qu’en tendance baissière, de nouveaux creux seront formés. Signal d’achat : Lorsque la ligne Aroon
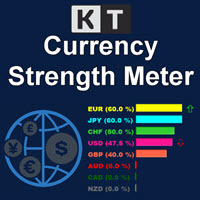
Le KT Currency Strength Meter mesure la force et la faiblesse des devises individuelles à l'aide d'une formule mathématique agrégée appliquée aux principales paires de devises du Forex. La force est calculée à partir des bougies haussières et baissières sur une période fixe. Ensuite, un algorithme classe les devises de la plus forte à la plus faible et met à jour l’ordre en temps réel selon les nouvelles données.
Avantages
Améliorez immédiatement votre stratégie en éliminant les signaux vous su
KT Bullish Bearish shows the bullish/bearish regime of the market in the form of a colored histogram representing both of the market states alternately. Bull Market (Blue Histogram): A bull market indicates an uptrend when an instrument price rises over a continued period like days, months, or years. Bear Market (Red Histogram): A bear market indicates a downtrend when an instrument price rises over a continued period like days, months, or years.
Applications
It prevents trading against the big
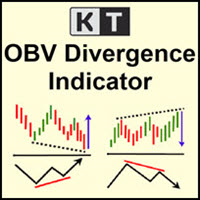
KT OBV Divergence affiche les divergences régulières et cachées qui se forment entre le prix et l’oscillateur OBV (On Balance Volume).
Fonctionnalités
Les divergences asymétriques sont ignorées pour plus de précision et moins d'encombrement visuel. Prend en charge des stratégies de trading de retournement et de continuation de tendance. Entièrement compatible et prêt à être intégré dans un Expert Advisor. Peut être utilisé pour les entrées comme pour les sorties de position. Inclut toutes les a
KT Candle Timer shows the remaining time in the closing of the current bar. You can use the bar closing time for multiple purposes, including time and trade management during the trading hours.
Features
It also shows the Symbol spreads along with the remaining time. It offers two convenient timer display positions, i.e., chart corner or next to the current bar. From colors to text size, it offers full customization according to user preferences. It is optimized to work without using extensive c

About the Lyne indicator
Lyne is a Metatrader 4 (MT4) indicator, the essence of which is to transform the accumulated historical data.
The Lyne indicator makes it possible to detect various features and patterns in price dynamics that are invisible to the naked eye.
Based on this information, traders can anticipate further price movement and adjust their strategy accordingly.
This indicator has proven itself in the scalping strategy. The indicator works without repainting.

KT Pivot Points trace automatiquement les niveaux de pivot quotidiens, hebdomadaires et mensuels sur un graphique à partir des dernières données. Les points pivots sont un indicateur largement utilisé en analyse technique, en particulier sur le marché du Forex.
Fonctionnalités
Envoie des alertes lorsque le prix touche un niveau de pivot. Offre une personnalisation complète pour chaque type de niveau de pivot. Affiche les pivots quotidiens, hebdomadaires et mensuels de façon claire. Utilise

KT Pip Counter est un indicateur simple et informatif qui affiche en temps réel des données essentielles. Ces informations critiques peuvent être d’un grand secours pour le trader durant les phases de marché les plus intenses.
Fonctionnalités
Affiche le profit/perte actuel en devise, en pips et en pourcentage. Affiche le spread en cours. Indique le temps restant avant la clôture de la bougie en cours. Schémas de couleurs distincts selon gain ou perte. Position et mise en page du texte entièrem

Adviser-Utilitaire pour copier les transactions d'un compte MT5 ou d'un compte MT4 vers un autre compte MT4. Demo-version can be downloaded here .
Vous pouvez copier des positions entre les comptes de compensation et de couverture dans n'importe quelle combinaison. Vous pouvez définir des filtres par le nom de l'instrument et les nombres magiques des positions qui seront copiées. Jusqu'à présent, la source n'envoie des informations que sur les positions du marché. Les ordres en attente sont
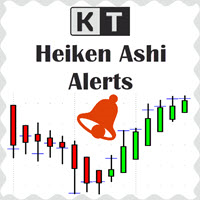
KT Heiken Ashi Alert trace les flèches d’achat et de vente et génère des alertes en se basant sur les bougies standard Heiken Ashi. C’est un outil incontournable pour les traders souhaitant intégrer Heiken Ashi dans leur stratégie de trading. Une flèche d’achat est affichée lorsque Heiken Ashi passe d’un état baissier à un état haussier. Une flèche de vente est affichée lorsque Heiken Ashi passe d’un état haussier à un état baissier. Inclut des alertes mobiles, par email, sonores et en pop-up.

KT Auto SL TP EA ajoute un stop loss et un take profit à chaque trade manuel, puis déplace le stop au break even et le fait suivre le prix avec un trailing stop. Ouvrez un trade sur votre ordinateur ou sur votre téléphone. Quelques instants plus tard, le stop loss et le take profit sont en place, et l'étiquette sur votre graphique affiche les réglages exacts utilisés. L'EA n'ouvre et ne ferme jamais un trade de lui-même. Ce qu'il fait Ajoute votre stop loss et votre take profit aux trades au mar

Magic Night is an automated trading system that uses a channel indicator and candlestick patterns to open and close trades.
Trades every day at a specific time.
Doesn't use grid, martingale or other dangerous money management methods.
Timeframe М5, currency pairs EURAUD, EURCAD, GBPCAD, GBPUSD Minimum deposit 70 usd.
Live signal https://www.mql5.com
Instructions for installing https://Blogs Magic Night
Download set files https://Sets Magic Night
Settings EA Order_Comment - Order com

Only 1 copies left at a price of $99. Next price $199!
actual .set files (click me)
interactive panel manual (click me)
Version for MT5: Smart Start Smart Start is a smart trading system, the indicators of which allow it to be used both for trading with small deposits (fast acceleration) and for conservative trading. is a modernized trading indicator system that uses the MACD indicator to analyze the market. To analyze entry points, smart start takes into account the historical indica
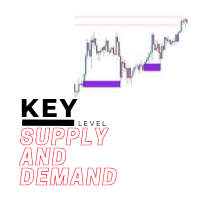
The key level supply and demand indicator is the first supply and demand indicator with options to change settings to show different zones, giving you the choice to pick the zones you see are being respected the most and saving the settings.
Advantages
The key level supply and demand DOES NOT REPAINT unlike other supply and demand currently in the market. This gives you a massive advantage to scroll back and see how price reacted on previous levels. The key level supply and demand has the opt
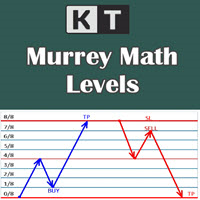
It shows the Murrey Math levels on chart and also provides an alert when price touch a particular level. T. Henning Murrey, in 1995, presented a trading system called Murrey Math Trading System, which is based on the observations made by W.D Gann.
Applications
For Murrey Math lovers, this is a must-have indicator in their arsenal. There is no need to be present on the screen all the time. Whenever the price touches a level, it will send an alert. Spot upcoming reversals in advance by speculatin
Clean & Readable Grid Lines: Time and Price at Perfect Intervals.
Displays time lines based on your custom time zone offset (Note: 30-minute offsets are not supported). It also displays price lines at clean, round intervals (e.g., 100.000, 100.010, 100.020). By default, MT4 displays grid lines based on the broker's server time and price, which often results in awkward, uneven placements that can be highly confusing. This indicator solves that by drawing grid lines exactly where you want them—at

Time frame: M1
Leverage : Higher the better
Spread: Lower the better
Account type : All types
(EA may enter hedge positions, if you want to disable this feature deactivate either Buy, or Sell from the setting)
Please please do not take unnecessary risks. (Trading is risky, and there are no guarantees for winning)
We wish you successful trading. (Trading is risky, and there are no guarantees for winning)

Run the robot on GBPUSD, H1 timeframe, minimum balance of $500 or more, ECN account type, leverage 1:100. The larger the balance, the smaller the drawdown will be. This robot analyzes the market using two indicators: ATR and Momentum. With the help of these two indicators, the robot finds points for opening trades. After the robot has opened trades, it starts to analyze them constantly. When the trade reaches the desired profit or loss, the robot closes it.
Recommendations for trading: ECN acc
Des signaux de momentum MACD clairs KT MACD Alerts aide les traders à repérer les changements de direction et de momentum du marché grâce à un affichage MACD clair et codé par couleurs. Les croisements haussiers et baissiers sont faciles à identifier, tandis que les lignes verticales sur le graphique et les alertes flexibles attirent votre attention sur chaque nouveau signal. Les signaux sont confirmés après la clôture de la bougie, offrant une lecture claire et cohérente des changements de mome

KT Fisher Transform is an advanced version of the original Fisher Transform oscillator equipped with divergence detection, crossover alerts, and many more features. Originally it was developed by John F. Ehlers. It converts the asset's price into a Gaussian normal distribution to find the local extremes in a price wave.
Features
A light-weighted oscillator that efficiently identifies the upward and downward crossovers and marks them using vertical lines. It also finds regular and hidden diverg
Le MetaTrader Market est la seule boutique où vous pouvez télécharger un robot de trading de démonstration gratuit pour le tester et l'optimiser à l'aide de données historiques.
Lisez l’aperçu de l'application et les avis d'autres clients, téléchargez-la directement sur votre terminal et testez un robot de trading avant de l'acheter. Seul MetaTrader Market vous permet de tester gratuitement une application.

Vous manquez des opportunités de trading :
- Applications de trading gratuites
- Plus de 8 000 signaux à copier
- Actualités économiques pour explorer les marchés financiers
Inscription
Se connecter
Vous acceptez la politique du site Web et les conditions d'utilisation
Si vous n'avez pas de compte, veuillez vous inscrire