Regardez les tutoriels vidéo de Market sur YouTube
Comment acheter un robot de trading ou un indicateur
Exécutez votre EA sur
hébergement virtuel
hébergement virtuel
Test un indicateur/robot de trading avant d'acheter
Vous voulez gagner de l'argent sur Market ?
Comment présenter un produit pour qu'il se vende bien
Indicateurs techniques payants pour MetaTrader 4 - 92

This Nice Trade Point indicator is designed for signal trading. This indicator generates trend signals.
It uses many algorithms and indicators to generate this signal. It tries to generate a signal from the points with the highest trend potential.
This indicator is a complete trading product. This indicator does not need any additional indicators.
The indicator certainly does not repaint. The point at which the signal is given does not change.
Features and Suggestions Time

The indicator shows price reversal points on gold and other currency pairs. Recommended periods for work: M1, M5, M15, M30, H1. The indicator analyzes the market and shows the trader with points where there is a possibility of a price reversal in the other direction. The accuracy of the signals depends on the settings, the period and the selected operating mode. On average, the accuracy of signals is up to 93%, which is suitable for intraday scalping trading. You can control the accuracy of the

L'outil identifie le mouvement réel que le marché utilise, avec de vrais calculs mathématiques basés sur les changements de prix. L'exécution de Tradeight est basée sur cette relation mathématique qui a toujours existé. La plupart des traders regardent les mêmes choses et étudient les mêmes informations, la raison pour laquelle la majorité d'entre eux perdent de l'argent. Il s'agit d'un produit basé non pas sur les idées de la majorité mais sur les 4 fondements réels qui régissent le mar

This indicator labels swing highs and swing lows as well as the candle pattern that occurred at that precise point. The indicator can detect the following 6 candle patterns: hammer , inverse hammer , bullish engulfing , hanging man , shooting star and bearish engulfing .
The notations HH, HL, LH, and LL you can see on the labels are defined as follows:
HH : Higher high
HL : Higher low
LH : Lower high
LL : Lower low
Setting
Length: Sensitivity of the swing high/low de
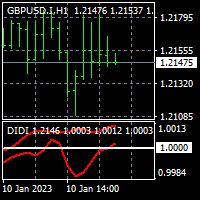
To get access to MT5 version please click here . - This is the exact conversion from TradingView: "Didi Index" by " everget ". - This is a popular version of DIDI index on tradingview. - This is a light-load processing and non-repaint indicator. - Buffer is available for the lines on chart and arrows on chart. - You can message in private chat for further changes you need. Thanks for downloading
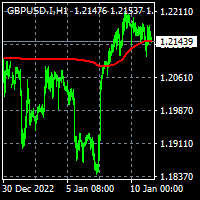
To get access to MT5 version please click here . - This is the exact conversion from TradingView: "Trend Regularity Adaptive Moving Average","TRAMA" By " LuxAlgo ". - This is a light-load processing and non-repaint indicator. - Buffer is available for the main line on chart. - You can message in private chat for further changes you need. Thanks for downloading
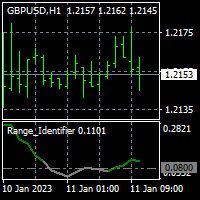
To get access to MT5 version please click here . - This is the exact conversion from TradingView: "Range Identifier" By "Mango2Juice". - All twelve averaging options are available: EMA, DEMA, TEMA, WMA, VWMA, SMA, SMMA, RMA, HMA, LSMA, Kijun, McGinley - This is a light-load processing and non-repaint indicator. - Buffer is available for the main line on chart and not for thresholds. - You can message in private chat for further changes you need.

L'analyse de plusieurs périodes d'une paire de devises dans une seule fenêtre peut vous rendre confus.
Pour analyser plusieurs échelles de temps, vous avez besoin d'indicateurs fiables.
L'un d'eux utilise 9TF Double RSI Double MA.
J'ai travaillé jour et nuit pour créer un code simple mais fiable et couvrant les neuf périodes de temps dans un seul indicateur.
Regardons quelques-uns des avantages de cet indicateur :
Double RSI, c'est-à-dire RSI plus rapide et RSI plus lent. Double MA, c

L'analyse de plusieurs périodes d'une paire de devises dans une seule fenêtre peut vous rendre confus.
Pour analyser plusieurs échelles de temps, vous avez besoin d'indicateurs fiables.
L'un d'eux utilise 9TF Double CCI Double MA.
J'ai travaillé jour et nuit pour créer un code simple mais fiable et couvrant les neuf périodes de temps dans un seul indicateur.
Regardons quelques-uns des avantages de cet indicateur :
Double CCI, c'est-à-dire CCI plus rapide et CCI plus lent. Double MA, c

Identify Engulfing candle pattern with Arrows & Alert ( built-in RSI filter). This indicator helps you to identify Engulfing candle pattern or Outside bar (OB) on the chart with arrows, along with an alert when a new Engulfing candle appears. Engulfing candle pattern is one of the most important reversal Price Action signals. You can choose between standard Engulfing (Engulfing based on candle body) or non standard Engulfing (Engulfing based on candle high - low )
Alerts can be turned on a
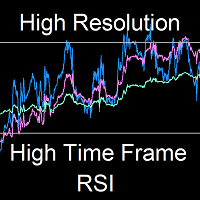
MUST READ CAUTION BEFORE PURCHASE
This one-of-a-kind indicator displays the instantaneous high resolution High Time Frame Relative Strength Index (HTF RSI), where up to three higher time-frame RSI's can be displayed simultaneously on the current chart. The indicator differs drastically from previous multi-time-frame RSI indicators in that it displays the high resolution bar-by-bar calculation of the HTF RSI - and not just the discrete values at the HTF bar closings. This allows for earlier

Identify Pinbar Candle Pattern with Arrows & Alert (built-in RSI filter).
This indicator helps you to identify Pin bar Candlestick Pattern (or shooting star & hammer pattern) on the chart with arrows, along with an alert when a new Pin bar appears. Pin bar pattern is one of the most important reversal Price Action signals.
You can set Minimum Percent of Wick (or Tail) Length over full bar length (Recommended: 60%, 70%, 75%).
Alerts can be turned on and off: Popup Email Push Notification S
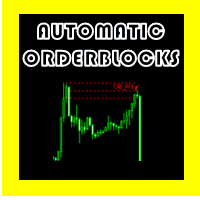
BLOCS DE COMMANDE AUTOMATIQUES OSW
(METATRADER 5)
Cet indicateur est chargé de montrer les blocs de commande selon certaines règles préétablies, parmi lesquelles :
> qu'il y a une impulsion qui brise l'impulsion précédente.
>Lorsqu'il est trouvé, il se charge de trouver le modèle de chandelier formé, de calculer de la manière la plus efficace le haut et le bas de la place, de créer le haut et le bas du bloc d'ordre.
> Une fois le bloc d'ordres créé, l'indicateur vérifie en permanence

Fibonacci por color en niveles para aplicar estrategia profesional inicialmente se coloca en el punto mas alto del dia y mas bajo con esto es para ubicar operaciones a una distancia exacta con lo cual se busca generar ganancias residuales internas en el mismo dia con esto las lineas fusias es para colocar las entrdas sell y las lineas verdes amarillas van los buy

This Trusty Strong Arrow indicator is designed for signal trading. This indicator generates trend signals.
It uses many algorithms and indicators to generate this signal. It tries to generate a signal from the points with the highest trend potential.
This indicator is a complete trading product. This indicator does not need any additional indicators.
The indicator certainly does not repaint. The point at which the signal is given does not change.
Features and Suggestions Ti
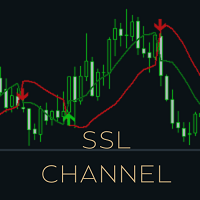
Known as the SSL , the Semaphore Signal Level channel chart alert is an indicator that combines moving averages to provide you with a clear visual signal of price movement dynamics . In short, it's designed to show you when a price trend is forming. This indicator is nothing but two 10-period simple moving averages with one applied to the high of the price and the other applied to the low of the price, therefore forming an envelope that follows the market price. The idea is to trade based on t
This is a basic indicator which is very useful for professional traders. The idea is to track every X pip movement in any symbol. It is a multicurrency indicator. So it will track the pip movements in all specified symbols. When there is absolute pip value price will appear (e.g 1.178500, 1.178600, 1.178700 ) it will signal the user in alert, mobile app and notification This pip step is configurable. This will help identify sudden movement in market as there will be lots of signals at that time
Индикатор использует сложный алгоритм, который позволяет ему обнаруживать потенциальные развороты тренда. На основе его кода, индикатор сравнивает движение цены со средним диапазоном свечей. Так же индикатор показывает места флета где появляется разворот и приостанова движения цены Работает на любой валютной паре, с любым таймфреймом Дополнительно можно встроить передачу сигналов в телеграм, Выбор цветов позволяет пользователю настроить свою цветовую гамму.

Il s'agit d'une stratégie basée sur l'action des prix connue sous le nom de 3Bar_Play et elle est basée sur la formation du modèle de chandelier 3Bar. Des indicateurs supplémentaires sont ajoutés pour le filtre et les confirmations avant l'apparition des flèches de signal d'achat/vente. Il peut être négocié sur un marché haussier, baissier ou latéral. Les indicateurs ajoutés incluent : Stochastique - Momentum Pêcheur - Tendance ATR - Volatilité qui définit également clairement le placement du S

A ready-made trading strategy for scalping on the M5 period (M5 timeframe), on any currency pair. The trading strategy has been tested and has shown good performance. Every trader, even a beginner, can scalp using this strategy. To start trading, you need to open your Metatrader4 on your PC, download the "Scalping signal indicator" from this page and add it to the chart of the currency pair you want to trade. You need to select M5 timeframe (the indicator will not work on other timeframes witho
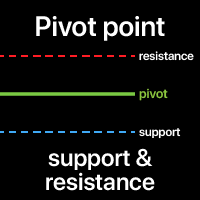
A Pivot point is used to determine the overall market trend. The pivot level itself is the average of the high and low, and the closing price from the previous bar.
On the next bar trading above the pivot point is thought to indicate ongoing bullish sentiment, while trading below the pivot point indicates bearish sentiment.
The pivot point is the basis for the indicator, but it also includes other support and resistance levels that are projected based on the pivot point. All these levels h

PSAR Scanner Dashboard for MT4:
Parabolic SAR (Stop and Release) Indicator is mainly for analyzing the trending markets. And this dashboard will look for the switch and also other strategies. Features: Scan for PSAR Switch Show how many bars back the switch happened Check ADX line is between min and max range specified Check -DI > +DI for SELL And +DI > -DI for BUY Check Higher Timeframe PSAR Alignment Check if Moving Averages are stacked in an up/down trend Free Demo:
https://abiroid.com/prod
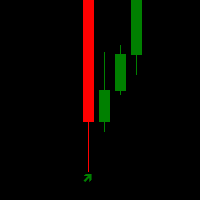
Download the filter for the indicator to work BetterVolume_1_4.mq4 https://drive.google.com/file/d/1Mgsjj7MxZn9yTjwyL7emKkfQKorl40AJ/view?usp=sharing
The arrow indicator without redrawing shows potential entry points to the market in the form of arrows of the appropriate color: the up arrows (usually green) offer to open a purchase, the red down arrows – a sale. The appearance of arrows may be accompanied by sound signals. It is usually assumed to enter at the next bar after the pointer, but

This Special Strong Arrows indicator is designed for signal trading. This indicator generates trend signals.
It uses many algorithms and indicators to generate this signal. It tries to generate signals from the points with the highest trend potential.
This indicator is a complete trading product. This indicator does not need any additional indicators.
The indicator is never repainted. The point at which the signal is given does not change. When the signal comes the arrows are put back one

the Super Smart Candles detection indicator
It detects the major breakout Candles amplified by the volume and Candle body size and shows it in a separate window to give a great indication of market power - if Bears dominates :: you will see big Red lines during the day bigger than green ones - if Bulls dominates :: you will see big Green lines during the day bigger than red ones It works on any time frames indicator inputs * frequency : from 1 t0 4 : : higher value gives more signals - l
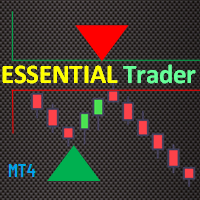
The Essential Trader indicator pinpoints the important entry areas for any trading instrument you through at it. This indicator is more comfortable with whipsaw/ranging market conditions. It is not a complicated trading indicator and can be used on any timeframe with high level of confidence. Besides, it has notifications and alerts. The dotted essential points show spots where you can make immediate entries and benefit from breakout on either side of the region. On the other hand, the color fil
This Pure Super Signal indicator is designed for signal trading. This indicator generates trend signals.
It uses many algorithms and indicators to generate this signal. It tries to generate signals from the points with the highest trend potential.
This indicator is a complete trading product. This indicator does not need any additional indicators.
The indicator is never repainted. The point at which the signal is given does not change. When the signal comes the arrows are put back one

Candle Counter This product counts the candles and shows the result according to the configuration defined by the user. Professional traders use it to emphasize a specific candlestick.
Settings Position - Choose whether the numbers will be displayed above or below the candle Distance - The distance that the number will have from the candle, referring to the minimum or maximum Font Size - Font Size Color - Font Color
The indicator is specialized for use in scalping strategies. It has the ability to send buy/sell signals. the indicator highlights signals during the formation of any fresh tick and the investor has the opportunity to apply them not alone, but taking into account the n number of specific signals for a specific time. In other texts, it is necessary to take into account which way the indicator advises trading in its own 5-7 last signals. It is not recommended to use this indicator as a single and
IconTradeSL. Возможность выставлять sl по уровням. В индикаторе установлена возможность показывать историю уровней на графике. Возможность выставлять sl по уровням. Настройки индикатора: ЦВЕТ_BAR - цвет баров по которым ищем SL
ЦВЕТ_Тек_BAR - Purple;//цвет текущего бара
BAR - поиск в последних BAR барах (по умолчанию 200)
show_bar - показывать бары по которым ищем SL

5nos. Exponential Moving Average (EMAx5) in One. A simple trend indicator for Day/Intra day trading. Perfect indicator for Price Action and clean chart traders. Features x5 Exponential Moving Averages EMA plus settings and option to choose either 1 or 2 or 3 to display on chart. A toggle button to hide/show indicator on chart while maintaining clean chart objectives. RED Off/GREEN On Set toggle button on any corner of the chart, adjust size of button and edit button text. Great analysis tool to
Êtes-vous fatigué d'être un Wall Street wanna-be, de remettre en question constamment vos échanges ? Eh bien, mettez la boule de cristal de côté et entrez dans le 21ème siècle avec l'indicateur "Current Support and Resistance" pour MT4 ! Ce mauvais garçon sera votre fidèle acolyte, analysant le marché avec une profondeur qui rendrait jaloux Sherlock Holmes. Mais ce n'est pas juste un tour de poney, oh non. Il a des options, bébé ! Vous voulez voir les niveaux de résistance et de support sur le g
This Perfective Signal System indicator is designed for signal trading. This indicator generates trend signals.
It uses many algorithms and indicators to generate this signal. It tries to generate a signal from the points with the highest trend potential.
This indicator is a complete trading product. This indicator does not need any additional indicators.
The indicator certainly does not repaint. The point at which the signal is given does not change.
Features and Suggestions

Day Points
Indicadtor that shows the points considered important for X days. (Open,Close, High, Low) Used a lot by those who do day trade. These points can be used for decision making by a trader. You will choose the amount of days ago for it to show.
Settings High/Low/Close/Open Show - True/False. Days - Number of days that will show on the chart. Color - Line Color. Style - Line Style.

Donchian Channel Sniper What is the best Donchian Channel indicator created and why? The indicator works on all time frames and assets, indicator created after 10 years of experience in forex and many other markets. You know that many volume indicators on the Internet are not complete, unhelpful and difficult to trade, but the Donchian Channel Sniper indicator is different, the Donchian Channel Sniper indicator shows the volume wave, shows the buying and selling channel of a clear way where you

Un indicateur CCI précis est disponible.
Tableau de bord Trend Bar Smart Level 9TF Double CCI. Double CCI, c'est-à-dire Fast CCI & Slow CCI Pourquoi avez-vous besoin d'une deuxième CCI ? L'utilisation d'indicateurs supplémentaires nous convaincra davantage dans le trading en direct Courbe CCI rapide 9TF 9TF Courbe CCI lente Angle CCI en temps réel 9TF Valeur CCI en temps réel 9TF Direction/phase CCI en temps réel 9TF Barre de tendance 9TF Nouvel algo dans le calcul de la barre de tendance Bou

Un indicateur RSI précis est disponible.
Dashboard Trend Bar Smart Level 9TF double rsi. Double RSI, c'est-à-dire RSI rapide et RSI lent Pourquoi avez-vous besoin du deuxième RSI? L'utilisation d'indicateurs supplémentaires nous convaincra davantage dans le trading en direct Courbe RSI 9TF Fast Courbe RSI lent 9tf Angle RSI en temps réel 9TF 9tf Valeur RSI en temps réel 9tf Direction / phase RSI en temps réel Barre de tendance 9tf Nouvel algo dans le calcul de la barre de tendance Bouton ON /

This indicator is a too that : calculates position size based on account balance/equity , currency pair, given entry level, stop-loss level and risk tolerance (set either in percentage points or in base currency). It displays reward/risk ratio based on take-profit. Shows total portfolio risk based on open trades and pending orders. Calculates margin required for new position, allows custom leverage.

L'indicateur R Silver Trend est un indicateur de trading de suivi de tendance qui affiche la tendance actuelle directement sur le graphique d'activité de Metatrader 4.
Il dessine deux types de bougies : Le bleu est pour l'action haussière des prix. Rouge pour un mouvement de prix baissier.
Le trading avec l'indicateur R Silver Trend est assez facile même pour les débutants absolus et peut être utilisé pour le scalping (M1, M5), le day trading (M5, M15, M30) et le swing trading (H1, H4, D1).

L'indicateur R Alligator a été introduit par Bill Williams, il suit la tendance à l'aide de 3 moyennes mobiles lissées.
Par défaut, les valeurs suivantes sont utilisées : La moyenne mobile lissée sur 13 périodes (connue sous le nom de Jaw) La moyenne mobile lissée sur 8 périodes (appelée les dents) La moyenne mobile lissée sur 5 périodes (connue sous le nom de Lips)
L'indicateur R Alligator réduit le nombre de fausses transactions de tendance grâce à l'utilisation de moyennes mobiles de lis

This indicator uses a combination of moving averages . Just from the get go you'll be able to identify a very easy but profitable strategy pattern (even a beginner trader won't miss it). It comes with already defined input parameters for the user . Despite the already defined parameters users can still change the COLOURS ONLY to suit their preferences or to their liking. Inbuilt parameters are hidden so you might not be able to change them all the time . If you are a trader that likes using mov

Candle High Low
Indicator showing High and Low of X candles across a line.
Settings Candle number for calculation (>= 1 ) - Define the number of candles for the indicator to find the maximum and minimum of that period of candles. Continuation of the line's display to the right - If you want the High and Low line to extend to the right edge of the graph Line High Color - Set line color Line High Style - Set line style Line Low Color - Set line color Line Low Style - Set line style

Supply and demand zones are at the heart of supply and demand trading . These zones are areas that show liquidity at a specific price. The supply zone is also called the distribution zone, while the demand zone is called the accumulation zone. Our indicator automatically draw supply and demand zones in Metatrader 5. It give opportunity to understand trading zone and avoiding risk.

Unlock the power of the market with the Investment Castle Multi Time Frame Moving Average Indicator. Simplify your trading journey by easily identifying trends and pullbacks across multiple time frames on one convenient chart. This indicator is a must-have tool for any serious trader. Available for MT4 and MT5, and exclusively on the MQL5 market, customize your experience by adding as many indicators as you need on the chart, each with their own unique time frame or period. Enhance your strategy

L'indicateur R Wolfe Wave analyse l'action des prix et transforme les données accumulées en un puissant outil technique de modèle graphique Wolfe Wave. Essentiellement, le modèle de graphique R Wolfe Wave peut être haussier ou baissier et peut aider les traders à ouvrir des transactions d'achat et de vente sans aucun indicateur retardé.
Points clés Identifie les puissants modèles Wolfe Wave Pour les commerçants avancés Fonctionne pour n'importe quelle paire de devises Cela vaut la peine d'êtr

Un indicateur MACD précis est disponible.
Barre de tendance du tableau de bord Smart Level 9TF Double MACD. Double MACD, c'est-à-dire rapide (MACD 1) et lent (MACD 2) Pourquoi avez-vous besoin d'un deuxième MACD ? L'utilisation d'indicateurs supplémentaires nous convaincra davantage dans le trading en direct Courbe MACD 1 rapide 9TF Courbe MACD 2 lente 9TF Angle MACD en temps réel 9TF Valeur MACD en temps réel 9TF Direction MACD en temps réel 9TF Un indicateur MACD précis est disponible.
Ba

Un indicateur stochastique précis est disponible.
Barre de tendance du tableau de bord Smart Level 9TF Dual Stochastic. Stochastique double, c'est-à-dire stochastique rapide et stochastique lent Pourquoi avez-vous besoin d'un deuxième stochastique ? L'utilisation d'indicateurs supplémentaires nous convaincra davantage dans le trading en direct Courbe stochastique rapide 9TF 9TF Courbe stochastique lente Angle stochastique en temps réel 9TF 9TF valeur stochastique en temps réel Direction/phase
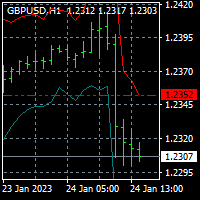
For MT5 version please click here . This is the exact conversion from TradingView: "Average True Range Stop Loss Finder" By "veryfid". - This indicator implements a deviation channel. - The channel determines trend direction as well as stop loss placement. - This is a non-repaint and light processing load indicator. - You can message in private chat for further changes you need.

Shows the price fluctuation bands associated with a moving average. It is extremely accurate, and it's a wonderful visual guide. The indicator consists of 4 bands . The two bands closest to the price form the fluctuation channel , they mark the maximum calculated deviation of the price from the moving average. The outer bands mark the maximum overdeviation of the price with respect to the fluctuation channel, they are overbought or oversold areas. Features. -The change of periods of the MA is d

Cet indicateur utilise plusieurs indicateurs pour générer des transactions de signaux très gagnantes L'indicateur R Signals est un système de trading FX complet qui imprime des flèches d'achat et de vente précises sur le graphique.
L'indicateur apparaît dans la fenêtre principale du graphique MT4 sous forme de flèches colorées vertes et rouges.
L'utilisation de signaux générés par un seul indicateur peut être risquée lors de la négociation. En effet, l'utilisation d'un seul indicateur pour

CFF Way Up Trading System
CFF Way Up is the best trading System for Reversal & Trend Following whether you are scalper trader, Medium trader or Long Term trader, It’s providing marvelous trading signals based on such and amazing algorithm.
*** 3 Copies left for next price $690***
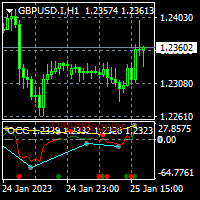
For MT5 version please click here . This is the exact conversion from TradingView: "Open Close Cross Alert R6.2 by JustUncleL" By "JayRogers". - This indicator does not support multi-time frame. - Hidden/Regular divergences supported. - This is a non-repaint and light processing load indicator. - You can message in private chat for further changes you need.
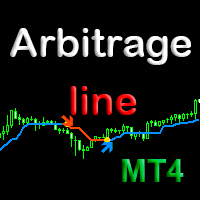
Индикатор Arbitrage line является арбитражным корреляционным мультивалютным индикатором. Он показывает на текущем графике места нарушения корреляции - где направление движения цены текущего графика, противоположно направлению цены любой выбранной в индикаторе валютной пары. Arbitrage line идеально подходит для торговли при помощи арбитража корреляции на любых символах ( поддерживаемых Meta Trader) валют, металлов, криптовалют, акций и индексов. Места дисбаланса - нарушения корреляции, индикато

L'indicateur R 2EMA Color pour MT4 fournit des signaux de trading solides basés sur le croisement de 2 EMA.
Points clés Lorsque le prix croise et clôture au-dessus des deux EMA vertes, cela crée un signal d'achat. Lorsque le prix croise et clôture au-dessus des deux EMA rouges, cela crée un signal commercial de vente. L'indicateur R 2EMA Color Forex permet de déterminer encore plus facilement quand il est temps d'acheter et de vendre
Un signal d'achat se produit lorsque les 2 lignes EMA dev

L'indicateur de moyenne mobile R Var est un indicateur de suivi de tendance conçu pour les suiveurs de tendance inconditionnels.
Il s'agit d'un indicateur de trading forex très populaire parmi les négociants en actions, ainsi que les négociants en matières premières, et sa popularité découle de sa capacité à fournir de véritables signaux de création d'argent à ses utilisateurs.
L'indicateur est composé de points verts et rouges placés sur une ligne de terre de sienne. Le point vert pointe v

UR Gamma (alimenté par des calculs similaires trouvés dans les systèmes d'apprentissage automatique)
UR Gamma est un outil d'analyse financière de pointe qui offre une version nouvelle et améliorée de l'indicateur classique WaveTrend. En incorporant des techniques avancées de traitement du signal numérique, UR Gamma répond à certaines des limites des algorithmes WaveTrend traditionnels et fournit une approche plus précise, robuste et dynamique pour identifier et mesurer les tendances de l'act

L'indicateur R Wavy Dash transforme les données de prix en un excellent indicateur de signaux de suivi de tendance qui fonctionne pour l'entrée et la sortie des échanges. Il apparaît dans le graphique principal sous la forme d'une ligne de signaux colorée et peut être utilisé comme un outil de trading autonome.
L'indicateur R Wavy Dash est très fiable, léger et ne ralentira pas votre plateforme de trading.
Points clés Indicateur de signal de tendance Convivial pour les débutants Non-repeint
The ALL MOVING AVERAGES Metatrader 4 Custom Indicator provides a comprehensive suite of moving averages for technical analysis offering over 31 of the most popular moving averages .
All of these averages can be customized to fit various trading strategies , with users able to choose from a variety of input parameters including period and price calculation types.
The indicator also provides a smooth charting experience , with users having the ability to toggle between chart styles, turn t
"IF YOU'RE LOOKING FOR A UNIQUE TRADING APPROACH TO TRADING…AT AN AFFORDABLE PRICE…YOU'VE COME TO THE RIGHT PLACE!" Buy DayTradingArrow v1 Indicator And You Will Get Forex Trend Commander Indicator for FREE !
In forex trading, like any business, there are some rules that must be followed, which are disturbing for now, many adhere to the rule that if a system has losses, it is not profitable. To create the PERFECT strategy, the Perfect one for you, you need to experiment with all ways and fo

Deviation has a buy and sell input. Figure out the number to trade by. It is according to MACD. Study the values of the past for inputs to trade by. Use in uptrend or downtrend and follow the bigger trend for entry points or reversals. Use other filters or strategies to employ with the indicator for success. - is buy and + is sell. Trade on time frames according to your wish
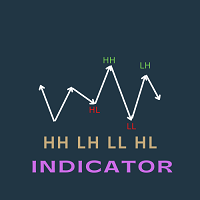
This indicator is very useful to identify the most important patterns of price action strategy. It uses the fractal indicator to identify the highs and lows. It can identify the following four patterns to identify continuation and reversal of a trend Patterns shown in the chart Higher Highs Lower Highs Lower Lows Higher Lows These patterns are visible in the chart . and the most interesting part of this indicator is all of these patterns are stored in different buffer values. Developers can util

L'indicateur R Show Ticks pour Metatrader 4 affiche les ticks haut/bas en temps réel sur la fenêtre de trading principale.
Points clés à retenir Une flèche blanche est une hausse. Une flèche rouge est un downtick. L'indicateur fonctionne pour n'importe quelle paire de devises et la période de votre choix.
Spécifications de l'indicateur Plateforme de trading : Développée pour Metatrader 4 (MT4)
Paires de devises : Fonctionne pour n'importe quelle paire
Périodes : Fonctionne pour n'import
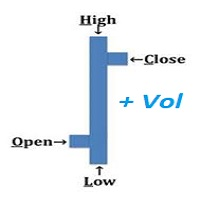
An "Intraday" indicator makes no sense anymore above H1 !! VOHLC is calculated using the following formula: VOHLC= ( Price * Volume ) / Volume Where Price= ( Open + High + Low + Close ) / 4 Volume= Tick Volume This indicator helps us to understand the current direction of the trend in the selected period. Typically, the indicator is calculated for one day, so there is no reason to use it on timeframes larger than the H1 timeframe.
This is a breakout Indicator for MT4 where you can open trades after a breakout has occurred. This indicator will draw blue boxes on the chart. You simply have to follow price until it breaks out of the box and make sure that the candle had closed above the breakout if its a buy trade and the candle must close below if its a sell trade. An alert will now pop up with suggested price entry and TP of 15 pips default. You can change TP Pis depending on your choice The indicator can trade almost any

L'indicateur R Delta RSI dessine un histogramme coloré d'achat et de vente basé sur le croisement d'un RSI rapide (période 14) et d'un RSI lent (période 50) avec un niveau de signal.
Un histogramme de couleur rouge indique que la tendance est haussière (signal d'achat). Un histogramme de couleur verte indique que la tendance est baissière (signal de vente). Un histogramme de couleur grise indique que la tendance est plate ou liée à la plage (pas de signal).
Cet indicateur forex peut être né
Bandes UR (avec une formule utilisée dans les systèmes d'apprentissage automatique)
UR Bands est un indicateur dérivé d'une formule qui intègre la volatilité du marché est similaire en principe à ceux utilisés dans les systèmes d'apprentissage automatique. Cette représentation mathématique des conditions de marché offre une analyse précise des tendances et de la dynamique des prix, en tenant compte de la volatilité inhérente aux marchés financiers. En incorporant la volatilité comme variable,
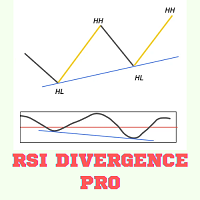
RSI DIVERENCE INDICATOR
RSI divergence is very powerful pattern which is often used to detect a strong trend reversal. it also indicates the weakening of strong signal. So some traders want to use it as the exit criteria. This indicator works in all timeframe and send notification, alert or email to the user. It also show the Higher Highs and Lower Low Pattern with its corresponding RSI divergency. This indicator can be used in Expert Advisors as it has accessible buffers List of Inputs _____

FRB Time - FRB Trader
Indicator that shows the server's time of operation. You can edit the font color and size of the timetable.
Settings font color Font size Background color
To move the Timetable, just click on it and move the mouse to where you want to leave it. After placing the Time where you want it, click again or press "ESC" and the time will stay where you left it.

FRB Candle Time
Indicator showing the time left for the next candle You can edit font color and size. Very important indicator for Traders. To move time, just click on it and move the mouse to where you want to leave it. After positioning the time where you want it, click again or press "ESC" and the time will stay where you left it.
Settings font color Font size Background color
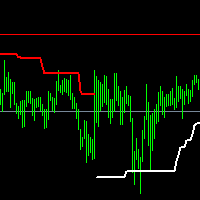
SPT is a trend indicator It is written on the basis of ATR, with clear trend lines indicating the direction in progress, Different traders' understanding of this indicator may form two different purposes Trend-based traders will conduct trend trading when the trend line changes, Respectful shock traders will carry out range trading according to the final support or resistance level marked by this indicator
The index parameters are as follows: Multiplier: multiple of ATR Period: ATR cycle. The
Découvrez comment acheter un robot de trading sur le MetaTrader Market, le magasin d'applications de la plateforme MetaTrader.
e système de paiement de MQL5.community prend en charge les transactions via PayPal, les cartes bancaires et les systèmes de paiement populaires. Nous vous recommandons vivement de tester le robot de trading avant de l'acheter, pour une meilleure expérience client.
Vous manquez des opportunités de trading :
- Applications de trading gratuites
- Plus de 8 000 signaux à copier
- Actualités économiques pour explorer les marchés financiers
Inscription
Se connecter
Si vous n'avez pas de compte, veuillez vous inscrire
Autorisez l'utilisation de cookies pour vous connecter au site Web MQL5.com.
Veuillez activer les paramètres nécessaires dans votre navigateur, sinon vous ne pourrez pas vous connecter.