Guarda i video tutorial del Market su YouTube
Come acquistare un Robot di Trading o un indicatore
Esegui il tuo EA
hosting virtuale
hosting virtuale
Prova un indicatore/robot di trading prima di acquistarlo
Vuoi guadagnare nel Market?
Come presentare un prodotto per venderlo con successo
Indicatori tecnici a pagamento per MetaTrader 4 - 92
MUST READ CAUTION BEFORE PURCHASE
This one-of-a-kind indicator displays the instantaneous high resolution High Time Frame Relative Strength Index (HTF RSI), where up to three higher time-frame RSI's can be displayed simultaneously on the current chart. The indicator differs drastically from previous multi-time-frame RSI indicators in that it displays the high resolution bar-by-bar calculation of the HTF RSI - and not just the discrete values at the HTF bar closings. This allows for earlier

Identify Pinbar Candle Pattern with Arrows & Alert (built-in RSI filter).
This indicator helps you to identify Pin bar Candlestick Pattern (or shooting star & hammer pattern) on the chart with arrows, along with an alert when a new Pin bar appears. Pin bar pattern is one of the most important reversal Price Action signals.
You can set Minimum Percent of Wick (or Tail) Length over full bar length (Recommended: 60%, 70%, 75%).
Alerts can be turned on and off: Popup Email Push Notification S
ORDERBLOCK AUTOMATICI OSW
(METATRADER 5)
Questo indicatore ha il compito di mostrare i Blocchi di ordini secondo alcune regole prestabilite, tra cui:
>che c'è un impulso che rompe l'impulso precedente.
>Quando viene trovato, è incaricato di trovare il modello di candele formato, calcolare nel modo più efficiente il massimo e il minimo del luogo, per creare il massimo e il minimo del Blocco ordini.
>Dopo la creazione del blocco ordini, l'indicatore controlla costantemente se un candela

Fibonacci por color en niveles para aplicar estrategia profesional inicialmente se coloca en el punto mas alto del dia y mas bajo con esto es para ubicar operaciones a una distancia exacta con lo cual se busca generar ganancias residuales internas en el mismo dia con esto las lineas fusias es para colocar las entrdas sell y las lineas verdes amarillas van los buy

This Trusty Strong Arrow indicator is designed for signal trading. This indicator generates trend signals.
It uses many algorithms and indicators to generate this signal. It tries to generate a signal from the points with the highest trend potential.
This indicator is a complete trading product. This indicator does not need any additional indicators.
The indicator certainly does not repaint. The point at which the signal is given does not change.
Features and Suggestions Ti
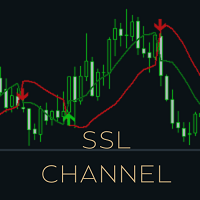
Known as the SSL , the Semaphore Signal Level channel chart alert is an indicator that combines moving averages to provide you with a clear visual signal of price movement dynamics . In short, it's designed to show you when a price trend is forming. This indicator is nothing but two 10-period simple moving averages with one applied to the high of the price and the other applied to the low of the price, therefore forming an envelope that follows the market price. The idea is to trade based on t
This is a basic indicator which is very useful for professional traders. The idea is to track every X pip movement in any symbol. It is a multicurrency indicator. So it will track the pip movements in all specified symbols. When there is absolute pip value price will appear (e.g 1.178500, 1.178600, 1.178700 ) it will signal the user in alert, mobile app and notification This pip step is configurable. This will help identify sudden movement in market as there will be lots of signals at that time
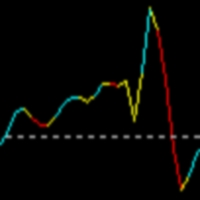
Индикатор использует сложный алгоритм, который позволяет ему обнаруживать потенциальные развороты тренда. На основе его кода, индикатор сравнивает движение цены со средним диапазоном свечей. Так же индикатор показывает места флета где появляется разворот и приостанова движения цены Работает на любой валютной паре, с любым таймфреймом Дополнительно можно встроить передачу сигналов в телеграм, Выбор цветов позволяет пользователю настроить свою цветовую гамму.

Questa è una strategia basata sull'azione del prezzo nota come 3Bar_Play e si basa sulla formazione del modello a candelabro 3Bar. Ulteriori indicatori vengono aggiunti per il filtro e le conferme prima di far apparire le frecce del segnale di acquisto/vendita. Può essere scambiato in un mercato rialzista, ribassista o laterale. Gli indicatori aggiunti includono: Stocastico - Momento Pescatore - Tendenza ATR - Volatilità che definisce chiaramente anche il posizionamento dello Stop-Loss alla bas

A ready-made trading strategy for scalping on the M5 period (M5 timeframe), on any currency pair. The trading strategy has been tested and has shown good performance. Every trader, even a beginner, can scalp using this strategy. To start trading, you need to open your Metatrader4 on your PC, download the "Scalping signal indicator" from this page and add it to the chart of the currency pair you want to trade. You need to select M5 timeframe (the indicator will not work on other timeframes witho
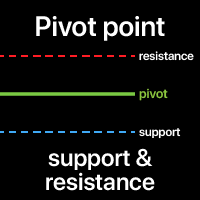
A Pivot point is used to determine the overall market trend. The pivot level itself is the average of the high and low, and the closing price from the previous bar.
On the next bar trading above the pivot point is thought to indicate ongoing bullish sentiment, while trading below the pivot point indicates bearish sentiment.
The pivot point is the basis for the indicator, but it also includes other support and resistance levels that are projected based on the pivot point. All these levels h

PSAR Scanner Dashboard for MT4:
Parabolic SAR (Stop and Release) Indicator is mainly for analyzing the trending markets. And this dashboard will look for the switch and also other strategies. Features: Scan for PSAR Switch Show how many bars back the switch happened Check ADX line is between min and max range specified Check -DI > +DI for SELL And +DI > -DI for BUY Check Higher Timeframe PSAR Alignment Check if Moving Averages are stacked in an up/down trend Free Demo:
https://abiroid.com/prod
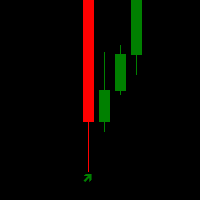
Download the filter for the indicator to work BetterVolume_1_4.mq4 https://drive.google.com/file/d/1Mgsjj7MxZn9yTjwyL7emKkfQKorl40AJ/view?usp=sharing
The arrow indicator without redrawing shows potential entry points to the market in the form of arrows of the appropriate color: the up arrows (usually green) offer to open a purchase, the red down arrows – a sale. The appearance of arrows may be accompanied by sound signals. It is usually assumed to enter at the next bar after the pointer, but

This Special Strong Arrows indicator is designed for signal trading. This indicator generates trend signals.
It uses many algorithms and indicators to generate this signal. It tries to generate signals from the points with the highest trend potential.
This indicator is a complete trading product. This indicator does not need any additional indicators.
The indicator is never repainted. The point at which the signal is given does not change. When the signal comes the arrows are put back one

the Super Smart Candles detection indicator
It detects the major breakout Candles amplified by the volume and Candle body size and shows it in a separate window to give a great indication of market power - if Bears dominates :: you will see big Red lines during the day bigger than green ones - if Bulls dominates :: you will see big Green lines during the day bigger than red ones It works on any time frames indicator inputs * frequency : from 1 t0 4 : : higher value gives more signals - l
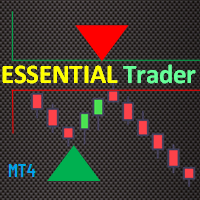
The Essential Trader indicator pinpoints the important entry areas for any trading instrument you through at it. This indicator is more comfortable with whipsaw/ranging market conditions. It is not a complicated trading indicator and can be used on any timeframe with high level of confidence. Besides, it has notifications and alerts. The dotted essential points show spots where you can make immediate entries and benefit from breakout on either side of the region. On the other hand, the color fil
This Pure Super Signal indicator is designed for signal trading. This indicator generates trend signals.
It uses many algorithms and indicators to generate this signal. It tries to generate signals from the points with the highest trend potential.
This indicator is a complete trading product. This indicator does not need any additional indicators.
The indicator is never repainted. The point at which the signal is given does not change. When the signal comes the arrows are put back one

Candle Counter This product counts the candles and shows the result according to the configuration defined by the user. Professional traders use it to emphasize a specific candlestick.
Settings Position - Choose whether the numbers will be displayed above or below the candle Distance - The distance that the number will have from the candle, referring to the minimum or maximum Font Size - Font Size Color - Font Color
The indicator is specialized for use in scalping strategies. It has the ability to send buy/sell signals. the indicator highlights signals during the formation of any fresh tick and the investor has the opportunity to apply them not alone, but taking into account the n number of specific signals for a specific time. In other texts, it is necessary to take into account which way the indicator advises trading in its own 5-7 last signals. It is not recommended to use this indicator as a single and
IconTradeSL. Возможность выставлять sl по уровням. В индикаторе установлена возможность показывать историю уровней на графике. Возможность выставлять sl по уровням. Настройки индикатора: ЦВЕТ_BAR - цвет баров по которым ищем SL
ЦВЕТ_Тек_BAR - Purple;//цвет текущего бара
BAR - поиск в последних BAR барах (по умолчанию 200)
show_bar - показывать бары по которым ищем SL

5nos. Exponential Moving Average (EMAx5) in One. A simple trend indicator for Day/Intra day trading. Perfect indicator for Price Action and clean chart traders. Features x5 Exponential Moving Averages EMA plus settings and option to choose either 1 or 2 or 3 to display on chart. A toggle button to hide/show indicator on chart while maintaining clean chart objectives. RED Off/GREEN On Set toggle button on any corner of the chart, adjust size of button and edit button text. Great analysis tool to
Sei stanco di essere un Wall Street wanna-be, di rimettere in discussione costantemente le tue operazioni? Bene, metti via la sfera di cristallo e entra nel 21 secolo con l'indicatore "Current Support and Resistance" per MT4! Questo ragazzo cattivo sarà il tuo fedele compagno, analizzando il mercato con una profondità che farebbe invidia a Sherlock Holmes. Ma non è solo un trucco da cavallo, oh no. Ha delle opzioni, bambino! Vuoi vedere i livelli di resistenza e supporto sull'1-minuto grafico?
This Perfective Signal System indicator is designed for signal trading. This indicator generates trend signals.
It uses many algorithms and indicators to generate this signal. It tries to generate a signal from the points with the highest trend potential.
This indicator is a complete trading product. This indicator does not need any additional indicators.
The indicator certainly does not repaint. The point at which the signal is given does not change.
Features and Suggestions

Day Points
Indicadtor that shows the points considered important for X days. (Open,Close, High, Low) Used a lot by those who do day trade. These points can be used for decision making by a trader. You will choose the amount of days ago for it to show.
Settings High/Low/Close/Open Show - True/False. Days - Number of days that will show on the chart. Color - Line Color. Style - Line Style.

Donchian Channel Sniper What is the best Donchian Channel indicator created and why? The indicator works on all time frames and assets, indicator created after 10 years of experience in forex and many other markets. You know that many volume indicators on the Internet are not complete, unhelpful and difficult to trade, but the Donchian Channel Sniper indicator is different, the Donchian Channel Sniper indicator shows the volume wave, shows the buying and selling channel of a clear way where you

È disponibile un accurato indicatore CCI.
Cruscotto Trend Bar Smart Level 9TF Doppio CCI. Doppio CCI, ovvero CCI veloce e CCI lento Perché hai bisogno di un secondo CCI? L'utilizzo di indicatori aggiuntivi ci convincerà di più nel trading dal vivo 9TF Curva CCI veloce 9TF Curva CCI lenta Angolo CCI in tempo reale 9TF Valore CCI in tempo reale 9TF Direzione/fase CCI in tempo reale 9TF Barra di tendenza 9TF Nuovo algoritmo per il calcolo della barra dei trend Pulsante di accensione/spegnimento.

È disponibile un accurato indicatore RSI.
Cruscotto Trend Bar Smart Level 9TF Doppio RSI. Doppio RSI, ovvero RSI veloce e RSI lento Perché hai bisogno di un secondo RSI? L'utilizzo di indicatori aggiuntivi ci convincerà di più nel trading dal vivo 9TF Curva RSI veloce 9TF Curva RSI lenta Angolo RSI in tempo reale 9TF Valore RSI in tempo reale 9TF Direzione/fase RSI in tempo reale 9TF Barra di tendenza 9TF Nuovo algoritmo per il calcolo della barra dei trend Pulsante di accensione/spegnimento.

This indicator is a too that : calculates position size based on account balance/equity , currency pair, given entry level, stop-loss level and risk tolerance (set either in percentage points or in base currency). It displays reward/risk ratio based on take-profit. Shows total portfolio risk based on open trades and pending orders. Calculates margin required for new position, allows custom leverage.

L'indicatore R Silver Trend è un indicatore di trading che segue la tendenza che mostra la tendenza attuale direttamente sul grafico delle attività di Metatrader 4.
Disegna due tipi di candele: Il blu è per l'azione dei prezzi rialzista. Rosso per movimento di prezzo ribassista.
Il trading con l'indicatore R Silver Trend è abbastanza semplice anche per i principianti assoluti e può essere utilizzato per le valute scalping (M1, M5), day trading (M5, M15, M30) e swing trading (H1, H4, D1).

L'indicatore R Alligator è stato introdotto da Bill Williams, segue la tendenza con l'aiuto di 3 medie mobili levigate.
Per impostazione predefinita, vengono utilizzati i seguenti valori: La media mobile livellata a 13 periodi (nota come Jaw) La media mobile livellata a 8 periodi (nota come Denti) La media mobile livellata a 5 periodi (nota come Lips)
L'indicatore R Alligator riduce il numero di scambi di false tendenze attraverso l'uso di medie mobili uniformanti.
Segnali di trading di b

This indicator uses a combination of moving averages . Just from the get go you'll be able to identify a very easy but profitable strategy pattern (even a beginner trader won't miss it). It comes with already defined input parameters for the user . Despite the already defined parameters users can still change the COLOURS ONLY to suit their preferences or to their liking. Inbuilt parameters are hidden so you might not be able to change them all the time . If you are a trader that likes using mov

Candle High Low
Indicator showing High and Low of X candles across a line.
Settings Candle number for calculation (>= 1 ) - Define the number of candles for the indicator to find the maximum and minimum of that period of candles. Continuation of the line's display to the right - If you want the High and Low line to extend to the right edge of the graph Line High Color - Set line color Line High Style - Set line style Line Low Color - Set line color Line Low Style - Set line style

Supply and demand zones are at the heart of supply and demand trading . These zones are areas that show liquidity at a specific price. The supply zone is also called the distribution zone, while the demand zone is called the accumulation zone. Our indicator automatically draw supply and demand zones in Metatrader 5. It give opportunity to understand trading zone and avoiding risk.

Unlock the power of the market with the Investment Castle Multi Time Frame Moving Average Indicator. Simplify your trading journey by easily identifying trends and pullbacks across multiple time frames on one convenient chart. This indicator is a must-have tool for any serious trader. Available for MT4 and MT5, and exclusively on the MQL5 market, customize your experience by adding as many indicators as you need on the chart, each with their own unique time frame or period. Enhance your strategy

L'indicatore R Wolfe Wave analizza l'azione dei prezzi e trasforma i dati accumulati in un potente strumento tecnico del modello grafico Wolfe Wave. In sostanza, il modello grafico R Wolfe Wave può essere rialzista o ribassista e potrebbe aiutare i trader ad aprire operazioni di acquisto e vendita senza alcun indicatore di ritardo.
Punti chiave Identifica potenti modelli Wolfe Wave Per trader avanzati Funziona per qualsiasi coppia di valute Vale la pena aggiungere alla tua collezione di indic

È disponibile un indicatore MACD accurato.
Cruscotto Trend Bar Smart Level 9TF Doppio MACD. Doppio MACD, ovvero veloce (MACD 1) e lento (MACD 2) Perché hai bisogno di un secondo MACD? L'utilizzo di indicatori aggiuntivi ci convincerà di più nel trading dal vivo Curva MACD 1 veloce da 9TF 9TF Curva MACD 2 lenta Angolo MACD in tempo reale 9TF Valore MACD in tempo reale 9TF 9TF direzione MACD in tempo reale È disponibile un indicatore MACD accurato.
Cruscotto Trend Bar Smart Level 9TF Doppio M

È disponibile un accurato indicatore stocastico.
Dashboard Trend Bar Smart Level 9TF Dual Stochastic. Doppio stocastico, ovvero stocastico veloce e stocastico lento Perché hai bisogno del secondo stocastico? L'utilizzo di indicatori aggiuntivi ci convincerà di più nel trading dal vivo 9TF Curva stocastica veloce 9TF Curva stocastica lenta Angolo stocastico in tempo reale 9TF 9TF valore stocastico in tempo reale 9TF direzione/fase stocastica in tempo reale Barra di tendenza 9TF Nuovo algoritmo
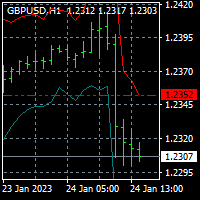
For MT5 version please click here . This is the exact conversion from TradingView: "Average True Range Stop Loss Finder" By "veryfid". - This indicator implements a deviation channel. - The channel determines trend direction as well as stop loss placement. - This is a non-repaint and light processing load indicator. - You can message in private chat for further changes you need.

Shows the price fluctuation bands associated with a moving average. It is extremely accurate, and it's a wonderful visual guide. The indicator consists of 4 bands . The two bands closest to the price form the fluctuation channel , they mark the maximum calculated deviation of the price from the moving average. The outer bands mark the maximum overdeviation of the price with respect to the fluctuation channel, they are overbought or oversold areas. Features. -The change of periods of the MA is d

Questo indicatore utilizza più indicatori per generare scambi di segnali vincenti L'indicatore R Signals è un sistema di trading FX completo che stampa accurate frecce di acquisto e vendita sul grafico.
L'indicatore appare nella finestra principale del grafico MT4 come frecce colorate di verde e rosso.
L'utilizzo di segnali generati da un singolo indicatore può essere rischioso durante il trading. Questo perché l'utilizzo di un solo indicatore per fare trading può dare più falsi segnali. Pe

CFF Way Up Trading System
CFF Way Up is the best trading System for Reversal & Trend Following whether you are scalper trader, Medium trader or Long Term trader, It’s providing marvelous trading signals based on such and amazing algorithm.
*** 3 Copies left for next price $690***
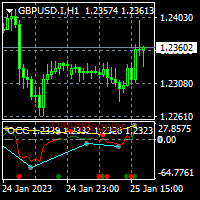
For MT5 version please click here . This is the exact conversion from TradingView: "Open Close Cross Alert R6.2 by JustUncleL" By "JayRogers". - This indicator does not support multi-time frame. - Hidden/Regular divergences supported. - This is a non-repaint and light processing load indicator. - You can message in private chat for further changes you need.
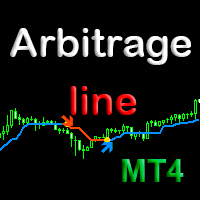
Индикатор Arbitrage line является арбитражным корреляционным мультивалютным индикатором. Он показывает на текущем графике места нарушения корреляции - где направление движения цены текущего графика, противоположно направлению цены любой выбранной в индикаторе валютной пары. Arbitrage line идеально подходит для торговли при помощи арбитража корреляции на любых символах ( поддерживаемых Meta Trader) валют, металлов, криптовалют, акций и индексов. Места дисбаланса - нарушения корреляции, индикато

L'indicatore di colore R 2EMA per MT4 fornisce solidi segnali di trading basati sul crossover di 2 EMA.
Punti chiave Quando il prezzo incrocia e chiude al di sopra dei due EMA verdi, crea un segnale di acquisto. Quando il prezzo incrocia e chiude al di sopra dei due EMA rossi, crea un segnale commerciale di vendita. L'indicatore R 2EMA Color Forex rende ancora più facile determinare quando è il momento di acquistare e vendere
Un segnale di acquisto si verifica quando le 2 linee EMA diventan

L'indicatore della media mobile R Var è un indicatore che segue la tendenza progettato per i seguaci di tendenza irriducibili.
È un indicatore di trading forex piuttosto popolare tra i trader di borsa, così come i trader di materie prime, e la sua popolarità deriva dalla sua capacità di fornire segnali di guadagno genuino ai suoi utenti.
L'indicatore è composto da punti verdi e rossi posizionati su una linea terra di Siena. Il punto verde indica un segnale rialzista, mentre il punto rosso r

UR Gamma (alimentato da calcoli simili trovati nei sistemi di Machine Learning)
UR Gamma è uno strumento di analisi finanziaria all'avanguardia che offre una versione nuova e migliorata del classico indicatore WaveTrend. Incorporando tecniche avanzate di elaborazione del segnale digitale, UR Gamma risolve alcuni dei limiti degli algoritmi WaveTrend tradizionali e fornisce un approccio più accurato, robusto e dinamico per identificare e misurare le tendenze nell'azione dei prezzi.
Vantaggi d

L'indicatore R Wavy Dash trasforma i dati sui prezzi in un eccellente indicatore di segnali che segue la tendenza che funziona per l'entrata e l'uscita dal commercio. Appare nel grafico principale come una linea di segnali colorati e può essere utilizzato come strumento di trading autonomo.
L'indicatore R Wavy Dash è molto affidabile, leggero e non rallenterà la tua piattaforma di trading.
Punti chiave Indicatore del segnale di tendenza Amichevole per i principianti Non riverniciare Vale la
The ALL MOVING AVERAGES Metatrader 4 Custom Indicator provides a comprehensive suite of moving averages for technical analysis offering over 31 of the most popular moving averages .
All of these averages can be customized to fit various trading strategies , with users able to choose from a variety of input parameters including period and price calculation types.
The indicator also provides a smooth charting experience , with users having the ability to toggle between chart styles, turn t
"IF YOU'RE LOOKING FOR A UNIQUE TRADING APPROACH TO TRADING…AT AN AFFORDABLE PRICE…YOU'VE COME TO THE RIGHT PLACE!" Buy DayTradingArrow v1 Indicator And You Will Get Forex Trend Commander Indicator for FREE !
In forex trading, like any business, there are some rules that must be followed, which are disturbing for now, many adhere to the rule that if a system has losses, it is not profitable. To create the PERFECT strategy, the Perfect one for you, you need to experiment with all ways and fo

Deviation has a buy and sell input. Figure out the number to trade by. It is according to MACD. Study the values of the past for inputs to trade by. Use in uptrend or downtrend and follow the bigger trend for entry points or reversals. Use other filters or strategies to employ with the indicator for success. - is buy and + is sell. Trade on time frames according to your wish
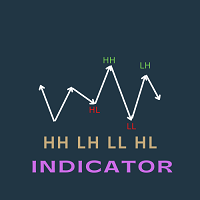
This indicator is very useful to identify the most important patterns of price action strategy. It uses the fractal indicator to identify the highs and lows. It can identify the following four patterns to identify continuation and reversal of a trend Patterns shown in the chart Higher Highs Lower Highs Lower Lows Higher Lows These patterns are visible in the chart . and the most interesting part of this indicator is all of these patterns are stored in different buffer values. Developers can util

L'indicatore R Show Ticks per Metatrader 4 mostra i tick su/giù in tempo reale nella finestra di trading principale.
Punti chiave Una freccia bianca è un aumento. Una freccia rossa è un downtick. L'indicatore funziona per qualsiasi coppia di valute e periodo di tempo di tua preferenza.
Specifiche dell'indicatore Piattaforma di trading: sviluppata per Metatrader 4 (MT4)
Coppie di valute: funziona per qualsiasi coppia
Intervalli di tempo: funziona per qualsiasi intervallo di tempo
Param
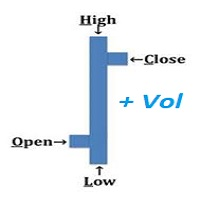
An "Intraday" indicator makes no sense anymore above H1 !! VOHLC is calculated using the following formula: VOHLC= ( Price * Volume ) / Volume Where Price= ( Open + High + Low + Close ) / 4 Volume= Tick Volume This indicator helps us to understand the current direction of the trend in the selected period. Typically, the indicator is calculated for one day, so there is no reason to use it on timeframes larger than the H1 timeframe.
This is a breakout Indicator for MT4 where you can open trades after a breakout has occurred. This indicator will draw blue boxes on the chart. You simply have to follow price until it breaks out of the box and make sure that the candle had closed above the breakout if its a buy trade and the candle must close below if its a sell trade. An alert will now pop up with suggested price entry and TP of 15 pips default. You can change TP Pis depending on your choice The indicator can trade almost any

L'indicatore R Delta RSI disegna un istogramma colorato di acquisto e vendita basato sull'incrocio di un RSI veloce (periodo 14) e di un RSI lento (periodo 50) insieme a un livello di segnale.
Un istogramma di colore rosso indica che la tendenza è rialzista (segnale di acquisto). Un istogramma di colore verde indica che il trend è ribassista (segnale di vendita). Un istogramma di colore grigio indica che la tendenza è piatta o in range (nessun segnale).
Questo indicatore forex può essere sc
Bande UR (con una formula utilizzata nei sistemi di Machine Learning)
UR Bands è un indicatore derivato attraverso una formula che incorpora la volatilità del mercato è simile in linea di principio a quelli utilizzati nei sistemi di apprendimento automatico. Questa rappresentazione matematica delle condizioni di mercato offre un'analisi precisa delle tendenze e delle dinamiche dei prezzi, tenendo conto della volatilità intrinseca dei mercati finanziari. Incorporando la volatilità come variabi
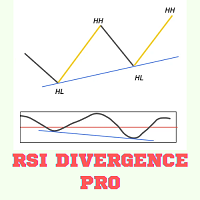
RSI DIVERENCE INDICATOR
RSI divergence is very powerful pattern which is often used to detect a strong trend reversal. it also indicates the weakening of strong signal. So some traders want to use it as the exit criteria. This indicator works in all timeframe and send notification, alert or email to the user. It also show the Higher Highs and Lower Low Pattern with its corresponding RSI divergency. This indicator can be used in Expert Advisors as it has accessible buffers List of Inputs _____

FRB Time - FRB Trader
Indicator that shows the server's time of operation. You can edit the font color and size of the timetable.
Settings font color Font size Background color
To move the Timetable, just click on it and move the mouse to where you want to leave it. After placing the Time where you want it, click again or press "ESC" and the time will stay where you left it.

FRB Candle Time
Indicator showing the time left for the next candle You can edit font color and size. Very important indicator for Traders. To move time, just click on it and move the mouse to where you want to leave it. After positioning the time where you want it, click again or press "ESC" and the time will stay where you left it.
Settings font color Font size Background color
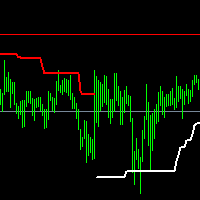
SPT is a trend indicator It is written on the basis of ATR, with clear trend lines indicating the direction in progress, Different traders' understanding of this indicator may form two different purposes Trend-based traders will conduct trend trading when the trend line changes, Respectful shock traders will carry out range trading according to the final support or resistance level marked by this indicator
The index parameters are as follows: Multiplier: multiple of ATR Period: ATR cycle. The

The True Hero Oscillator indicator is designed for signal trading. This indicator generates trend signals.
It uses many algorithms and indicators to generate this signal. It tries to generate signals from the points with the highest trend potential.
This indicator is a complete trading product. This indicator does not need any additional indicators. This product uses 3 main indicators and many algorithms.
The indicator is never repainted. The point at which the signal is given does no

Previous Period High Low . This indicator shows the previous Day, Week, Month and Years High and Low. It's great for price action strategies. : Provides clear and visible breaks in structure. : Easy to see breakout levels. : Easy to see gaps between previous high, low levels after breakouts have occurred. The indicator works on every time frame. Multiple periods can be selected and be seen on the same chart. Every line can be customized to Your liking. Color, style and thickness. Enjoy!
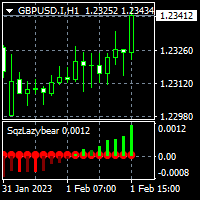
For MT5 version please click here . - This is the exact conversion from TradingView source: "Squeeze Momentum Indicator" By "LazyBear". - This is a non-repaint and light processing load indicator. - Buffers and inputs are available for use in EAs and optimization purposes. - You can message in private chat for further changes you need.
Thanks for downloading...

UR Vortex
The Probabilistic UR Vortex Formula: An Accurate System for Predictive Market Analysis using Volatility and Standard Deviation Calculations. The UR Vortex indicator is a technical analysis tool that uses volatility and standard deviation calculations to predict potential tops and bottoms in a market. It measures the strength of a trend by calculating the distance between the current price and a moving average, and then standardizing this distance by dividing it by the average true
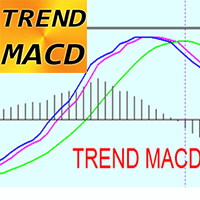
T REND MACD Indicator for MT4 - is great & efficient trading tool! This indicator is great for Trend Traders who are focused to catch big price movements TREND MACD consist of 3 lines: Green line - shows main trend direction , and Blue & Magenta lines for entry and exit. Indicator allows to maximize profit - not to exit from profitable trade too early Indicator has built-in Mobile and PC alerts
HOW TO USE indicator (see pictures): 1) Check if Blue & Magenta lines both are above Green

AC Pivot Panel:
AC Pivot Panel is a pivot point indicator including favorite selection panel accessible in the chart. For pivot traders, it is well convenient to easily and quickly can adjust their pivots setting in the chart. To reaching this goal, a panel has been considered to user can easily switch to each pivot levels by different method and time period. In the current version: All pivots including supports and resistance can be selected to display or disappear in the chart just by

Scopo/Obiettivo Questo è un indicatore di media mobile multi-time personalizzato appositamente per l'Intraday/Trend Trader. Informa il trader della tendenza sul Timeframe H4 indipendentemente dal Timeframe sul grafico mentre il trader identifica i livelli di entrata ed esecuzione nei timeframe inferiori. Adatto per Multi-Frame e Trend Trader. Caratteristiche aggiuntive Attiva/disattiva il pulsante per mantenere puliti gli obiettivi della chat. Indicatore MA aggiuntivo per Time Frame corrente sul

UR PulseScalp Un indicatore di trading calibrato per gli scalper che cercano il massimo vantaggio nei mercati frenetici
UR PulseScalp è una soluzione di trading all'avanguardia per gli scalper che cercano il massimo vantaggio nei mercati frenetici. Questo indicatore innovativo si basa su una formula scientificamente calibrata che combina la potenza di Volatilità, MoneyFlow e Relative Strength per creare un segnale altamente accurato e affidabile.
Vantaggi dell'utilizzo di UR PulseScalp :

Multicurrency and multi-timeframe indicator Inside Bar (IB). In the parameters, you can specify any desired currencies and timeframes. The panel displays the last found Inside Bar (and Mother Bar) pattern, the current price position and the breakout of the levels of the Mother and Inside Bars. You can set the size and color for bars and text in the cells. The indicator can also send notifications when levels are broken. By clicking on a cell with a period, the specified symbol and period will b

MACD (short for M oving A verage C onvergence/ D ivergence) is a popular trading indicator used in technical analysis of securities prices. It is designed to identify changes in the strength, direction, momentum, and duration of a trend in a security's price.
History Gerald Appel created the MACD line in the late 1970s. Thomas Aspray added the histogram feature to Appel's MACD in 1986.
The three major components and their formula 1. The MACD line: First, "PM Colored MACD" employs two Movin
Il MetaTrader Market è un sito semplice e pratico dove gli sviluppatori possono vendere le loro applicazioni di trading.
Ti aiuteremo a pubblicare il tuo prodotto e ti spiegheremo come prepararne la descrizione per il Market. Tutte le applicazioni sul Market sono protette da crittografia e possono essere eseguite solo sul computer dell'acquirente. La copia illegale è impossibile.
Ti stai perdendo delle opportunità di trading:
- App di trading gratuite
- Oltre 8.000 segnali per il copy trading
- Notizie economiche per esplorare i mercati finanziari
Registrazione
Accedi
Se non hai un account, registrati
Consenti l'uso dei cookie per accedere al sito MQL5.com.
Abilita le impostazioni necessarie nel browser, altrimenti non sarà possibile accedere.