Evgeniy Zhdan
Evgeniy Zhdan
2.9 (111)
  • Información
13+ años
experiencia
173
productos
291
versiones demo
1
trabajos
0
señales
0
suscriptores
➖➖➖➖➖➖➖➖➖➖➖➖➖➖➖➖➖➖➖➖➖➖

Products: https://www.mql5.com/en/users/trendhunter/seller

➖➖➖➖➖➖➖➖➖➖➖➖➖➖➖➖➖➖➖➖➖➖

📢 TELEGRAM CHANELL: https://t.me/algotrdr

➖➖➖➖➖➖➖➖➖➖➖➖➖➖➖➖➖➖➖➖➖➖

💬 Channel: https://www.mql5.com/ru/channels/algotrader

➖➖➖➖➖➖➖➖➖➖➖➖➖➖➖➖➖➖➖➖➖➖

https://fundrates.net — real-time crypto funding screener. Track negative funding, spot early trend shifts, and catch reversals before they happen. Be one step ahead.

➖➖➖➖➖➖➖➖➖➖➖➖➖➖➖➖➖➖➖➖➖➖
Evgeniy Zhdan
Evgeniy Zhdan
Discussion, technical support: https://t.me/fxTradingSystems
Evgeniy Zhdan
Evgeniy Zhdan
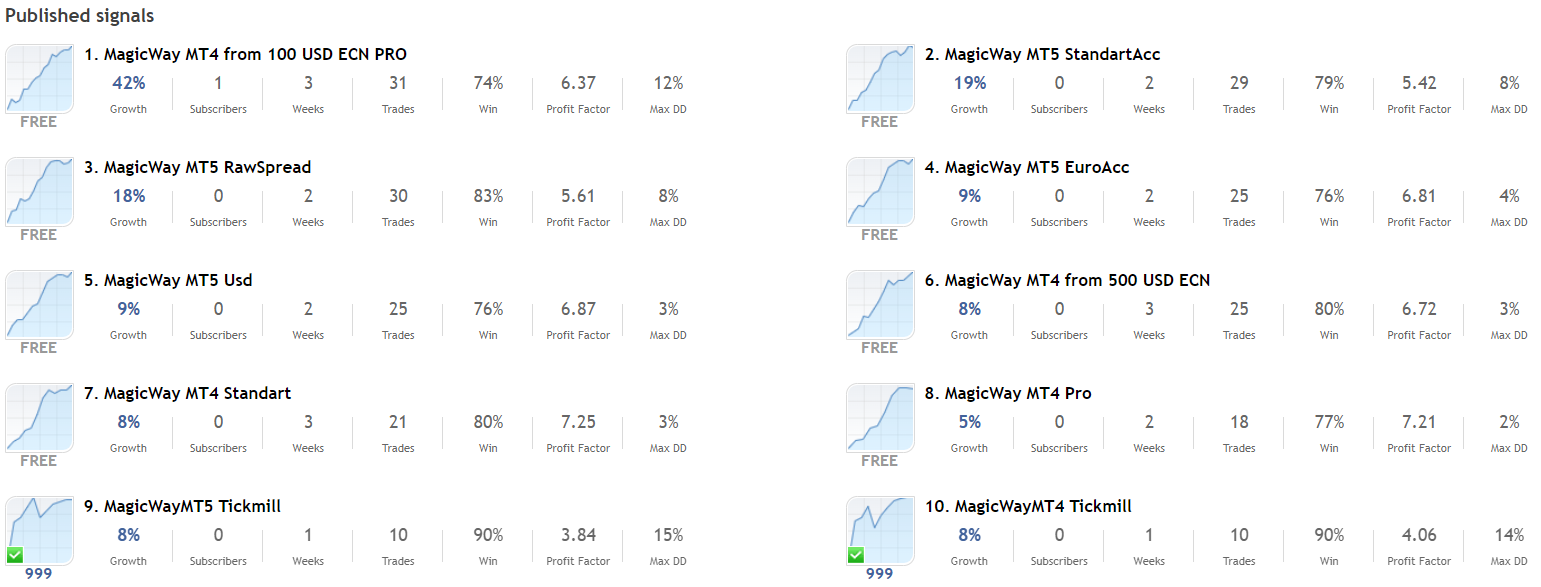
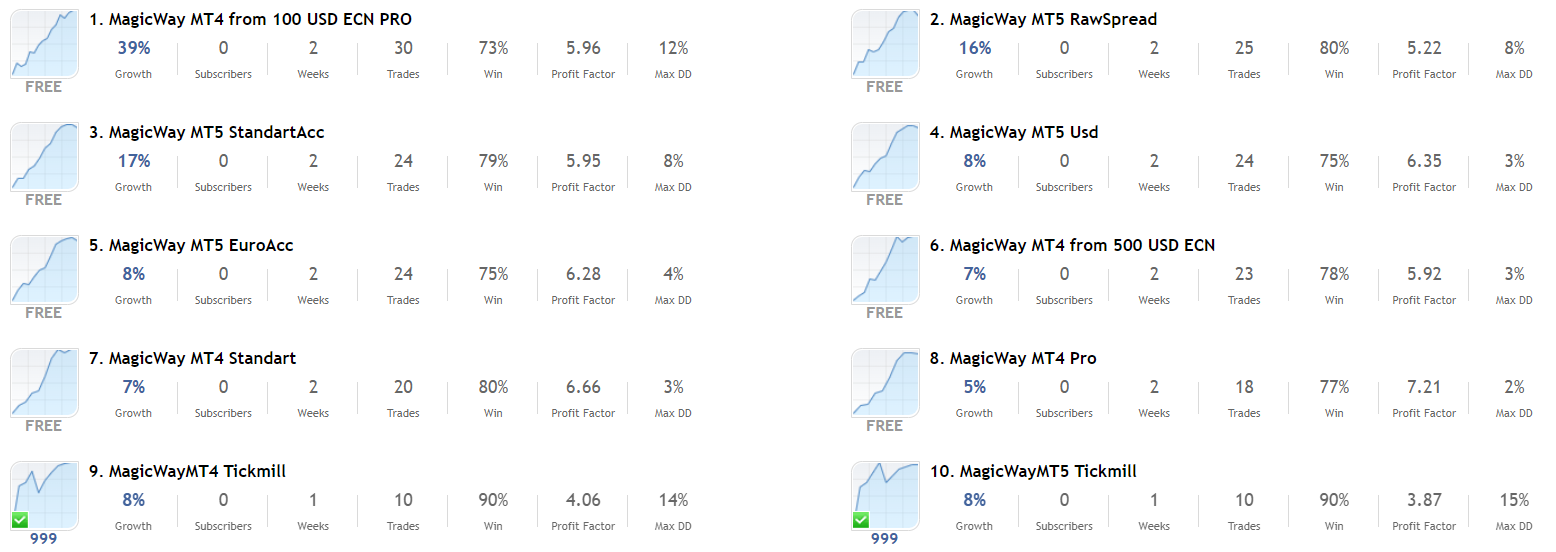
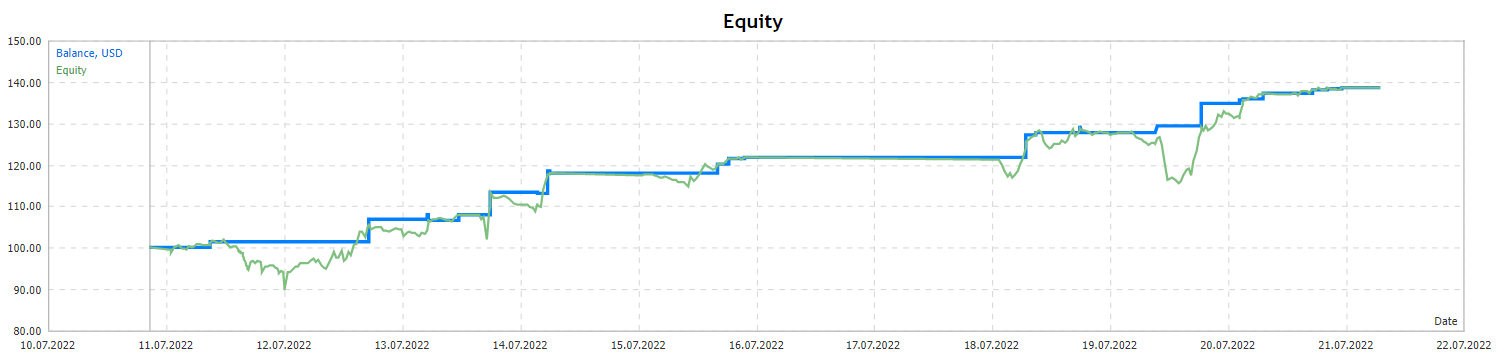
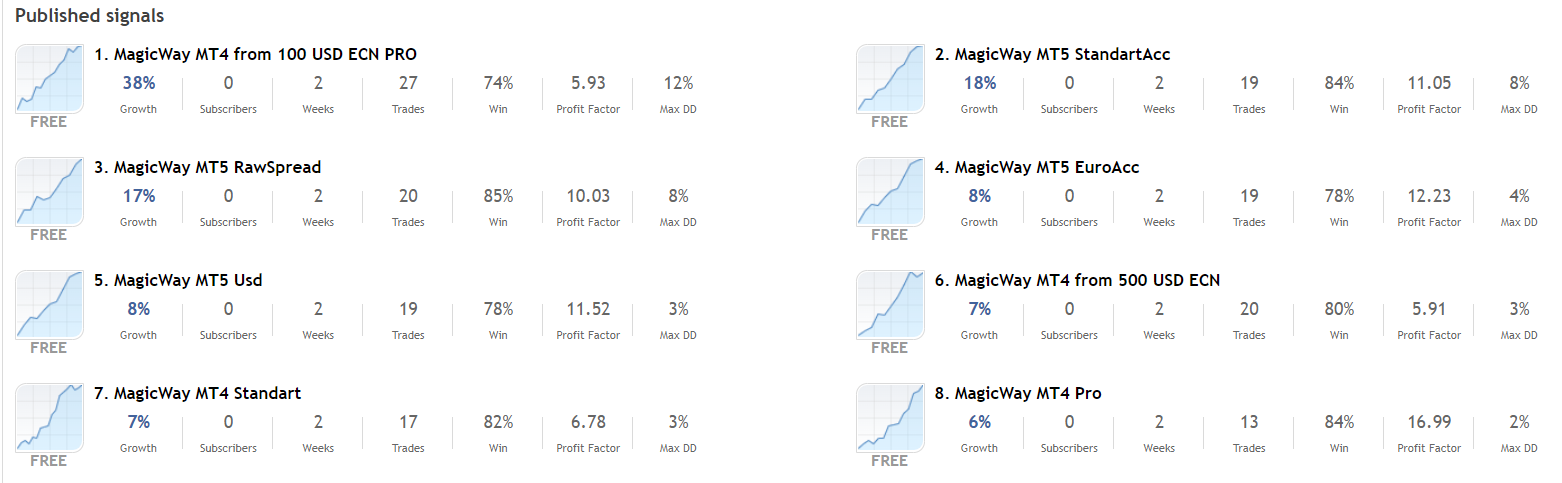
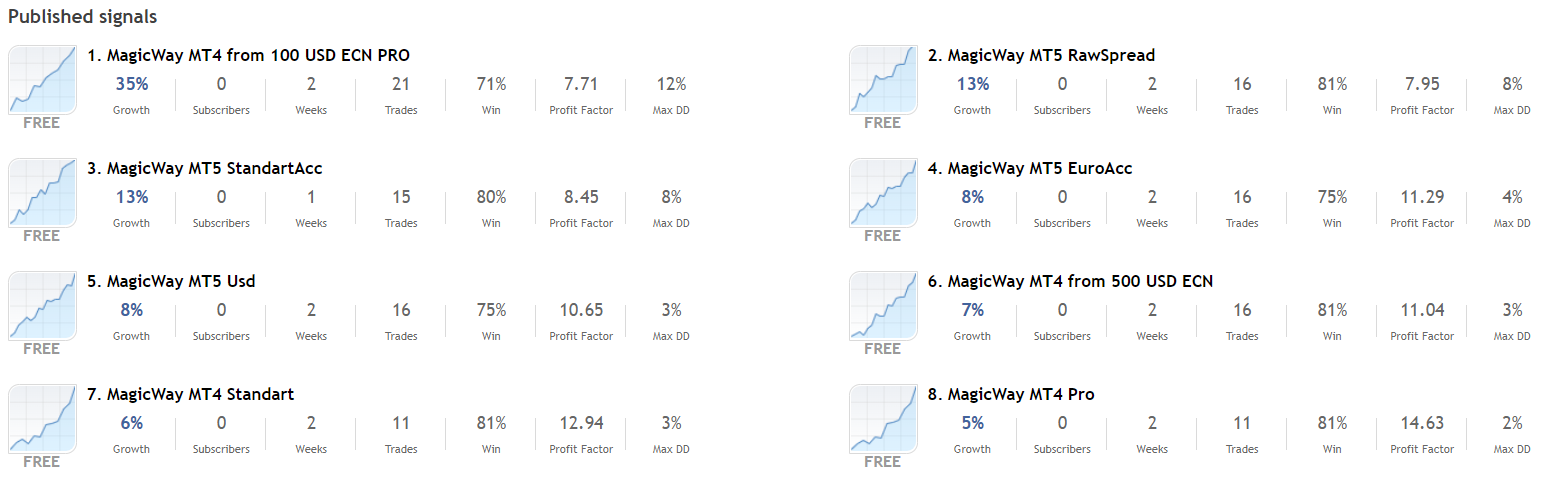
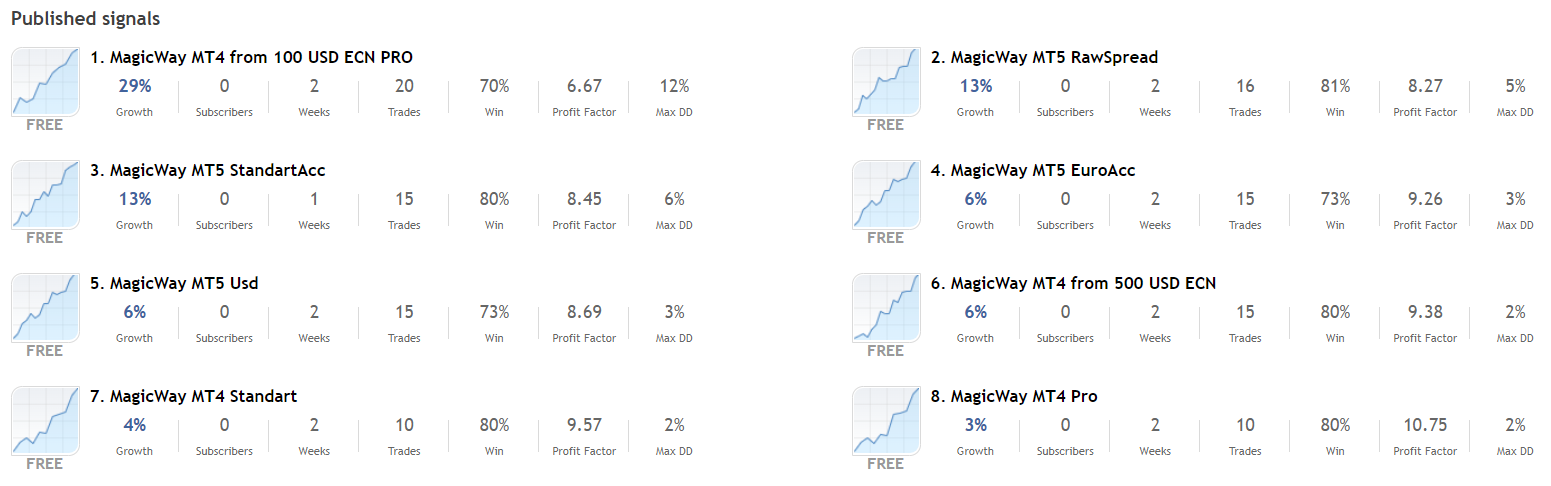
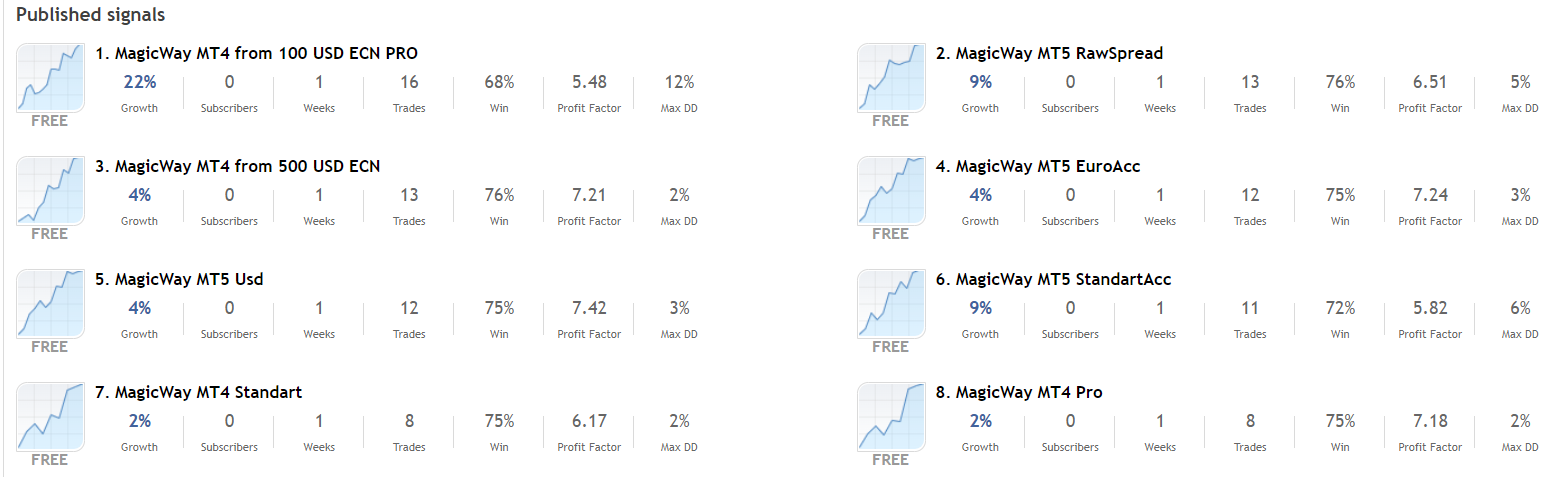
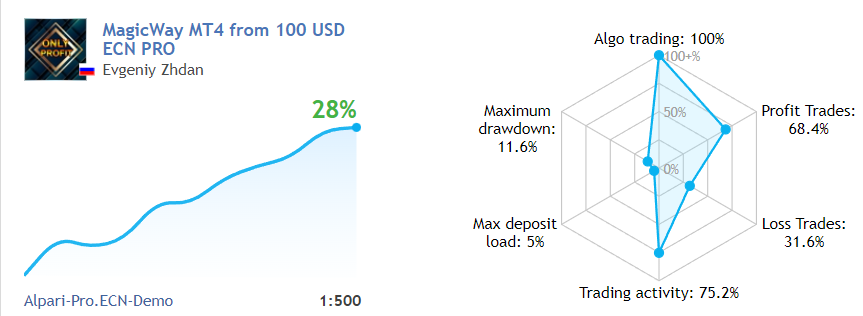
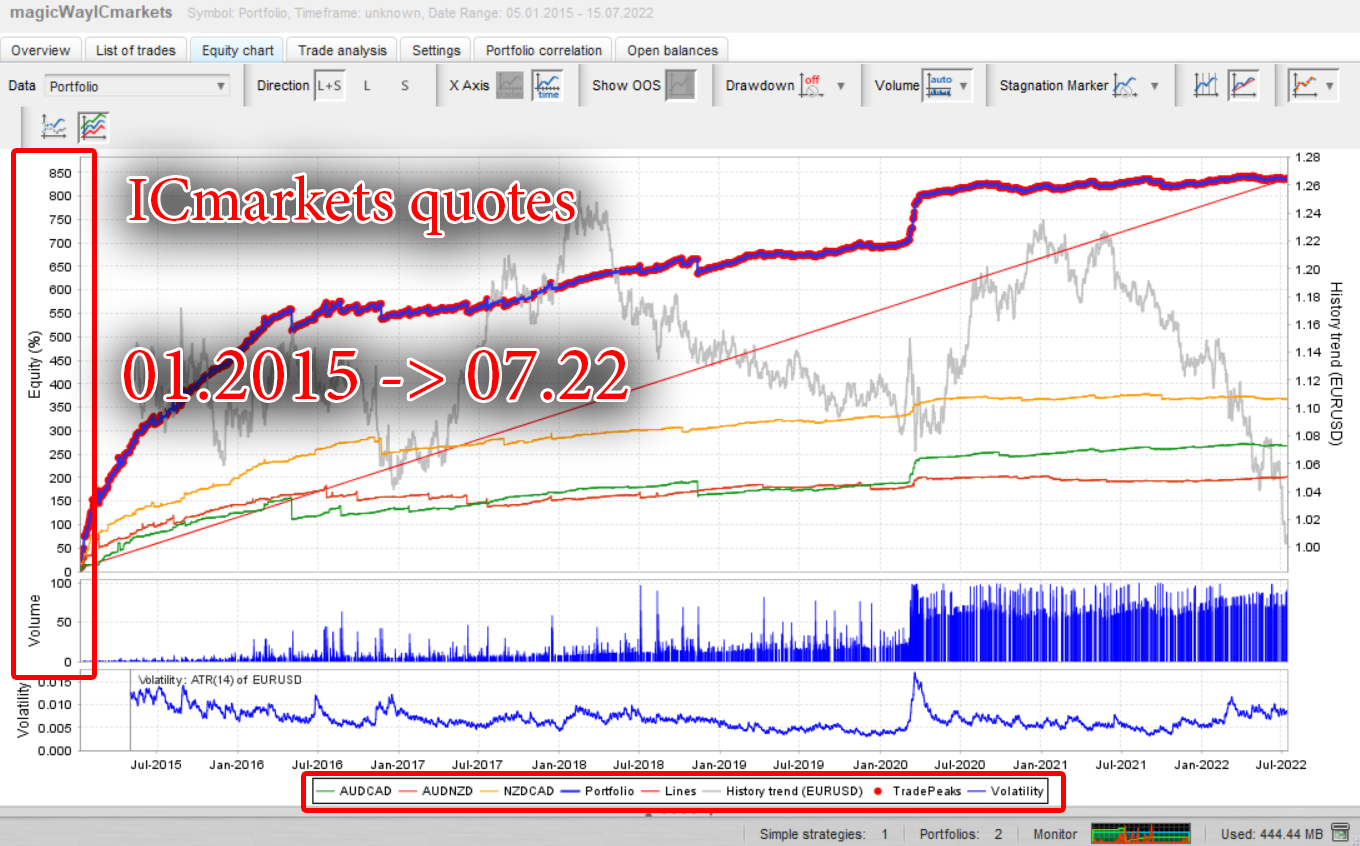
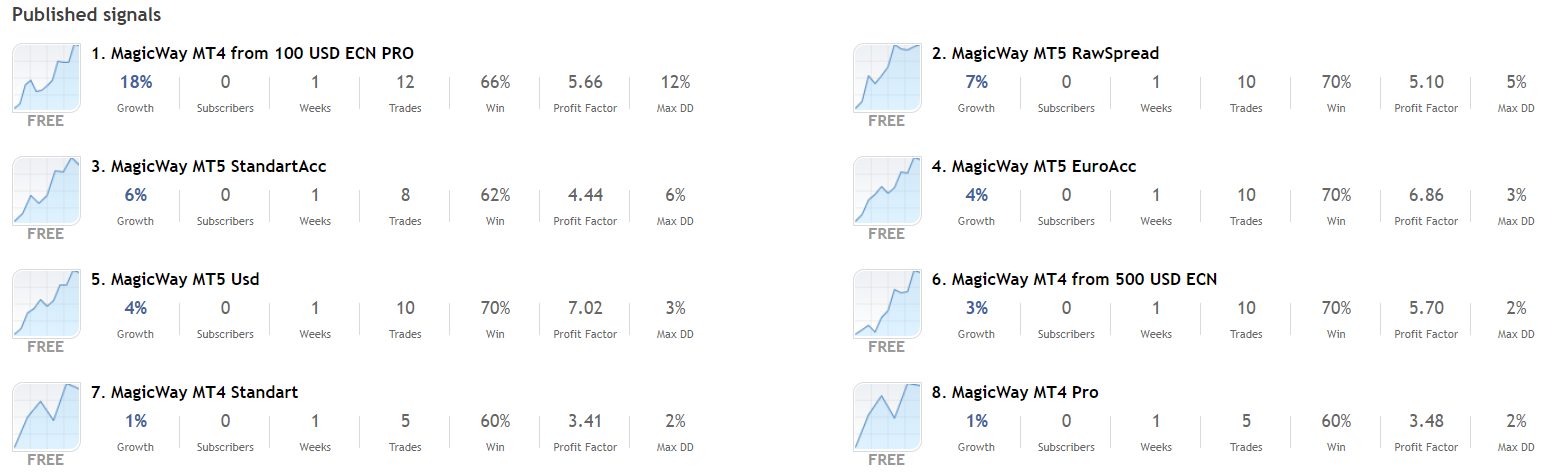
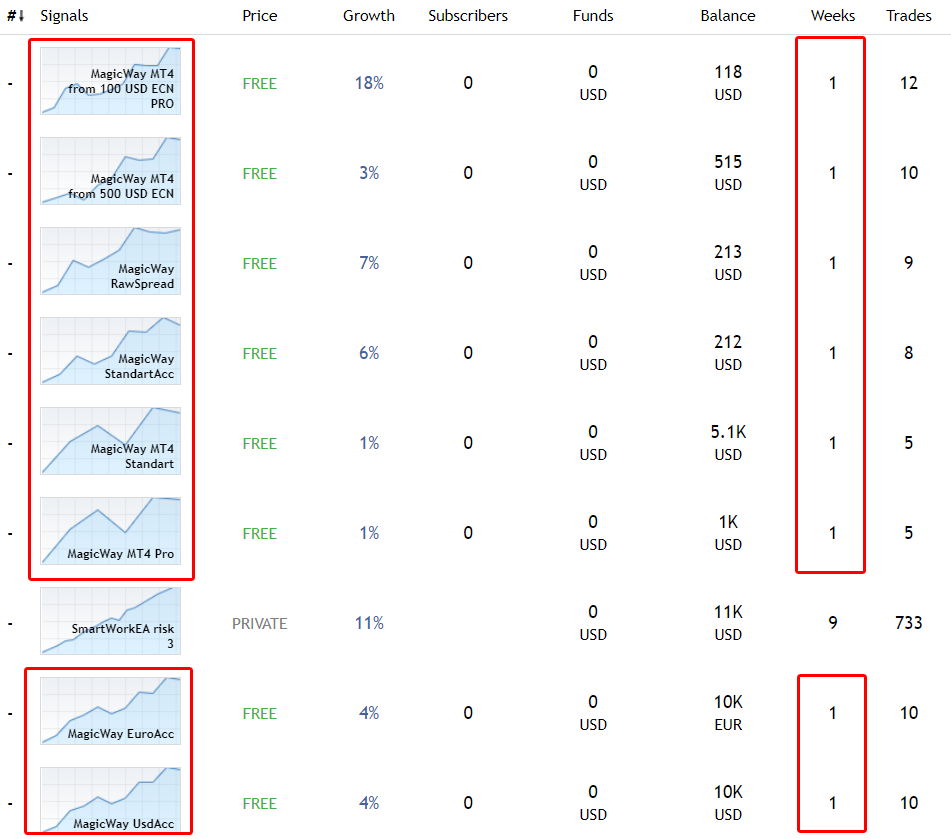
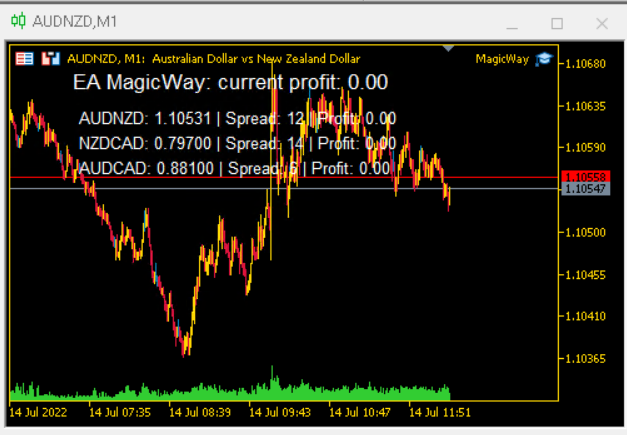
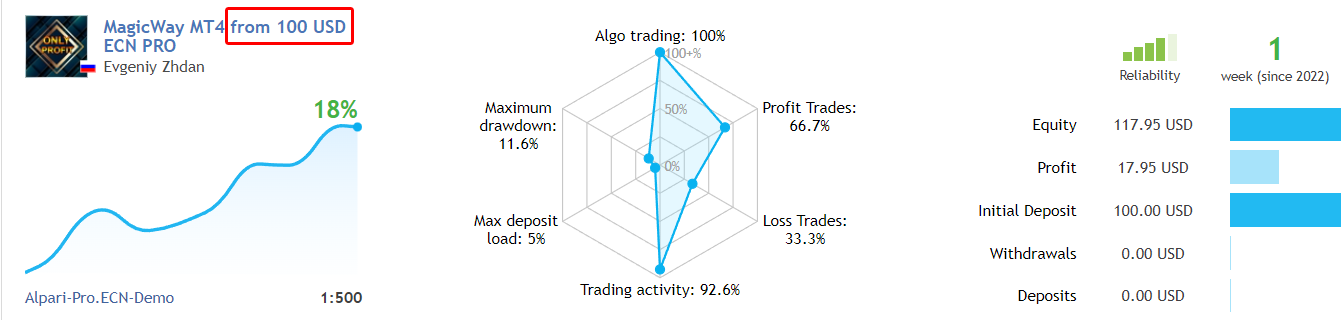
The result of work for 3 trading days. Start with a minimum deposit of $100.

The Expert Advisor is not sensitive to ticks. Works at closing prices.

This is a really working algorithm that fits all types of accounts.

The price will go up. Hurry up to buy now and start earning today.

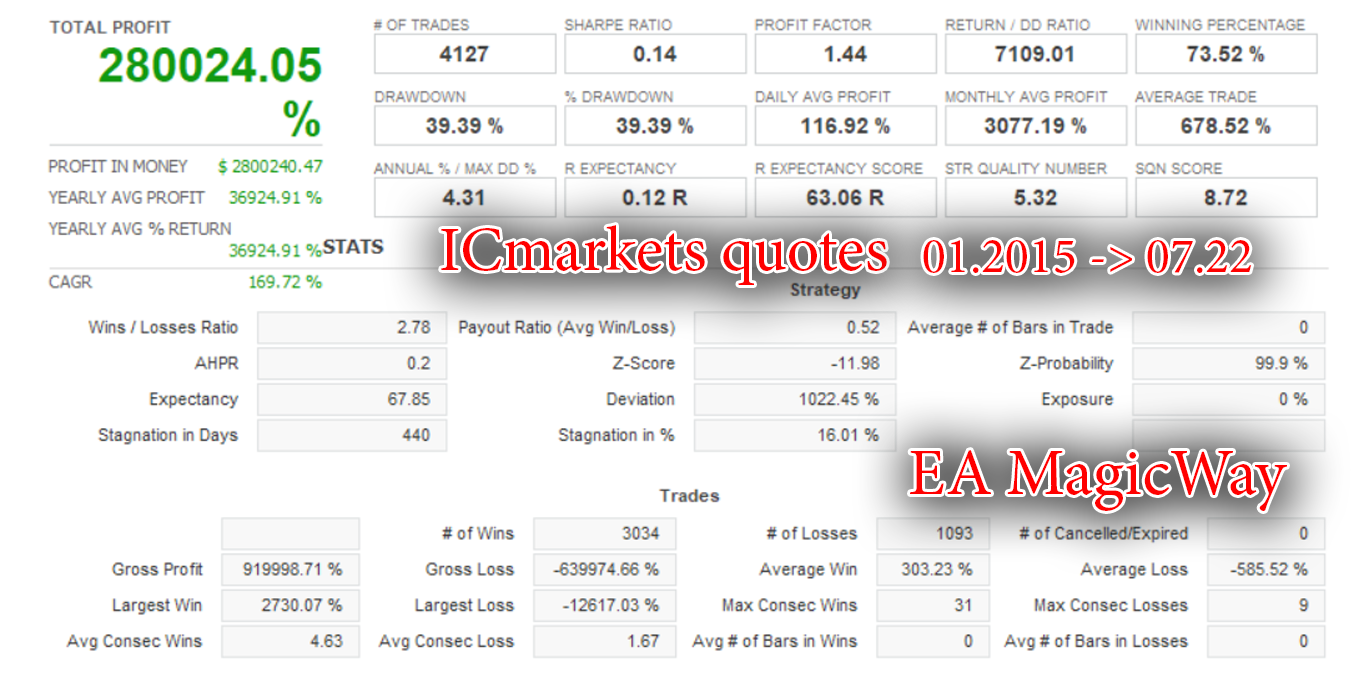
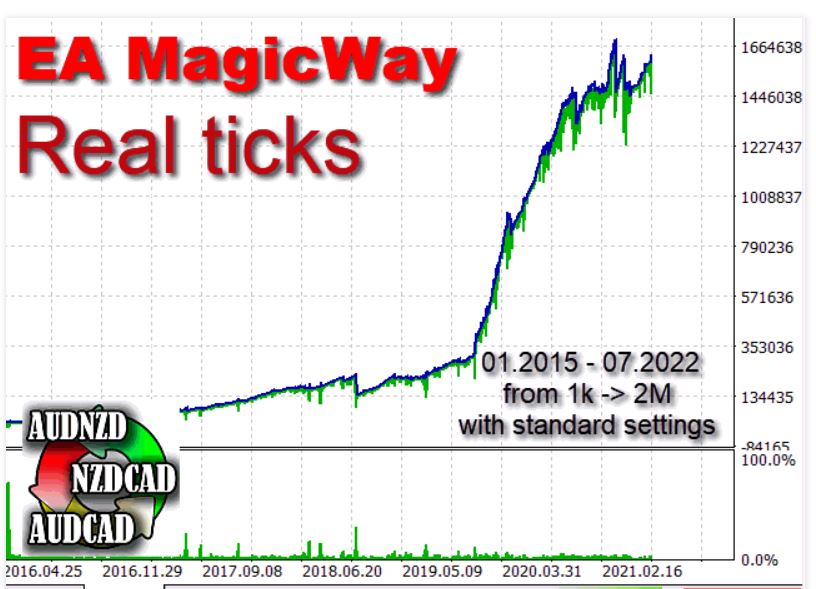
EA MagicWay: https://www.mql5.com/en/signals/1608512
Evgeniy Zhdan
Evgeniy Zhdan
An Expert Advisor with a unique profitable algorithm has successfully started its work!
Evgeniy Zhdan
Evgeniy Zhdan
💹💹💹💹 Indicator for determining flat and trend "Buy and sell zones" 💹💹💹💹

https://www.mql5.com/en/market/product/3793
Evgeniy Zhdan Ha publicado el producto
Comentarios: 1
30.00 USD

The TickCounter indicator counts up and down ticks on each new bar. The calculation starts from the moment the indicator is placed on the chart. Histogram bars represent: Yellow bars - total number of ticks; Blue bars - ticks UP; Red bars - ticks DOWN. If the blue bar is not visible, then there are more down ticks and the red bar is displayed on top of the blue one (the red layer is above the blue one). MT4 version:  https://www.mql5.com/en/market/product/82548 Each reinitialization of the

Evgeniy Zhdan Ha publicado el producto

30.00 USD

El indicador TickCounter cuenta los ticks ascendentes y descendentes en cada nueva barra. El cálculo comienza en el momento en que el indicador se coloca en el gráfico. Las barras del histograma representan : Barras amarillas - número total de ticks; Barras azules - ticks ARRIBA; Barras rojas - ticks ABAJO. Si la barra azul no es visible, entonces hay más ticks hacia abajo y la barra roja se muestra encima de la azul (la capa roja está por encima de la azul). Versión MT5: https: //